Advertisement
If you have a new account but are having problems posting or verifying your account, please email us on hello@boards.ie for help. Thanks :)
Hello all! Please ensure that you are posting a new thread or question in the appropriate forum. The Feedback forum is overwhelmed with questions that are having to be moved elsewhere. If you need help to verify your account contact hello@boards.ie
Hi all! We have been experiencing an issue on site where threads have been missing the latest postings. The platform host Vanilla are working on this issue. A workaround that has been used by some is to navigate back from 1 to 10+ pages to re-sync the thread and this will then show the latest posts. Thanks, Mike.
Hi there,
There is an issue with role permissions that is being worked on at the moment.
If you are having trouble with access or permissions on regional forums please post here to get access: https://www.boards.ie/discussion/2058365403/you-do-not-have-permission-for-that#latest

GIS Help Clinic

  • 20-03-2010 5:15pm
    #1
    Registered Users, Registered Users 2 Posts: 3,483 ✭✭✭


    I'm not a geographer, my field is in economics. However, I am currently working on something which leans heavily on historical economics, and geography. In fact, it was my search for geography people that led me to request this forum! I was having issues with trying to create maps using the Koppen-Geiger Climate Classification system. In fact, if anyone knows how to use GIS, I reckon opening a help/clinic thread for this program might be a good idea!

    Are you using arcview? Sounds good (help thread)! I had similar difficulties using Laslett's classification of family types on irish census data.


«13456

Comments

  • Closed Accounts Posts: 6,609 ✭✭✭Flamed Diving


    I think so, to be honest I never used this stuff in my life but the data I got came in a few formats so I tried it out on what I think was arcview.

    Tell ya what, I will start a GIS thread.


  • Closed Accounts Posts: 6,609 ✭✭✭Flamed Diving


    Ok, so people can post here for help using GIS/Arcview, or post any useful online guides they know of, etc.


  • Registered Users, Registered Users 2 Posts: 3,483 ✭✭✭Ostrom


    Will post as soon as i'm not depending on my phone! Can we link to files?


  • Registered Users, Registered Users 2 Posts: 6,182 ✭✭✭Tiriel


    So, step one down :D What exactly are you trying to do?


  • Closed Accounts Posts: 6,609 ✭✭✭Flamed Diving


    Ok, so I have been using the Köppen climate classification system, with particular focus on the Americas. I would like to be able to break the data down by country (or state) for a more granular analysis, or just for prettier maps for my project. I know what I am looking to take out of this data, but I'm not sure what I can get out of it, other than what I have been doing so far, which is taking the central co-ordinate for each state and using the classification for that (rough, I know) They have provided the data, so what can I do with it? Take Argentina as an example.

    Source:

    http://koeppen-geiger.vu-wien.ac.at/

    More directly:

    http://koeppen-geiger.vu-wien.ac.at/shifts.htm#data

    Wikipedia explanation:

    http://en.wikipedia.org/wiki/K%C3%B6ppen_climate_classification


  • Advertisement
  • Registered Users, Registered Users 2 Posts: 3,803 ✭✭✭El Siglo


    Ok, so I have been using the Köppen climate classification system, with particular focus on the Americas. I would like to be able to break the data down by country (or state) for a more granular analysis, or just for prettier maps for my project. I know what I am looking to take out of this data, but I'm not sure what I can get out of it, other than what I have been doing so far, which is taking the central co-ordinate for each state and using the classification for that (rough, I know) They have provided the data, so what can I do with it? Take Argentina as an example.

    Source:

    http://koeppen-geiger.vu-wien.ac.at/

    More directly:

    http://koeppen-geiger.vu-wien.ac.at/shifts.htm#data

    Wikipedia explanation:

    http://en.wikipedia.org/wiki/K%C3%B6ppen_climate_classification

    Save the zip files to wherever you're saving your data (e.g. your c drive), unzip and save it under a new name, open arc view, and arc catalogue and go to the unzipped file and it should be there. It's been a while since I've used arc but that's what I can remember.


  • Registered Users, Registered Users 2 Posts: 6,551 ✭✭✭SeaFields


    Ok, so I have been using the Köppen climate classification system, with particular focus on the Americas. I would like to be able to break the data down by country (or state) for a more granular analysis, or just for prettier maps for my project. I know what I am looking to take out of this data, but I'm not sure what I can get out of it, other than what I have been doing so far, which is taking the central co-ordinate for each state and using the classification for that (rough, I know) They have provided the data, so what can I do with it? Take Argentina as an example.

    Source:

    http://koeppen-geiger.vu-wien.ac.at/

    More directly:

    http://koeppen-geiger.vu-wien.ac.at/shifts.htm#data

    Wikipedia explanation:

    http://en.wikipedia.org/wiki/K%C3%B6ppen_climate_classification

    I think this is what your are trying to do? Not sure, let me know
    108182.JPG


  • Closed Accounts Posts: 6,609 ✭✭✭Flamed Diving


    Yeah, but there is such a map provided by the website. Is there a way of focusing on one country, to flesh out the different climates within this country? Can the data for one country only be cut out of the dataset?


  • Registered Users, Registered Users 2 Posts: 6,551 ✭✭✭SeaFields


    Yeah, thats possible. The climate data on the above map is in a gridcode. Ive never worked with them before so it would take me a bit to figure it out and i dont got the time today.

    .....but with GIS theres always a way:p

    Actually Cork Girl might know more about gridcode if shes at the GIS full time.

    You gotta get yourself a shapefile of Argentina too but here should help you with that. Some simple map algebra should be able to isolate one polygon from the bigger map but a quick try there and I'm getting an error (but problem solving is half the fun in it!)


  • Registered Users, Registered Users 2 Posts: 6,182 ✭✭✭Tiriel


    Hiya Flamed Diving - from what i make you, you need to use the Spatial Analyst tool to do a raster selection of particular data within the attribute table. If you use the raster calculator, you could select the field for the particular country you want and the field containing the data you wish to portray.

    Is that what you mean?


  • Advertisement
  • Closed Accounts Posts: 6,609 ✭✭✭Flamed Diving


    I think so...

    The way that the data is arranged is by co-ordinates. So, what I would like to do is retrieve all the data for one political entity, like Ireland. In addition, if I could get a map of just Ireland with all the data presented graphically, that would be great.


  • Closed Accounts Posts: 6,609 ✭✭✭Flamed Diving


    Are there any free online guides that people could recommend?


  • Closed Accounts Posts: 85 ✭✭YoureATowel


    Yeah, but there is such a map provided by the website. Is there a way of focusing on one country, to flesh out the different climates within this country? Can the data for one country only be cut out of the dataset?


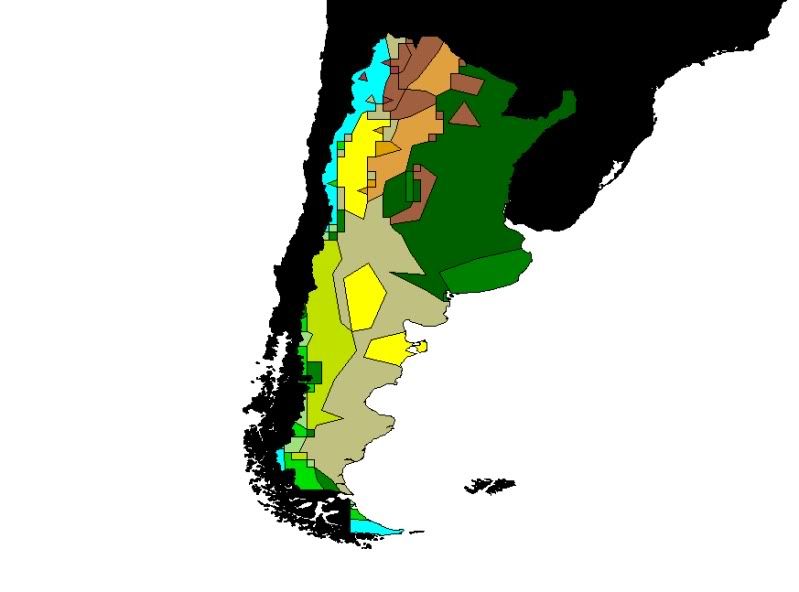
    Hi, is this what you are trying to achieve? Here the climate data for Argentina has been extracted.

    If you tell me what software and version (ArcView 3.2, ArcGIS 9.1, Mapinfo 7.5 for example) you are using I'll explain how to do it.


    argentina.jpg


  • Closed Accounts Posts: 6,609 ✭✭✭Flamed Diving


    That is perfect. I will start work on it again next week, so I will check the university computers to see which it is, though I am sure it is Arcview 3.2.


  • Closed Accounts Posts: 85 ✭✭YoureATowel


    That is perfect. I will start work on it again next week, so I will check the university computers to see which it is, though I am sure it is Arcview 3.2.

    Assuming it's ArcView 3.2 these steps will get you to where you want to be.


    1. Download the file and unzip. All your data is now in a folder called 1901-1925.

    2. Open the Legend.txt file in Notepad. Use Edit-Replace to change the ... to a single comma.

    3. Now insert a new line at the start of the Legend.txt file "Key,Climate". Save and close.

    4. Start ArcView 3.2 with a new View and add the 1901-1925.shp file.

    5. Click on the Tables icon and click Add. Change the filetype to Delimited Text and select legend.txt from the 1901-1925 folder. When you click OK the legend table opens. You can see you have two fields, the Key and the Climate type.

    6. Now open the 1901-1925.shp table. Click on the Key field in the legend.txt table. Then click on the Gridcode field in the 1901-1925 table. Then click the Join icon. The Climate field is now joined to the shapefile.

    7. To make the join permanent first bring View1 to the front and select Theme-Convert to Shapefile. Save as Climate.shp in the 1901-1925 folder. Select Yes at Add shapefile as theme to the view?

    8. Now you have Climate data but it remains unrelated to national boundaries. To resolve this you need a national boundary shapefile. Such a file ships with ArcView 3.2, if installed it will be located at ESRI\ESRIDATA\WORLD\Country.shp. In case you're unable to source it locally I've uploaded the shapefile to http://rapidshare.com/files/367575306/Country.rar.html.

    9. Add Country.shp to your View. As this shapefile has an associated .avl (ArcView Legend) file, it will open with a default legend. As this is unrequired double click on the Country.shp legend to open the Legend Editor. Change Legend Type from Unique Value to Single Symbol and click Apply.

    10. Now open the Country.shp table. Select Table-Properties and set Visible to off for all fields except Country_Name. Click OK. You now have two shapefiles of interest. Country.shp, which contains your national boundary polygons, and Climate.shp, which contains your climate data.

    11. Now Select File-Extensions, select Geoprocessing and click OK. Select View-Geoprocessing Wizard, then select the intersect two themes radio button and click Next.

    12. For Select input theme to intersect choose Country.shp, for Select an overlay theme choose Climate.shp. For Specify the output file navigate to your working folder and call the output ClimateByCountry.shp and click Finish. This may take a few minutes but when completed the ClimateByCountry shapefile will be automatically added to your view.

    13. ClimateByCountry.shp consists of each country divided into its constituent climate type regions. You can select out any country and convert it to separate shapefiles if required.

    14. You will also need to create a legend. Double click on the ClimateByCountry.shp legend. In the Legend Editor choose Unique Value for Legend Type, select Climate for Values Field. You can change the colour for each symbol to those shown on the classification charts if required.


  • Closed Accounts Posts: 6,609 ✭✭✭Flamed Diving


    Brilliant, I can't wait to try it. Thanks!


  • Closed Accounts Posts: 6,609 ✭✭✭Flamed Diving


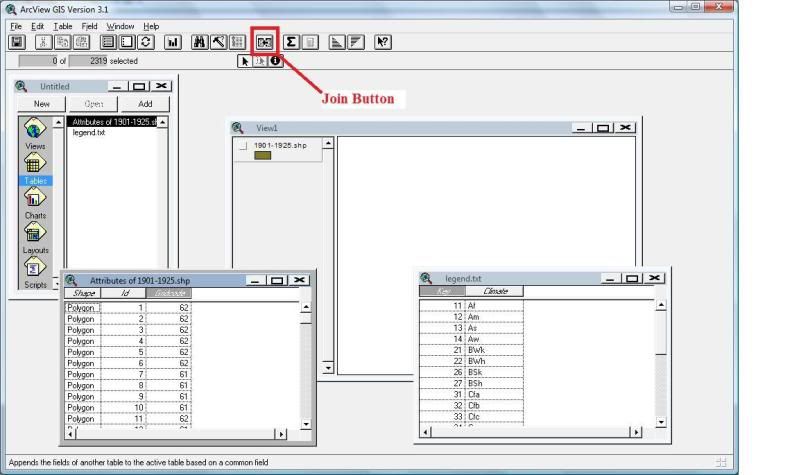
    I got as far as point 6. Where is the Join button?


  • Closed Accounts Posts: 85 ✭✭YoureATowel


    I got as far as point 6. Where is the Join button?

    The Join Button is highlighted below.

    Join_Button.jpg


  • Closed Accounts Posts: 11 DLz


    :) Hey Guys,

    Can someone please recommend a evening/night/weekend course in GIS around the Dublin area? Looking online but can't find anything suitable. Alternatively, I would consider an online course if someone could recommend one. Any help will be appreciated.


  • Registered Users, Registered Users 2 Posts: 6,182 ✭✭✭Tiriel


    Pulling my hair out here! Working on a project where by I have layers of digitised shapefiles and images all set to the projection IRE Transverse Mercator. I want to add in a Raster Dataset, which would enable me to undertake a viewshed/zone of theoretical visibility. (proposed wind turbine).

    When I add the dataset - it doesn't have a projection system assigned and doesn't attach to the dataframe projection. I can't seem to figure out how to set it to the same projection so that all layers sit on top of each other - as they should.

    Any advice?!


  • Advertisement
  • Closed Accounts Posts: 85 ✭✭YoureATowel


    Cork_girl wrote: »
    Pulling my hair out here! Working on a project where by I have layers of digitised shapefiles and images all set to the projection IRE Transverse Mercator. I want to add in a Raster Dataset, which would enable me to undertake a viewshed/zone of theoretical visibility. (proposed wind turbine).

    When I add the dataset - it doesn't have a projection system assigned and doesn't attach to the dataframe projection. I can't seem to figure out how to set it to the same projection so that all layers sit on top of each other - as they should.

    Any advice?!

    It appears to me that your problematic raster dataset isn't georeferenced and hence lacks the information required to align it with your other projected datasets.

    Right click on the raster in the table of contents. Select Zoom To Layer (assuming ArcGIS 9.*). Zoom into the top-leftmost pixel and place the cursor over its top left corner. Does the coord display in the bottom right of the screen say approximately 0,0? Now measure the height and width of a single pixel. Are both one map unit in size?

    If the answer to each question is yes then your raster needs to be georeferenced.

    ArcGIS is assuming that the coordinates of the centre of the top left pixel of the raster is 0,0. It's assuming that the horizontal and vertical distance each pixel represents on the ground is 1 map unit. Finally it's assuming that the rotation about the X and Y axes is 0.

    The correct info should be contained in a World file associated with the raster. A jpg should have an associated jpw file. Likewise a tiff should have a tfw. Such a file can be generated using the Georeferencing toolbar.


  • Closed Accounts Posts: 85 ✭✭YoureATowel


    DLz wrote: »
    :) Hey Guys,

    Can someone please recommend a evening/night/weekend course in GIS around the Dublin area? Looking online but can't find anything suitable. Alternatively, I would consider an online course if someone could recommend one. Any help will be appreciated.

    I know DIT run a brief evening course. Personally, looking at the content and cost, unless you need to get the cert, I'd just buy a load of books off Amazon.


  • Registered Users, Registered Users 2 Posts: 6,182 ✭✭✭Tiriel


    It appears to me that your problematic raster dataset isn't georeferenced and hence lacks the information required to align it with your other projected datasets.

    Right click on the raster in the table of contents. Select Zoom To Layer (assuming ArcGIS 9.*). Zoom into the top-leftmost pixel and place the cursor over its top left corner. Does the coord display in the bottom right of the screen say approximately 0,0? Now measure the height and width of a single pixel. Are both one map unit in size?

    If the answer to each question is yes then your raster needs to be georeferenced.

    ArcGIS is assuming that the coordinates of the centre of the top left pixel of the raster is 0,0. It's assuming that the horizontal and vertical distance each pixel represents on the ground is 1 map unit. Finally it's assuming that the rotation about the X and Y axes is 0.

    The correct info should be contained in a World file associated with the raster. A jpg should have an associated jpw file. Likewise a tiff should have a tfw. Such a file can be generated using the Georeferencing toolbar.

    Thank you!

    Yes, it is lacking georeferencing - under properties/source it is listed as Spatial Reference <undefined>. However the coordinates do not seem to be set at 0,0 as you described above. Units are unknown but there is a reference point there?!

    How do you generate this file.


  • Closed Accounts Posts: 85 ✭✭YoureATowel


    Cork_girl wrote: »
    Thank you!

    Yes, it is lacking georeferencing - under properties/source it is listed as Spatial Reference <undefined>. However the coordinates do not seem to be set at 0,0 as you described above. Units are unknown but there is a reference point there?!

    How do you generate this file.

    As you know a raster is a 2D matrix of cells. However, without georeferencing ArcGIS has no idea where within a spatial reference it is positioned, how it is orientated or how big it is.

    So georeferencing and spatial reference are not the same thing. Georeferencing is actually the process by which a raster dataset is aligned with a spatial reference, ie a map coordinate system.

    Once a raster has being georeferenced you can set the spatial reference to which it has being registered in ArcCatalog.

    It seems to me that there are two possibilities.

    1. Raster is not georeferenced to any spatial reference.
    This would be the case if, as described before, the top-left cell of the raster had coords 0,0 and each cell was 1 map unit x 1 map unit in size.

    2. Raster is georeferenced but to a different spatial reference system.
    This may be the case if the raster is positioned differently than above and each cell size is a multiple or fraction of 1. Here, the raster has being aligned with a spatial reference different to that being used in your project but the spatial reference for the dataset has never set in ArcCatalog.

    To decide which case it is you should answer the following questions.

    A) What are the coords of the top-left cell of the problematic raster.
    B) What is the size of each cell in map units.
    C) In Windows Explorer check what auxiliary file types (*.aux, *.xml, *.tfw etc) are associated with the raster.
    D) In ArcCatalog check the Spatial Metadata of the raster. Its spatial reference may be stated here.

    You can deal with the actual georeferencing, if required, after it is decided what case you are dealing with.


  • Closed Accounts Posts: 11 DLz


    Thanks for your insight!


  • Registered Users, Registered Users 2 Posts: 6,182 ✭✭✭Tiriel


    As you know a raster is a 2D matrix of cells. However, without georeferencing ArcGIS has no idea where within a spatial reference it is positioned, how it is orientated or how big it is.

    So georeferencing and spatial reference are not the same thing. Georeferencing is actually the process by which a raster dataset is aligned with a spatial reference, ie a map coordinate system.

    Once a raster has being georeferenced you can set the spatial reference to which it has being registered in ArcCatalog.

    It seems to me that there are two possibilities.

    1. Raster is not georeferenced to any spatial reference.
    This would be the case if, as described before, the top-left cell of the raster had coords 0,0 and each cell was 1 map unit x 1 map unit in size.

    2. Raster is georeferenced but to a different spatial reference system.
    This may be the case if the raster is positioned differently than above and each cell size is a multiple or fraction of 1. Here, the raster has being aligned with a spatial reference different to that being used in your project but the spatial reference for the dataset has never set in ArcCatalog.

    To decide which case it is you should answer the following questions.

    A) What are the coords of the top-left cell of the problematic raster.
    B) What is the size of each cell in map units.
    C) In Windows Explorer check what auxiliary file types (*.aux, *.xml, *.tfw etc) are associated with the raster.
    D) In ArcCatalog check the Spatial Metadata of the raster. Its spatial reference may be stated here.

    You can deal with the actual georeferencing, if required, after it is decided what case you are dealing with.

    Still having problems with this. Happening to me again in another project now, I am obviously doing something wrong! I have a standard "Counties" file from the CSO and a Corine dataset file downloaded. I have set the projection of both to ITM95, but they are sitting miles apart! Both seem to have the projection set ok. Any ideas?

    Also, does anyone have any good "free" or low cost websites for datasets? Would be very useful!


  • Closed Accounts Posts: 85 ✭✭YoureATowel


    Cork_girl wrote: »
    Still having problems with this. Happening to me again in another project now, I am obviously doing something wrong! I have a standard "Counties" file from the CSO and a Corine dataset file downloaded. I have set the projection of both to ITM95, but they are sitting miles apart! Both seem to have the projection set ok. Any ideas?

    Also, does anyone have any good "free" or low cost websites for datasets? Would be very useful!

    Is the actual projection of both datasets ITM95?

    You say that you have "set" the projection of both to ITM95. What do you mean by this? Have you just gone to ArcCatalog and reset the datasets XY coordinate system to ITM95 from their actual coordinate systems.

    To actually "set" a vector dataset to a certain coordinate system use ArcToolbox-Data Management Tools-Projections And Transformations-Feature-Project.

    Likewise, for a raster dataset use ArcToolbox-Data Management Tools-Projections And Transformations-Raster-Project Raster.

    Can you provide links to the datasets you are working with?


  • Registered Users, Registered Users 2 Posts: 6,182 ✭✭✭Tiriel


    Is the actual projection of both datasets ITM95?

    You say that you have "set" the projection of both to ITM95. What do you mean by this? Have you just gone to ArcCatalog and reset the datasets XY coordinate system to ITM95 from their actual coordinate systems.

    To actually "set" a vector dataset to a certain coordinate system use ArcToolbox-Data Management Tools-Projections And Transformations-Feature-Project.

    Likewise, for a raster dataset use ArcToolbox-Data Management Tools-Projections And Transformations-Raster-Project Raster.

    Can you provide links to the datasets you are working with?

    I was using the Arctoolbox -data management tools - raster projection for the files. So both have the same projection in the source information. I will check for a link to files tomorrow, don't have them with me at home! Really appreciate your help, I am obviously doing something wrong that it keeps cropping up this way. One dataset is just sitting to the bottom left of the other one. Grr!!


  • Registered Users, Registered Users 2 Posts: 6,182 ✭✭✭Tiriel


    Ok finally! For example, I am using a shapefile from the CSO free data, the National Monuments download from here and a Corine file from here - say the first one for example. The National Monuments and CSO layer overlay ok, but the Corine data is floating off to the north east! (all projections set to ITM95). I have attached a pic to try explain!


  • Advertisement
  • Closed Accounts Posts: 85 ✭✭YoureATowel


    Cork_girl wrote: »
    Ok finally! For example, I am using a shapefile from the CSO free data, the National Monuments download from here and a Corine file from here - say the first one for example. The National Monuments and CSO layer overlay ok, but the Corine data is floating off to the north east! (all projections set to ITM95). I have attached a pic to try explain!

    Worked perfectly for me. I'm not sure what you're doing wrong so I'll just outline what I did. The steps are all practically the same.

    A) CSO Cities/Towns
    Step A1. Download this file and rename it to CSO_ING.shp. I correctly assumed that this shapefile is in Irish National grid. In ArcCatalog, right click on CSO_ING.shp and select Properties. On the XY Coordinate System tab choose Select, go to Coordinate Systems\Projected Coordinate Systems\National Grids and choose Irish National Grid.prj. In the next step ArcGIS will now automatically know this shapefile's coordinate system.

    Step A2. Use ArcToolbox-Data Management Tools-Projections And Transformations-Feature-Project to change the coordinate system from ING to WGS84. For Output Coordinate System go to Coordinate Systems\Geographic Coordinate Systems\World and select WGS84.prj. For Geographic Transformation use TM65_To_WGS_1984. Call the output file CSO_WGS84.shp.

    Step A3. Use ArcToolbox-Data Management Tools-Projections And Transformations-Feature-Project to change the coordinate system from WGS84 to ITM. For Output Coordinate System go to Coordinate Systems\Projected Coordinate Systems\National Grids and select IRENET95 Irish Transverse Mercator.prj. For Geographic Transformation use IRENET95_To_WGS_1984_1. Call the output file CSO_ITM.shp.


    B) National Monuments
    Step B1. Download this file and rename it to Archaeology_ING.shp. As a .prj file is included, ArcGIS knows that the projected coordinate system is Irish National Grid.

    Step B2. Use ArcToolbox-Data Management Tools-Projections And Transformations-Feature-Project to change the coordinate system from ING to WGS84. For Output Coordinate System go to Coordinate Systems\Geographic Coordinate Systems\World and select WGS84.prj. For Geographic Transformation use TM65_To_WGS_1984. Call the output file Archaeology_WGS84.shp.

    Step B3. Use ArcToolbox-Data Management Tools-Projections And Transformations-Feature-Project to change the coordinate system from WGS84 to ITM. For Output Coordinate System go to Coordinate Systems\Projected Coordinate Systems\National Grids and select IRENET95 Irish Transverse Mercator.prj. For Geographic Transformation use IRENET95_To_WGS_1984_1. Call the output file Archaeology_ITM.shp.


    C) Continuous urban fabric
    Step C1. Download this file and rename it to Corine_Lambert_AEA.shp. As a .prj file is included, ArcGIS knows that the projected coordinate system is Lambert_Azimuthal_Equal_Area.

    Step C2. Use ArcToolbox-Data Management Tools-Projections And Transformations-Feature-Project to change the coordinate system from Lambert_AEA to WGS84. For Output Coordinate System go to Coordinate Systems\Geographic Coordinate Systems\World and select WGS84.prj. For Geographic Transformation use ETRS_1989_To_WGS_1984. Call the output file Corine_WGS84.shp.

    Step C3. Use ArcToolbox-Data Management Tools-Projections And Transformations-Feature-Project to change the coordinate system from WGS84 to ITM. For Output Coordinate System go to Coordinate Systems\Projected Coordinate Systems\National Grids and select IRENET95 Irish Transverse Mercator.prj. For Geographic Transformation use IRENET95_To_WGS_1984_1. Call the output file Corine_ITM.shp.


    Now you will have three datasets, all in IRENET95 Transverse Mercator projection. Add all three to a new map document and everything should be OK.

    I've also placed the output IRENET95 shapefiles here.


  • Registered Users, Registered Users 2 Posts: 6,182 ✭✭✭Tiriel


    I actually can't wait to work this out tomorrow, having spent hours doing it over and over incorrectly!! Thank you so much for your time.. I will let you know how I get on!


  • Registered Users, Registered Users 2 Posts: 6,182 ✭✭✭Tiriel


    It worked!! I would never have known to do it like that - thank you so much! I can now go and continue working instead of chasing my tail!


  • Registered Users, Registered Users 2 Posts: 6,248 ✭✭✭Rowley Birkin QC


    Anyone have any idea where road layers would be available? Specifically for Cork County.

    Cheers.


  • Closed Accounts Posts: 74 ✭✭lil*lady


    I'm starting to go a bit cuckoo at the moment.
    I've a project to work on that involves using LiDAR in GIS. Basically I've to make a hillshade from that and deduce the various features - sounds easy enough...except I'm really stuck and now my data is coming out all pixelated and even though it looks like it's 3D from afar when you zoom in to get a closer look it's just flat...
    Would anyone have any ideas?


  • Registered Users, Registered Users 2 Posts: 6,248 ✭✭✭Rowley Birkin QC


    Anyone have any idea where road layers would be available? Specifically for Cork County.

    Cheers.

    Anyone at all?


  • Advertisement
  • Registered Users, Registered Users 2 Posts: 6,248 ✭✭✭Rowley Birkin QC


    I'm also trying to export .KMZ files from Google Earth into ArcMap. As I understand it these are in WGS84 by default so I'm skipping the first step as listed above in post #31. I can't get them to sit correctly on my map though when I finish the process and and convert them to ITM.

    Any ideas?


  • Closed Accounts Posts: 85 ✭✭YoureATowel


    I'm also trying to export .KMZ files from Google Earth into ArcMap. As I understand it these are in WGS84 by default so I'm skipping the first step as listed above in post #31. I can't get them to sit correctly on my map though when I finish the process and and convert them to ITM.

    Any ideas?

    You only need to use Step 3 from Post #31, ie Use ArcToolbox-Data Management Tools-Projections And Transformations-Feature-Project to change the coordinate system from WGS84 to ITM. For Output Coordinate System go to Coordinate Systems\Projected Coordinate Systems\National Grids and select IRENET95 Irish Transverse Mercator.prj. For Geographic Transformation use IRENET95_To_WGS_1984_1.

    However, if you are combining data from Google earth .KMZ files with data from other sources than you may encounter problems due to the varying accuracies of the datasets. For example, I have noticed discrepencies of 20 - 100 meters between lines digitised from Google Earth and those same features on 40cm orthophotography.

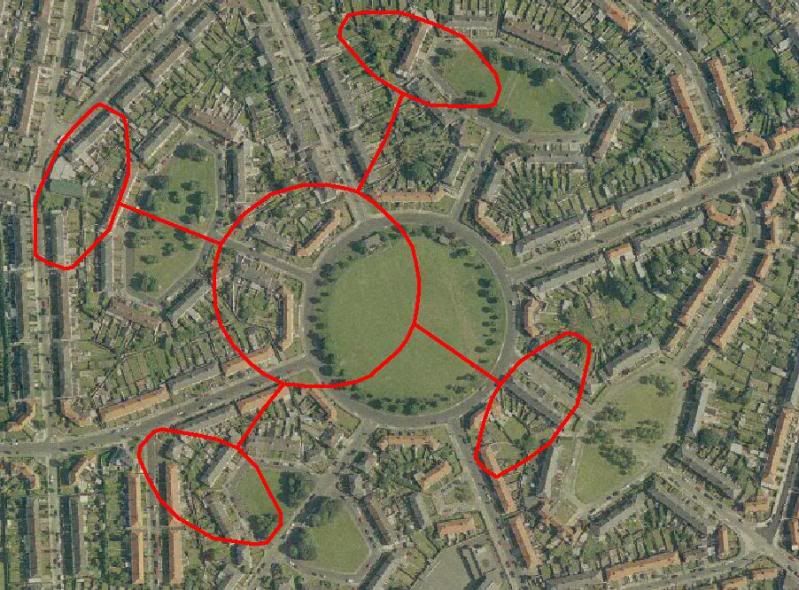
    The image below shows road centerlines of Marino, Dublin digitised from Google Earth and sumperimposed on the commercially available 40cm ortho. The discrepency here is in the order of 70m.

    Marino.jpg


  • Closed Accounts Posts: 85 ✭✭YoureATowel


    lil*lady wrote: »
    I'm starting to go a bit cuckoo at the moment.
    I've a project to work on that involves using LiDAR in GIS. Basically I've to make a hillshade from that and deduce the various features - sounds easy enough...except I'm really stuck and now my data is coming out all pixelated and even though it looks like it's 3D from afar when you zoom in to get a closer look it's just flat...
    Would anyone have any ideas?

    First of all I wouldn't be worried if your hillshade appears to be "just flat" when you zoom in. That's obviously going to happen. It's the same as if you try to watch TV from a distance of 5cm, you're just going to get a pixelated version of what appears normal at 5 meters.

    Ensure that the resolution of your hillshade is not smaller than the resolution of the input surface generated from your LIDAR data. It's probably preferable that they're the same resolution.

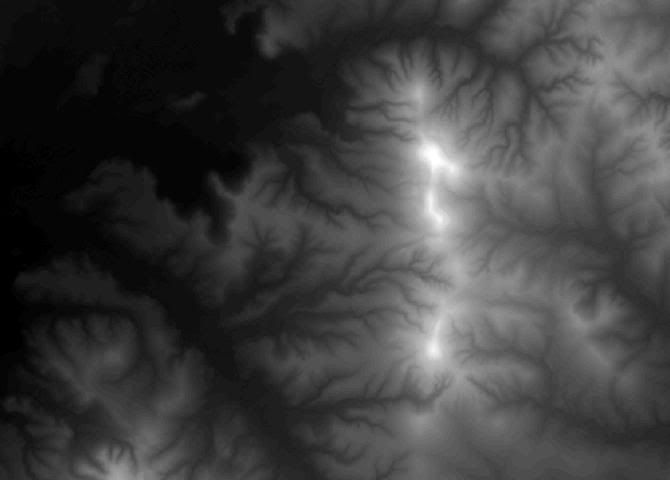
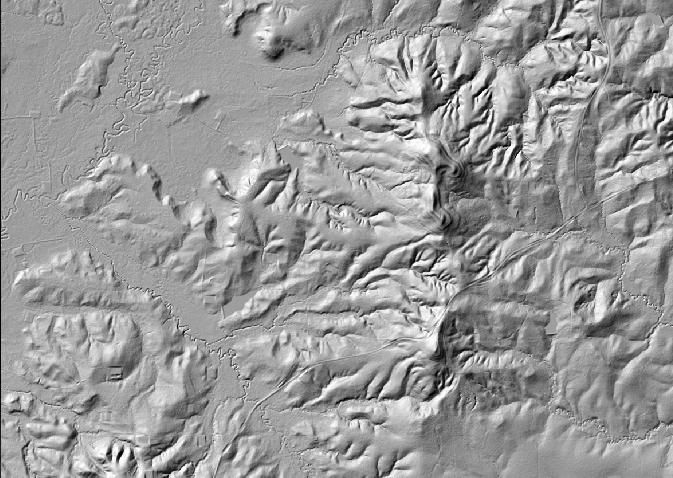
    I generated the following surface from public domain LIDAR data, it has a resolution of 5m.

    Surface1.jpg

    The surface was then used to create this hillshade, also with a 5m resolution.

    Hillshade1.jpg

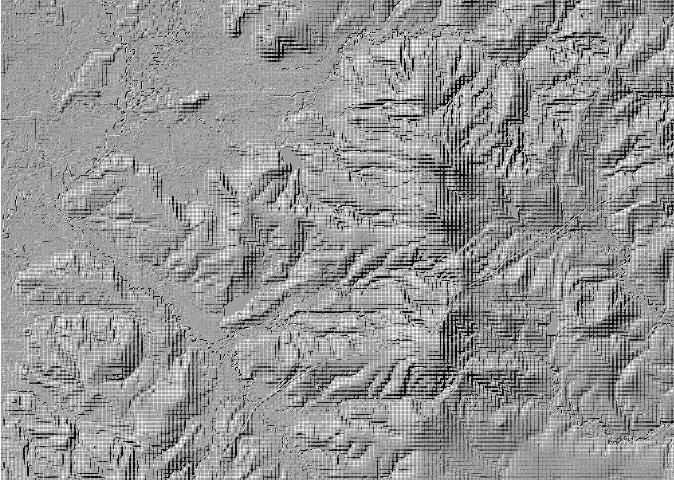
    Look what happens when I use a 1m resolution.

    Hillshade2.jpg

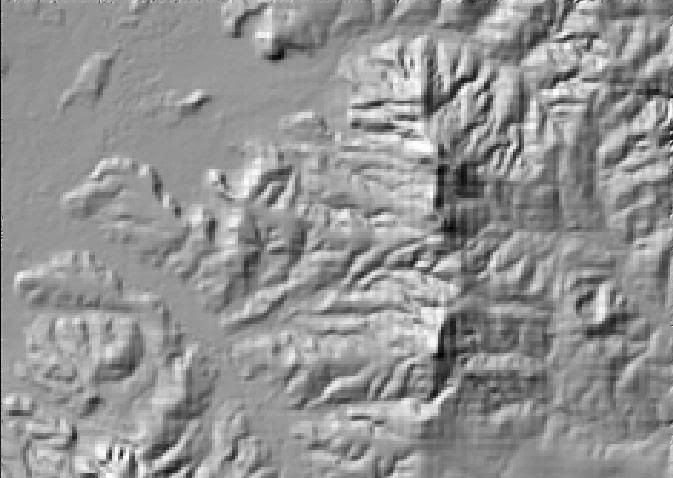
    This is at 25m.

    Hillshade3.jpg

    So dramatically increasing or decreasing the hillshade resolution from that of the input surface produces unsatisfactory results.

    Now lets return to the 5m resolution hillshading. Even though this random example isn't exactly ideal I can still easily pick out the rivers, roads and even lakes

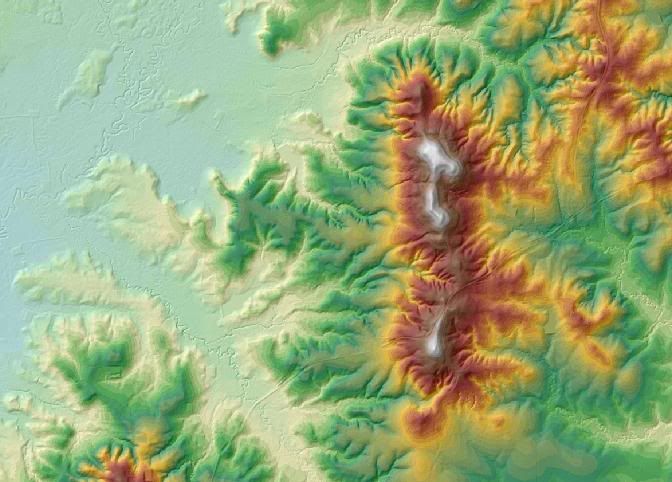
    By classifying the surface, making it transparent and placing it over the hillshading you can get even more dramatic results.

    Hillshade4.jpg

    A 3d scene, incorporating small scale raster mapping of the same area, can also be used to confirm suspected features on the hillshading.

    Map2.jpg


  • Registered Users, Registered Users 2 Posts: 6,248 ✭✭✭Rowley Birkin QC


    I've followed the transformation procedure, both my layers are projected in ITM95 and yet there are massive discrepancies (>100 miles). Any common problems that I can check for?

    I think it's about time we started paying you a wage Youreatowel!! Thanks for all the help so far.


  • Closed Accounts Posts: 85 ✭✭YoureATowel


    I've followed the transformation procedure, both my layers are projected in ITM95 and yet there are massive discrepancies (>100 miles). Any common problems that I can check for?

    I think it's about time we started paying you a wage Youreatowel!! Thanks for all the help so far.

    Is this discrepancy between the two layers you projected to IRENET95 ITM or is it between both these layers and data from another source?

    If it's the former than you have obviously projected one of your layers incorrectly.

    If it's the latter then check the XY Coordinate System tab under Properties of the shapefile in ArcCatalog. It is possible that such a file may be in Irish National Grid but this coordinate system has not being associated with the file. Such a file will have an unknown coordinate system.

    Can you make your unprojected files available, on Rapidshare.com for example?


  • Advertisement
  • Closed Accounts Posts: 74 ✭✭lil*lady


    Thanks very much for your help YoureATowel - very much appreciated, forgot the auld password hence why it took me so long getting back to you, you'd think after the many years that I've been on here that I'd remember it...

    There's one other thing I'm having issues with, which is changing the coordinate system.

    It's in a British system, but I'm trying to get it into the TSM65 Irish one, but it just won't work, maybe I'm doing the wrong thing or maybe there's a shortcut but ArcGIS is asking me for conversion factors, has anyone else come across this?

    All the help is much appreciated thankn you!


  • Closed Accounts Posts: 85 ✭✭YoureATowel


    lil*lady wrote: »
    Thanks very much for your help YoureATowel - very much appreciated, forgot the auld password hence why it took me so long getting back to you, you'd think after the many years that I've been on here that I'd remember it...

    There's one other thing I'm having issues with, which is changing the coordinate system.

    It's in a British system, but I'm trying to get it into the TSM65 Irish one, but it just won't work, maybe I'm doing the wrong thing or maybe there's a shortcut but ArcGIS is asking me for conversion factors, has anyone else come across this?

    All the help is much appreciated thankn you!


    First of all I'm going to assume that your initial data is in OSGB British National Grid, which uses the Airy spheroid, and you want to convert to Irish National Grid, which uses the Airy Modified spheroid.

    If I had to carry out this transformation for a single XY coordinate pair by hand the method would be.

    Step 1. Convert OSGB XY to Airy Lat\Long.
    Step 2. Convert Airy Lat\Long to Airy XYZ (Geocentric Cartesian Coords).
    Step 3. Transform Airy XYZ to Airy Modified XYZ.
    Step 4. Convert Airy Modified XYZ to Airy Modified Lat\Long.
    Step 5. Finally convert Airy Modified Lat\Long to ING XY.

    Thankfully GIS software makes life much simpler. There are two ways you could do it. The first is the same as outlined in Post #31 above, I would always use this method.


    Method 1

    Using this method you will have to use WGS84 as a transitional stage. This is because by default the ArcToolbox component of ArcGIS doesn't have the necessary transformation parameters to carry out Step 3 outlined above.

    For Vector Data

    A. Use ArcToolbox-Data Management Tools-Projections And Transformations-Feature-Project to change the coordinate system from BNG to WGS84. For Output Coordinate System go to Coordinate Systems\Geographic Coordinate Systems\World and select WGS84.prj. For Geographic Transformation use OSGB_1936_To_WGS_1984_1.

    B. Use ArcToolbox-Data Management Tools-Projections And Transformations-Feature-Project to change the coordinate system from WGS84 to ING. For Output Coordinate System go to Coordinate Systems\Projected Coordinate Systems\National Grids and select Irish National Grid.prj. For Geographic Transformation use TM65_To_WGS_1984.

    For Raster Data

    A. Use ArcToolbox-Data Management Tools-Projections And Transformations-Raster-Project Raster to change the coordinate system from BNG to WGS84. For Output Coordinate System go to Coordinate Systems\Geographic Coordinate Systems\World and select WGS84.prj. For Geographic Transformation use OSGB_1936_To_WGS_1984_.

    B. Use ArcToolbox-Data Management Tools-Projections And Transformations-Raster-Project Raster to change the coordinate system from WGS84 to ING. For Output Coordinate System go to Coordinate Systems\Projected Coordinate Systems\National Grids and select Irish National Grid.prj. For Geographic Transformation use TM65_To_WGS_1984.


    Method 2

    1. Start ArcMap and select A new empty map.

    2. Select View then Data Frame Properties.

    3. Choose the Coordinate System tab. Under Select coordinate system double click on Predefined, Projected Coordinate System, National Grids and then select Irish National Grid, ie the coordinate system you want to project to.

    4. Add your OSGB data to the map. A warning should appear. Dismiss this by pressing Close. ArcView will automatically transform your data to Irish National Grid so that it can be displayed in the data frame.

    5. Right click on the newly added layer. Select Data-Export Data.

    6_Vector. For Use the same coordinate system as select the data frame. Give the output file a name and click on OK. This output file is now in Irish National Grid.

    6_Raster. For Spatial Reference select Data Frame (Current). Also select an appropriate output raster format.


  • Closed Accounts Posts: 74 ✭✭lil*lady


    That's really helpful thank you so very very very much, you've really helped me out of a bind. It's always the seemingly "easy" things that get me.
    YourATowel, if you ever need anything drop me a line!


  • Registered Users, Registered Users 2 Posts: 6,248 ✭✭✭Rowley Birkin QC


    Is this discrepancy between the two layers you projected to IRENET95 ITM or is it between both these layers and data from another source?

    If it's the former than you have obviously projected one of your layers incorrectly.

    If it's the latter then check the XY Coordinate System tab under Properties of the shapefile in ArcCatalog. It is possible that such a file may be in Irish National Grid but this coordinate system has not being associated with the file. Such a file will have an unknown coordinate system.

    Can you make your unprojected files available, on Rapidshare.com for example?

    Nail on the head again, a friend helped me figure it out before I got back to this thread (read as; she told me how to do it!) but that was exactly the problem. Thanks again.


  • Registered Users, Registered Users 2 Posts: 3,803 ✭✭✭El Siglo


    I'm a little stuck on the GIS myself (i.e. I've no experience of it and I'm pretty stuck).
    I'm trying to map a salt marsh in Co. Clare, so I sent off for the corine data from the EPA, got it in the post and that's where the problems start.

    Here's what I've managed to get done:
    picture.php?albumid=729&pictureid=6775

    Now I don't know what else to do or what I should be looking out for.

    I've also got GPS coordinates to put into it as well so, that's another issue.


  • Registered Users, Registered Users 2 Posts: 6,182 ✭✭✭Tiriel


    El Siglo wrote: »
    I'm a little stuck on the GIS myself (i.e. I've no experience of it and I'm pretty stuck).
    I'm trying to map a salt marsh in Co. Clare, so I sent off for the corine data from the EPA, got it in the post and that's where the problems start.

    Here's what I've managed to get done:
    picture.php?albumid=729&pictureid=6775

    Now I don't know what else to do or what I should be looking out for.

    I've also got GPS coordinates to put into it as well so, that's another issue.

    I can't see your image there El Siglo!

    Just to note.. you can actually download the Corine 2006 datasets online and then project them following the steps outlined in this thread from Youratowel - I've done this for all of the Corine datasets in the past few weeks.

    Out of curiosity - what kind of timeframe did it take to get the data from the EPA? Was there any cost involved and what co-ordinate system did they provide them in?

    When you say GPS Co-Ordinates, do you need to put a point/shapefile at these locations?


  • Registered Users, Registered Users 2 Posts: 3,803 ✭✭✭El Siglo


    Cork_girl wrote: »
    I can't see your image there El Siglo!

    It's a shit image anyway, just shows like three land uses but I don't know what else to do.
    Just to note.. you can actually download the Corine 2006 datasets online and then project them following the steps outlined in this thread from Youratowel - I've done this for all of the Corine datasets in the past few weeks.

    +1, that helps a fair bit, I'll give it a look over now.
    Out of curiosity - what kind of timeframe did it take to get the data from the EPA? Was there any cost involved and what co-ordinate system did they provide them in?

    Oh, feck all time it was really fast, I think I posted the forms on Thursday, package was delivered by Tuesday, it's just a cd with the data.
    When you say GPS Co-Ordinates, do you need to put a point/shapefile at these locations?

    Yeh, I've the northings and westings and want to put them onto a map somehow.


  • Closed Accounts Posts: 85 ✭✭YoureATowel


    El Siglo wrote: »
    I'm a little stuck on the GIS myself (i.e. I've no experience of it and I'm pretty stuck).
    I'm trying to map a salt marsh in Co. Clare, so I sent off for the corine data from the EPA, got it in the post and that's where the problems start.

    Here's what I've managed to get done:
    picture.php?albumid=729&pictureid=6775

    Now I don't know what else to do or what I should be looking out for.

    I've also got GPS coordinates to put into it as well so, that's another issue.

    What software are you using? Arcview 3.*, ArcGIS, MapInfo?


  • Registered Users, Registered Users 2 Posts: 3,803 ✭✭✭El Siglo


    What software are you using? Arcview 3.*, ArcGIS, MapInfo?

    It was ArcGIS 9.2, it was on a college computer so it had the full package. I think? Yeh it was because it was on a computer with windows xp.


  • Closed Accounts Posts: 85 ✭✭YoureATowel


    El Siglo wrote: »
    It was ArcGIS 9.2, it was on a college computer so it had the full package. I think? Yeh it was because it was on a computer with windows xp.

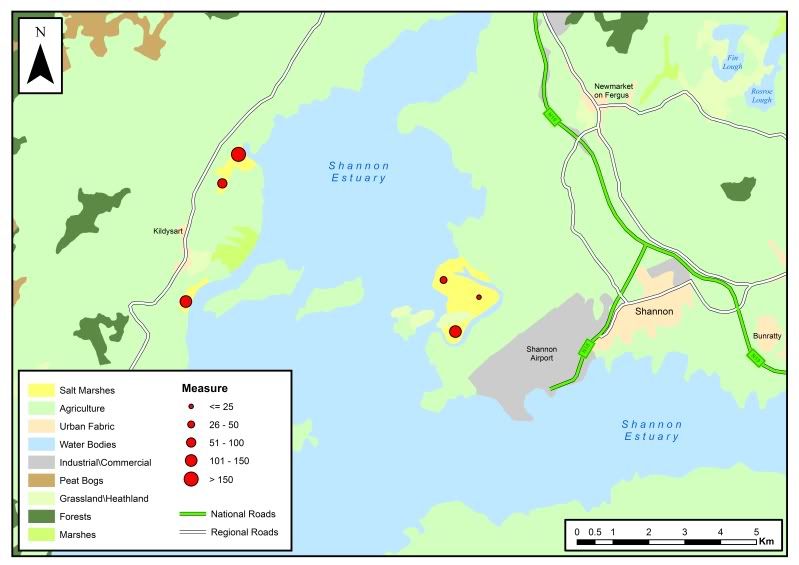
    This might give you a rough idea of what to aim for.

    Shannon_2.jpg

    I downloaded the data from the EEA website, projected it to Irish National Grid. The extent of the files make them quite unwieldy so I then selected out the data relevant to the study area.

    Next I began to group similar layer types. For example, I grouped Intertidal Flats, Water Courses, Water Bodies and Estuaries together and symbolised all four layers the same way.

    In the end I had consolidated the multiple layers that cover the study area into 9 new layers. Salt Marshes, Agriculture, UrbanFabric, Water Bodies, Industrial\Commercial, PeatBogs, Grasslands\Heathlands, Forests and InlandMarshes.

    I used Google Earth to digitise the roads and determine the road, lake, town etc names. I imported this linework into ArcMap and styled it accordingly.

    The next stage was to add a hypothetical point file. I made the assumption that each point reflects a scientific measurement of some type made at a specific location within the salt marshes.


    Adding XY Data to a map.

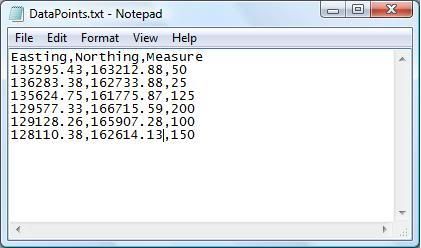
    1. Place all your Easting, Northing, Measurement data into a comma delimited text file. The first line in this file should be the Field Name of the subsequent data. The file should look something like this.

    DataPoints.jpg

    2. Add the textfile to ArcMap. Right click on the textfile name in the table of contents and select Display XY data.

    3. For X Field choose Easting, for Y Field choose Northing. For Coordinate System of Input Coordinates, click Edit, the Select and navigate to the required coordinate system, in this case Irish National Grid. Click Ok to the Object-ID Field warning.

    4. The XY Events are then added. You can now symbolise the points accordingly. I used Graduated Symbols based on the Measure field. The larger the Measure value, the larger the symbol will appear on the map.


    Finally I added a Legend, North Arrow and a Scalebar using the Insert menu.

    It might also be wise to state where you sourced your data.


  • Advertisement
Advertisement