Advertisement
If you have a new account but are having problems posting or verifying your account, please email us on [email protected] for help. Thanks :)
Hello all! Please ensure that you are posting a new thread or question in the appropriate forum. The Feedback forum is overwhelmed with questions that are having to be moved elsewhere. If you need help to verify your account contact [email protected]

GIS Help Clinic

1246710

Comments

  • Closed Accounts Posts: 74 ✭✭lil*lady


    Another query regarding slope, if I want to break up my symbology so that it looks like the attachment, what's the best way to go about it? When I go into the symbology of my slope in arcmap and go to create unique values it tells me that there are too many unique values...is there a way around this?


  • Registered Users Posts: 6,212 ✭✭✭Rowley Birkin QC


    lil*lady wrote: »
    Another query regarding slope, if I want to break up my symbology so that it looks like the attachment, what's the best way to go about it? When I go into the symbology of my slope in arcmap and go to create unique values it tells me that there are too many unique values...is there a way around this?

    I had the same problem myself. Found the solution here: http://resources.arcgis.com/content/kbase?fa=articleShow&d=35053.


  • Closed Accounts Posts: 74 ✭✭lil*lady


    Thanks RBQC, but I still can't seem to be able to break it down into specific sections, seems like it should be an easy thing to do but from what I have it's not like a Layer's symbology (see pdf) so there's no way from what I can see of breaking it up into blocks of eg 5, when I tried to convert it to a layer and went back to arcmap to open it as a layer it kept opening as the slope raster... any ideas of how I could break this up?

    I've gone into reclassify in the spatial analyst tab, and it's broken it down into 1= Green 2=Darker Green 3=Yellow etc, but what I really want is 0-5degrees = Green, 6-10degrees=dark green (for example), any ideas on how to fix that even or how to even figure out what exactly 1, 2 and 3 etc are equal to?

    Thank you again.


  • Closed Accounts Posts: 85 ✭✭YoureATowel


    lil*lady wrote: »
    Thanks RBQC, but I still can't seem to be able to break it down into specific sections, seems like it should be an easy thing to do but from what I have it's not like a Layer's symbology (see pdf) so there's no way from what I can see of breaking it up into blocks of eg 5, when I tried to convert it to a layer and went back to arcmap to open it as a layer it kept opening as the slope raster... any ideas of how I could break this up?

    I've gone into reclassify in the spatial analyst tab, and it's broken it down into 1= Green 2=Darker Green 3=Yellow etc, but what I really want is 0-5degrees = Green, 6-10degrees=dark green (for example), any ideas on how to fix that even or how to even figure out what exactly 1, 2 and 3 etc are equal to?

    Thank you again.

    1. Right click on the layer and select Properties.

    2. Select the Symbology tab.

    3. For Show select Classified. Under Classification select Classify.

    4. Under Classification choose the number of Classes you require,eg 5. For Method choose Manual.

    5. Now you have 5 "blocks" and you can set the upper value of each class. Do this in Break Values. Click OK.

    6. Double click on the Symbol to select a specific colour for each class. You can also modify the Label if required.


  • Closed Accounts Posts: 74 ✭✭lil*lady


    Thanks YourATowel, however when I go to click into Classified I'm asked to pick unique values (see pdf) but then after I hit ok, it just stays on the stretched tab and I can't seem to get to the classified section... :(


  • Advertisement
  • Closed Accounts Posts: 85 ✭✭YoureATowel


    lil*lady wrote: »
    Thanks YourATowel, however when I go to click into Classified I'm asked to pick unique values (see pdf) but then after I hit ok, it just stays on the stretched tab and I can't seem to get to the classified section... :(


    When you click Yes, as long as the number of unique values are within the allowable limit, ArcMap will automatically generate the classes. This may take a while during which ArcMap appears to freeze, but it shouldn't be a problem. What exactly is happening after you click Yes on the Compute Unique Values message?


  • Closed Accounts Posts: 74 ✭✭lil*lady


    When you click Yes, as long as the number of unique values are within the allowable limit, ArcMap will automatically generate the classes. This may take a while during which ArcMap appears to freeze, but it shouldn't be a problem. What exactly is happening after you click Yes on the Compute Unique Values message?

    After I click yes, nothing happens, Arc freezes and stays frozen for up to 20 minutes and then it just crashes. I've no other applications running during this time, so I don't think that's an issue. Is there another way?


  • Closed Accounts Posts: 85 ✭✭YoureATowel


    lil*lady wrote: »
    After I click yes, nothing happens, Arc freezes and stays frozen for up to 20 minutes and then it just crashes. I've no other applications running during this time, so I don't think that's an issue. Is there another way?

    After you click Yes it might appear that ArcMap has crashed, "ArcInfo - Not Responding" may appear on the application title bar. However, ArcMap is in fact working away, calculating a huge number of unique values. It's best to leave it, if you want to continue working in ArcGIS open a seperate application window.

    If it does in fact crash then it's possible that your file is just too big, ie the number of unique slope values is just too many to deal with. Slope is calculated to 6 decimal places, so between 0 and 1 degrees there are 1 million possible slope values. When ArcGIS 9.0 was initially released it was notoriously buggy. ESRI has delt with the vast majority of problems over subsequent releases and patches. However, it is possible that classifying a raster file of the size you have is just beyond it. Just to note I've been messing around with a few raster layers here and have had no problems.

    To get around it you could do this.

    Say you want just three classes like
    >0 & <=10
    >10 & <=20
    >20 & <=30

    1. Go to Spatial Analyst - Reclassify

    2. Click Classify

    3. For Classes select 3

    4. For Method Select Manual

    5. In Break Values input 10, 20, 30 and click OK. You now have 3 classes. One will contain all slopes between 0 and 10 degrees. The next all slopes between 10 and 20. Another for slope between 20 and 30.

    6. For New values input 10, 20, 30 ie the maximum slope value for each class.

    7. Now in Layer Properties - Symbology, I can set the appropriate colour and label for each class.


  • Closed Accounts Posts: 74 ✭✭lil*lady


    Thank you YAT, it worked, thank you very much.


  • Registered Users Posts: 6,212 ✭✭✭Rowley Birkin QC


    Consider the three main components of ArcGIS. They are ArcMap, which you would use for creating maps and editing the geometry of data. ArcCatalog which is used for exploring and managing GIS datasets. Finally there is ArcToolbox which is used for geoprocessing, ie creating derived datasets from your existing files.

    As I'm sure you've seen there are many ways in ArcGIS to achieve the same result. For example, in post #43 I've outlined how you can project data using either ArcMap or ArcToolbox.

    ArcToolbox can be used to permanently project a file from one XY coordinate system to another. To do this it has to know the transformation parameters. ArcToolbox can project between ING and WGS84, it can project between WGS84 and IRENET95_ITM, however it cannot project directly between ING and IRENET95_ITM as it doesn't have the necessary transformation parameters.

    ArcMap, on the other hand, can handle this projection. If you add IRENET95_ITM data to a map containing only ING datasets ArcMap carries out what is called on-the-fly projections. It looks at the newly added layer, it sees that it's in a different XY projected coordinate system. It will project the new data to it's geographic coordinate system, ie Lat, Long. ArcMap knows how to transform GCS_IRENET95 to GCS_TM65 which is used by ING. Next the GCS_TM65 data is projected to ING and can be displayed on the map. This does not create a permanent reprojected file.


    Excellent post YAT. Straightens out a lot for me!

    Just on the last sentence, is it okay to work on a project where a number of shapefiles have different projections but all sit on top of each other due to the "on the fly" projection carried out by ArcMap? In terms of getting correct measurements, showing accurate scales etc. or will I run into big issues down the line? Sorry again if this is a silly question.

    I have a considerable amount of work done for the project I'm working on but thinking of starting again as I've been tinkering around and managed to get all of my layers to sit on top of each other for the first time!


  • Advertisement
  • Closed Accounts Posts: 85 ✭✭YoureATowel


    Excellent post YAT. Straightens out a lot for me!

    Just on the last sentence, is it okay to work on a project where a number of shapefiles have different projections but all sit on top of each other due to the "on the fly" projection carried out by ArcMap? In terms of getting correct measurements, showing accurate scales etc. or will I run into big issues down the line? Sorry again if this is a silly question.

    I have a considerable amount of work done for the project I'm working on but thinking of starting again as I've been tinkering around and managed to get all of my layers to sit on top of each other for the first time!

    It is entirely possible that the different techniques may use slightly different parameters for the transformation of data from one coordinate system to another. As a result, the different methods may throw up slightly different results. If you try it out you may see a slight discrepancy between a file permanently projected using ArcToolbox and a file that is projected on-the-fly by ArcMap.

    The geoprocessing tools provided by ArcToolbox are entirely separate from the ArcMap tools that do the same job, ie their programming is different. When you do a buffer operation using Analysis Tools-Proximity-Buffer the code that is run to carry out the operation is different to that when you use Editor-Buffer in ArcMap.

    The same is true when carrying out projections. However, these projections require transformation parameters. The different techniques may use parameters of varying precision, providing slightly different results.

    Personally, when doing GIS analysis work, I always preferred to project all data to a standard project coordinate system, say Irish National Grid. To put it another way I never used on-the-fly projection and never mixed coordinate systems in ArcMap. I would also always be consistent in the technique used, ie I always used ArcToolbox for projecting.

    However, if you're just making a map for display purposes I wouldn't be too worried.


  • Registered Users Posts: 6,212 ✭✭✭Rowley Birkin QC


    Cheers again for the answer YAT.

    The project I'm working on requires me to come up with some calculations such as energy used per km2 or similar. Data gathering aside I've been thinking of ways to display this in the GIS. So far I've downloaded an extension for ArcMap (ET GeoWizards) and used that to draw a grid on top of my map made up of polygons measuring 2.5km2. After that I'm a bit stumped.

    Ideally I'd like to be able to take my data, click on a grid polygon with the info cursor and be able to call up the figures for that given area. I know it's possible but just wondering how I would go about it.


  • Closed Accounts Posts: 85 ✭✭YoureATowel


    Cheers again for the answer YAT.

    The project I'm working on requires me to come up with some calculations such as energy used per km2 or similar. Data gathering aside I've been thinking of ways to display this in the GIS. So far I've downloaded an extension for ArcMap (ET GeoWizards) and used that to draw a grid on top of my map made up of polygons measuring 2.5km2. After that I'm a bit stumped.

    Ideally I'd like to be able to take my data, click on a grid polygon with the info cursor and be able to call up the figures for that given area. I know it's possible but just wondering how I would go about it.

    You say that you are interested in displaying "energy used per sq km". Before you go any further you would need to have a sourced this "energy used" data. Have you got that far yet? If yes then is it in the form of discrete features, ie points, or is it a continuous surface where each cell has an "energy used" value?


  • Registered Users Posts: 6,212 ✭✭✭Rowley Birkin QC


    You say that you are interested in displaying "energy used per sq km". Before you go any further you would need to have a sourced this "energy used" data. Have you got that far yet? If yes then is it in the form of discrete features, ie points, or is it a continuous surface where each cell has an "energy used" value?

    I have sourced the data by way of a survey of 50 businesses within the study area. However confidentiality was a condition of the businesses volunteering the information so using points is probably out as the businesses will be identifiable.

    In that case a continuous surface where each sq km has a value seems to be the way to go.


  • Closed Accounts Posts: 85 ✭✭YoureATowel


    I have sourced the data by way of a survey of 50 businesses within the study area. However confidentiality was a condition of the businesses volunteering the information so using points is probably out as the businesses will be identifiable.

    In that case a continuous surface where each sq km has a value seems to be the way to go.


    First of all I don't believe a continuous surface would be suitable. The measured value here, "Energy Used", is not a function of its XY location. Unlike height, you can't interpolate the "Energy Used" value at a specific location based on known values at other adjacent locations. It would be like interpolating the population of Athlone based on the populations of Galway and Dublin.

    A better approach maybe to have your study area divided into separate geographic entities (you mentioned using a grid although I'm not sure how that would work). Say the study area is Limerick City, suitable subdivisions of the city may be the city's Electoral Divisions.

    1. Download the EDs from the CSO website and then unzip.

    2. Navigate to the shapefile location in ArcCatalog. Right click - Properties and set the XY Coordinate System to Irish National Grid.

    3. Add the shapefile to ArcMap. Next you want to select out just those polygons located in Limerick city. Selection - Select By Attributes.
    The SQL code to select all EDs in the city of Limerick is "County" = 'Limerick City'

    4. When selected, right click on the layer and choose Data - Export Data to save the selected features as a new shapefile. Call it Limerick_EDs.shp for instance.

    5. Now you have polygons that cover the project area. As you will be normalizing data by area later it's best to add a suitable field now.

    Open the table and choose Options - Add Field.
    For Name input AreaSqKm
    For Type input Double

    6. Right click on this new field, select Calculate Geometry and ignore the warning message.
    For Property choose Area
    For Units choose Square Kilometers [sq km]

    The polygon layer is now ready. I'm fully aware that the Electoral Divisions I'm using here will probably be unsuitable for you project but it gives you an idea.


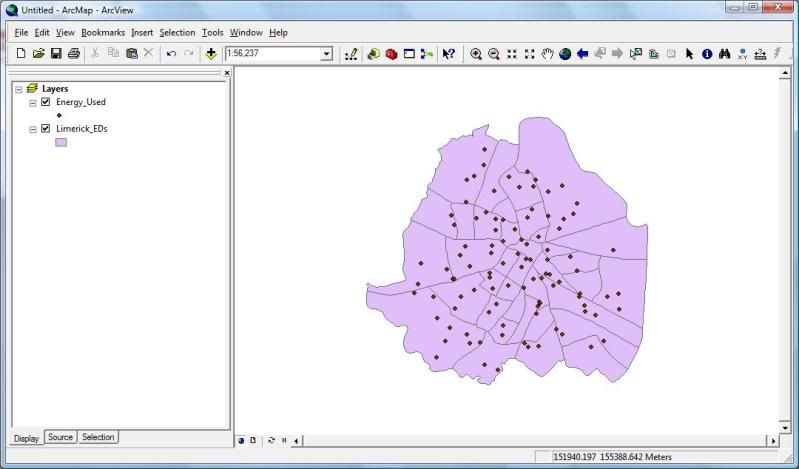
    To replicate your survey data I created 100 randomly located points within the study area. Each point has a random integer value between 0 and 100 representing ""Energy Used".

    Lim1.jpg

    The next stage will help maintain confidentiality by taking the "Energy Used" attribute of each business and applying it to the polygon within which it is located. This way we can get total, average, maximum, minimum values for each polygon.

    1. Right click on Limerick_EDs in the Table of Contents. Select Joins and Relates - Join

    For What do you want to join to this layer? select Join data from another layer based on spatial location. (This is called a spatial join)

    2. For 1 select Energy_Used (ie the points layer)
    For 2 ensure that Average, Sum, Minimum and Maximum are checked
    For 3 choose a suitable location and call the output Limerick_EnergyUsed

    When completed open the new layers table. You will see that each polygon within the project area has
    1) A name, Saps_Label
    2) An area value in square kilometers, AreaSqKm
    3) A count of the number of points that lay within that individual polygon, Count.
    4) The sum of the Energy value of all points that lay within that polygon, Sum_Energy.
    5) The average of those Energy values, Avg_Energy.
    6) The smallest of those values, Min_Energy.
    7) The largest of those, Max Energy.


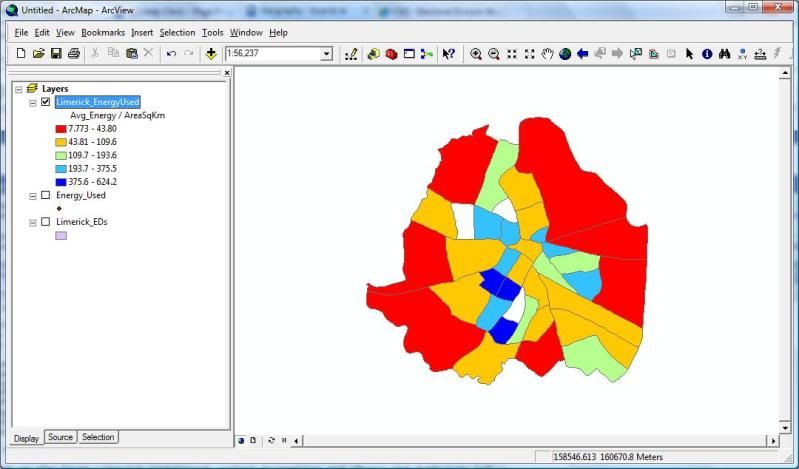
    What I want is to map the Average Energy Consumption of each Electoral Division per Square Kilometer.

    1. Right click on the layer Limerick_EnergyUsed, select Properties and choose the Symbology tab.

    2. Under Show select Quantities-Graduated Colors.

    3. For Fields - Value choose Avg_Energy

    4. For Fields - Normalization choose AreaSqKm

    5. A total of five classes are automatically created. However, the data is skewed by 0 values, ie those polygons inside of which no survey data was present.

    6. Select Classify, select Exclusion, input "Avg_Energy" = 0 and click OK.

    7. You can now modify the number of classes required and choose a suitable Color Ramp. The result is the Electoral Divisions classified by Average Energy Consumption per square kilometer.

    Lim2.jpg


    Alternatively you could create a permanent record of this data.

    1. Add a new field called AvgEngKM of type double.
    2. In Field Calculator input [Avg_Energy] / [AreaSqKm]

    Now when you use the identify tool on an individual Electoral District you can see all the associated data including the Average Energy Consumption per Square Kilometer.


    It's difficult to get a handle on what exactly it is you're trying to do but I hope this helps.


  • Registered Users Posts: 6,212 ✭✭✭Rowley Birkin QC


    Wow, absolutely excellent post YAT. Seems to do exactly what I want.

    Massively indebted to you at this stage. Thanks again.


  • Closed Accounts Posts: 85 ✭✭YoureATowel


    Cork_girl wrote:
    I'm trying to group Corine files into groups such as general Forestry, water bodies, etc. but when I go to data, export I can't export as a .dbf - the only option that will work is as a .shp?
    The file I'm working with is one I have exported before - as I have edited it down to just certain areas etc.
    Am I missing something?!


    What is the source filetype you are trying to export?

    If you are trying to do Step2 of the quoted text and export a csv to dbf then .shp will never be an available option. How could it?

    If instead you are trying to export only the attribute data of a shapefile layer to a dbf then do the following

    1. Right click on the layer and select Open Attribute Table
    2. Click Options - Export. The Export Data dialog will open.
    3. Click the Browse button, ie the icon that looks like an open folder.
    4. For Save as type: ensure dBASE Table is selected.


  • Registered Users Posts: 6,182 ✭✭✭Tiriel


    What is the source filetype you are trying to export?

    If you are trying to do Step2 of the quoted text and export a csv to dbf then .shp will never be an available option. How could it?

    If instead you are trying to export only the attribute data of a shapefile layer to a dbf then do the following

    1. Right click on the layer and select Open Attribute Table
    2. Click Options - Export. The Export Data dialog will open.
    3. Click the Browse button, ie the icon that looks like an open folder.
    4. For Save as type: ensure dBASE Table is selected.

    You were too quick for me! I realised that instead of the .csv file I was using the corine file!! Whoops!! But thank you for your reply. Think it's time to call it a day!


  • Registered Users Posts: 3,483 ✭✭✭Ostrom


    Anyone able to advise on geographically weighted regression? Its been a while since i've used arcview, i have data entered in stata, but need to use spatial predictors.


  • Registered Users Posts: 6,212 ✭✭✭Rowley Birkin QC


    Now when you use the identify tool on an individual Electoral District you can see all the associated data including the Average Energy Consumption per Square Kilometer.


    It's difficult to get a handle on what exactly it is you're trying to do but I hope this helps.

    Just to go back to this YAT, if the study area comprised just one Electoral Divison is there a way to subdivide that further without actually physically drawing the polygons and following the same procedure as you outlined above?


  • Advertisement
  • Closed Accounts Posts: 74 ✭✭lil*lady


    Hi guys, I'm trying to find a way to get heights in corporated into my map also, basically I just need to find the tops of the mountains on my map. Basically what I want to be able to do is have a height parameter included in my attribute table and a way to tell the highest point - mainly just the last one but the rest would be great too.

    I've had a look online and it says that there should be something in my properties tab that says Base Heights, but as you can see from the attachment I don't have that. Any ideas what I can do? I have contours already and I've got slope, but I can figure out how to use them to tell the height of an area when I use the information pointer.

    Thank you in anticipation.


  • Closed Accounts Posts: 85 ✭✭YoureATowel


    efla wrote: »
    Anyone able to advise on geographically weighted regression? Its been a while since i've used arcview, i have data entered in stata, but need to use spatial predictors.

    Would love to have a look at this in detail for you. Unfortunately I'm up to my eyes in study for maths exams at the moment so I haven't really got the time to do the research.

    What type of relationship/dependence are you trying to map?


  • Closed Accounts Posts: 85 ✭✭YoureATowel


    Just to go back to this YAT, if the study area comprised just one Electoral Divison is there a way to subdivide that further without actually physically drawing the polygons and following the same procedure as you outlined above?

    You should repeat the process if you are introducing smaller polygons than used initially.

    First of all the data for this single Electoral Division is a summarised version of the original survey data. If you wanted to split this polygon in two and redefine the numerical attributes of the new polygons to be proportional to the area of the original, then you are introducing unnecessary error.

    For example, if the original polygon is split 75/25 and the attributes are redefined accordingly then the AverageValue, TotalValue,
    MinValue, MaxValue of the larger polygon will be simply give a value of 75% of the original polygons values. Obviously in this case that makes no sense.

    You can easily split a polygon using the Editor menu, however the new polygons will inherit the attributes of the parent polygon.

    You could also intersect your polygon with other features but there would also be issues with this method.

    So you're better off repeating the process if you need to subdivide the study area.


  • Closed Accounts Posts: 85 ✭✭YoureATowel


    lil*lady wrote: »
    Hi guys, I'm trying to find a way to get heights in corporated into my map also, basically I just need to find the tops of the mountains on my map. Basically what I want to be able to do is have a height parameter included in my attribute table and a way to tell the highest point - mainly just the last one but the rest would be great too.

    I've had a look online and it says that there should be something in my properties tab that says Base Heights, but as you can see from the attachment I don't have that. Any ideas what I can do? I have contours already and I've got slope, but I can figure out how to use them to tell the height of an area when I use the information pointer.

    Thank you in anticipation.


    The Base Heights thing is a feature of ArcScene. You apply a surface as the base heights of a feature dataset, the features can then be viewed in 3D.

    Not exactly sure what you are trying to achieve here. You already have a surface from which you generated the contours and slope. This will give you the height at any point.

    Are you talking about spot heights, the traditional way to show heights of mountain tops on maps? If so use Spatial Analyst - Convert - Raster To Feature to create a regular grid of points containing the height attribute of each cell in the surface. Note that the grid interval will be the same as the Cell Size. Select out the points you want and you have your spot heights.


  • Registered Users Posts: 3,483 ✭✭✭Ostrom


    Would love to have a look at this in detail for you. Unfortunately I'm up to my eyes in study for maths exams at the moment so I haven't really got the time to do the research.

    What type of relationship/dependence are you trying to map?

    Settlement altitude, population density, and land use as predictors of settlement type (my own index based on extent of partnership leases per e.d.). Also some variables on proximity to ports and market towns. Just wondering if it can be done in arc view or if it just matches weights to your data points for analysis in stata. If it is the latter, i might just take the measurements myself from the paper maps, as i'm assuming its a big job to scan and geo reference? They're all 19th century. edit-please dont go looking for anything, worry about your exams!!


  • Closed Accounts Posts: 74 ✭✭lil*lady


    Are you talking about spot heights, the traditional way to show heights of mountain tops on maps?

    Thanks YAT, very helpful and much appreciated.


  • Registered Users Posts: 6,212 ✭✭✭Rowley Birkin QC


    Looking for some help in importing some MapInfo data to ArcMap.

    I've obtained the data from this CD from a colleague. Now while the website states that the data is in the ArcGIS format the data I received is in .dwg, .map, .tab, .dat and .id formats which appears to indicate that it is CAD and MapInfo data.

    I've looked online and there seems to be various tools to convert/import .MIF files to ArcMap but cannot find anything detailing how to import files such as those I have listed above. Anyone have any ideas?

    I'm also wondering if the cd that my colleague obtained was in fact the correct one but cannot do anything about this until Monday so this is what I'm working with for the weekend.

    Cheers.


  • Registered Users Posts: 17,958 ✭✭✭✭RuggieBear


    the dwg file will open in arcgis. perhaps the mapinfo tab file is just a duplicate of this.

    the mapinfo stuff probably won't unless you have something like the data interoperability extension or FME.

    Mapinfo does have a universal translator tool. perhaps it's possible to download a trial version of mapinfo and get access to the tool.


  • Registered Users Posts: 6,212 ✭✭✭Rowley Birkin QC


    RuggieBear wrote: »
    the dwg file will open in arcgis. perhaps the mapinfo tab file is just a duplicate of this.

    the mapinfo stuff probably won't unless you have something like the data interoperability extension or FME.

    Mapinfo does have a universal translator tool. perhaps it's possible to download a trial version of mapinfo and get access to the tool.

    Yeah the .dwg file opens fine but it's not the data I need.

    I have the data interoperability extension but didn't have it switched on. Getting a "Failed to Execute" message though when trying the quick import. Will try again but this may have to wait til Monday!

    Cheers Ruggie.

    Opened a new session of ArcMap and got this to work. Having that extension switched on opened up the file types that I needed to work with.


  • Advertisement
  • Registered Users Posts: 225 ✭✭ManAboutCouch


    I find the 'OGR Layer Converter' plugin for QGIS to be a very useful tool when faced with a range of data formats. I use it most often for converting MapInfo to .shp.

    You can find out more about QGIS at www.qgis.org - it's free and pretty comprehensive, if lacking much of the polish that commercial software has.


Advertisement