Advertisement
If you have a new account but are having problems posting or verifying your account, please email us on [email protected] for help. Thanks :)
Hello all! Please ensure that you are posting a new thread or question in the appropriate forum. The Feedback forum is overwhelmed with questions that are having to be moved elsewhere. If you need help to verify your account contact [email protected]

GIS Help Clinic

1468910

Comments

  • Closed Accounts Posts: 74 ✭✭lil*lady


    One last thing -final I promise-I have previously made bookmarks of certain parts of my map and had thought that they were at a smaller scale - ie I want a big main map at 1:35,000 and smaller ones of 1:15,000 and 1:5,000 scale.

    When I set the scale it does it the same for all of the bookmarks and I can't seem to zoom in, do you know how I can set the bookmarks to a certain scale too?

    Thanks very much again.


  • Closed Accounts Posts: 85 ✭✭YoureATowel


    lil*lady wrote: »
    One last thing -final I promise-I have previously made bookmarks of certain parts of my map and had thought that they were at a smaller scale - ie I want a big main map at 1:35,000 and smaller ones of 1:15,000 and 1:5,000 scale.

    When I set the scale it does it the same for all of the bookmarks and I can't seem to zoom in, do you know how I can set the bookmarks to a certain scale too?

    Thanks very much again.


    Read my previous post again about setting a reference scale. It would appear that you have done it incorrectly and have set a Fixed Scale on the Data Frame tab of the Data Frame Properties dialog.

    Go to View-Data Frame Properties. Select the Data Frame tab and set Extent to Automatic. Next select the General tab and set the Reference Scale option.


  • Registered Users Posts: 19 blue412


    Hi!

    Could anybody please help me!!!

    I have an aerial photo of a site. I'm mapping out habitats on that site with polygons, and I would like to add a real scale and work out habitat sizes. But the photo doesn't have an co-ordinates or grid references associated with it.

    Could anybody advise please? I can work out the co-ordinates roughly from a paper map (or even this website http://www.gridreference.ie/) that I have for points on the photo, but can I enter those manually? I read some stuff about XY data, but I'm not sure where to go from there.

    Thanks - losing plot as spend all day on this yesterday, but it still wouldn't work!


  • Registered Users Posts: 6,182 ✭✭✭Tiriel


    You need to georectify the image using common points on the image and the map that you are using. I normally use ERDAS software to do this but I think there is a way in ArcMap too. There are also open source options. Do you by any chance have access to a GPS to take points for areas on the map - you will need to be pretty accurate with your xy points so that it will be correctly rectified.

    What software are you using/have access to?
    If ArcGIS - this may help: http://adielflitzow9.files.wordpress.com/2008/02/georectify.pdf
    blue412 wrote: »
    Hi!

    Could anybody please help me!!!

    I have an aerial photo of a site. I'm mapping out habitats on that site with polygons, and I would like to add a real scale and work out habitat sizes. But the photo doesn't have an co-ordinates or grid references associated with it.

    Could anybody advise please? I can work out the co-ordinates roughly from a paper map (or even this website http://www.gridreference.ie/) that I have for points on the photo, but can I enter those manually? I read some stuff about XY data, but I'm not sure where to go from there.

    Thanks - losing plot as spend all day on this yesterday, but it still wouldn't work!


  • Registered Users Posts: 19 blue412


    No access to the site that I'm working on rather than no GPS.

    I'm using ArcMap - but I don't know what version, I think it's pretty recent. I'll read that stuff now.

    But let's pretend that I did have a GPS. How would I enter those points if I have them manually. I can see a few points that I should be accurate on my paper map to which I should be accurate within 5 meters if I can enter the co-ordinates. Even if it's not that accurate, I don't mind - I'd just prefer to know how to do it!

    I with a scanned copy of the paper map and getting the picture overlaid on it - it kinda worked, but the site boundary layer which is a seperate layer won't overlay onto them - in fact it's like about a tenth the size it should be!

    Thanks


  • Advertisement
  • Registered Users Posts: 6,182 ✭✭✭Tiriel


    oh ok - so you don't have any background mapping that is correctly rectified with coordinates?

    You need to use the paper map - take coordinates x,y in six digits for each point that you can see in both the map and the image.

    As I said - I've only done this in ERDAS - but I think ArcMap does it in a similar way.
    I think what you need to do is to georeference using polynomial transformation, using the map coordinates from your paper map as control points. Example 1 on pg. 5 of this tutorial should help you get started on this.
    http://www.who.int/health_mapping/resources/GIS_tutorial_geometric_correction.pdf

    You need to be as accurate as you can with your coordinates on the map and matching them to your image.

    The Help section for ArcMap might help - not sure if you've read it.

    Hope this helps!


  • Registered Users Posts: 19 blue412


    Yeah - I've no co-ordinates anywhere!

    Even that first stuff geo-referencing tutorial of the map is helping. I'll try read those too.

    Thanks a million


  • Registered Users Posts: 19 blue412


    Hi cork girl - Well no luck - I've just succeeded in turning the scanned map sideways and losing my seperate layers, as well as my mind.

    Basically I've three images, but no coordinate system.

    1.A scanned map.
    2.The second is a high resolution picture of a site.
    3.The third is a low resolution picture of the same site with boundaries marked.
    I want to overlay all three then make the boundary into a polygon so I can calculate area of that.

    The way I'm trying to do this is as follows:

    1. give the scanned map co-ordinates. When I tried to do this it just 90 clockwise. I think if I could do this and rectify with co-ordinates everything would work.

    2. Then georeference the aerial pictures to the scanned map. At the moment I can geo reference one picture to another, and either picture to the map for overlaying, but I can't get all three to overlay!

    Am I doing something wrong, or is it extremely difficult to give a picture co-ordinates?

    What I've used is road junctions on this website http://www.gridreference.ie/ and aligned them with road junctions on my scanned map.

    If you've any more advice please let me know!

    Thanks

    Anyway


  • Closed Accounts Posts: 85 ✭✭YoureATowel


    blue412 wrote: »
    Am I doing something wrong, or is it extremely difficult to give a picture co-ordinates?

    Your first task should be to align your raster map to a relevant coordinate system. Through this process, known as georeferencing, a spatial reference is applied to your raster and you can then accurately measure dimensions. To do this successfully you will need to know the coordinate values of points on the map.

    To define these coordinate values you might use land survey/GPS techniques, you might be able to measure from a grid superimposed on your raster or, as you are doing, measure the values from another map. I will use the third method, but I will use the OSI Mapviewer.


    In this hypothetical situation I have a map and an aerial image, neither of which are georeferenced.


    1) Open ArcMap and add your raster map. As it has yet to be georeferenced an Unknown Spatial Reference message will appear. Click OK to ignore the warning.


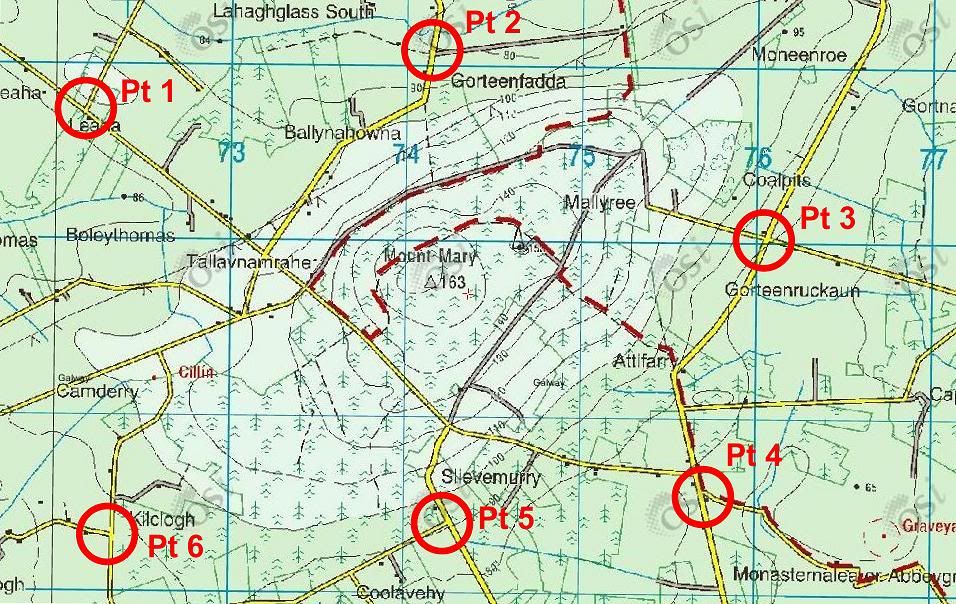
    2) The next step is to identify a number of evenly distributed locations to act as control points.
    Mountain_CPs_Out.jpg

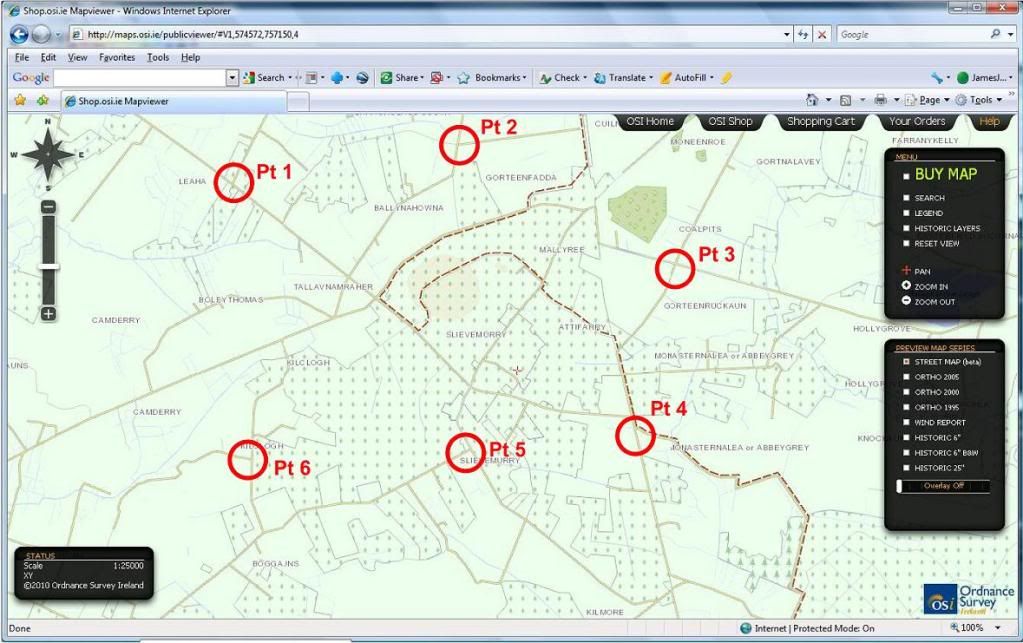
    Next, using Mapviewer, I located each of these control points.
    Mapviewer_CPs_Out.jpg

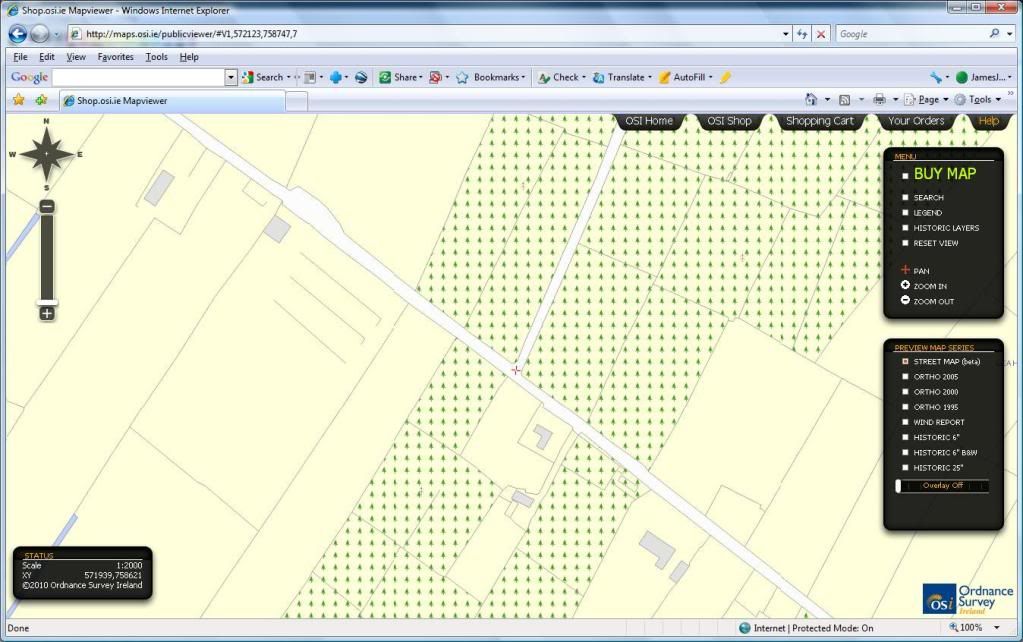
    Taking each point in turn I zoomed in and recorded their Irish Transverse Mercator XY coordinates. Here I have zoomed in to Pt 1, the cursor is placed at the road intersection and the coordinates can be read off the panel at the bottom left hand corner.
    Point1.jpg


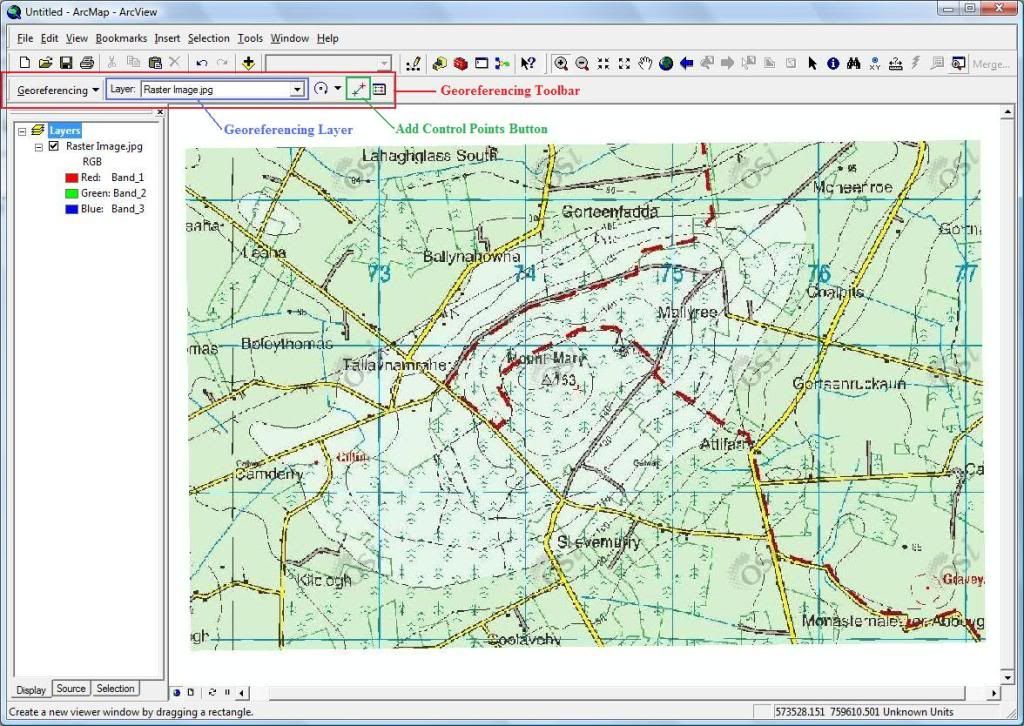
    3) Add the Georeferencing toolbar and ensure that Layer is set to the name of the raster map to be rectified.


    4) Select the Add Control Points button and carefully click once on Point 1 on your map. Now right click and select Input X and Y from the context menu.

    The Enter Coordinates dialog will open and allow you to manually enter the relevant coordinates you recorded earlier. Repeat this for all control points.
    ArcMap4.jpg


    Note that after you click OK, the map orientation, size etc may change dramatically. When this happens right click on the relevant layer in the TOC and select Zoom To Layer. With all 6 sets of coordinates recorded I can now carry out the georeferencing.


    5) Once you have manually entered all control points go to Georeferencing-Update Georeferencing on the toolbar. This will carry out temporary georeferencing within the ArcMap project only.

    To create a permanently georeferenced raster map select Rectify instead. Select a location and format for your output raster and also select Nearest Neighbour for Resample Type.


    6) If a permanent copy is created, navigate to its location in ArcCatalog, right click on it and select Properties. For Spatial Reference select Edit. The spatial reference Dialog opens. Click on the Select button and choose Projected Coordinate Systems-National Grids-IRENET95 Irish Tranverse Mercator.prj


    The raster map is now correctly registered to the Irish Tranverse Mercator coordinate system. (Note that you have been WGS84 decimal degree latitude and longitude not the ITM XY values I used here). The next step is to georeference the aerial image.


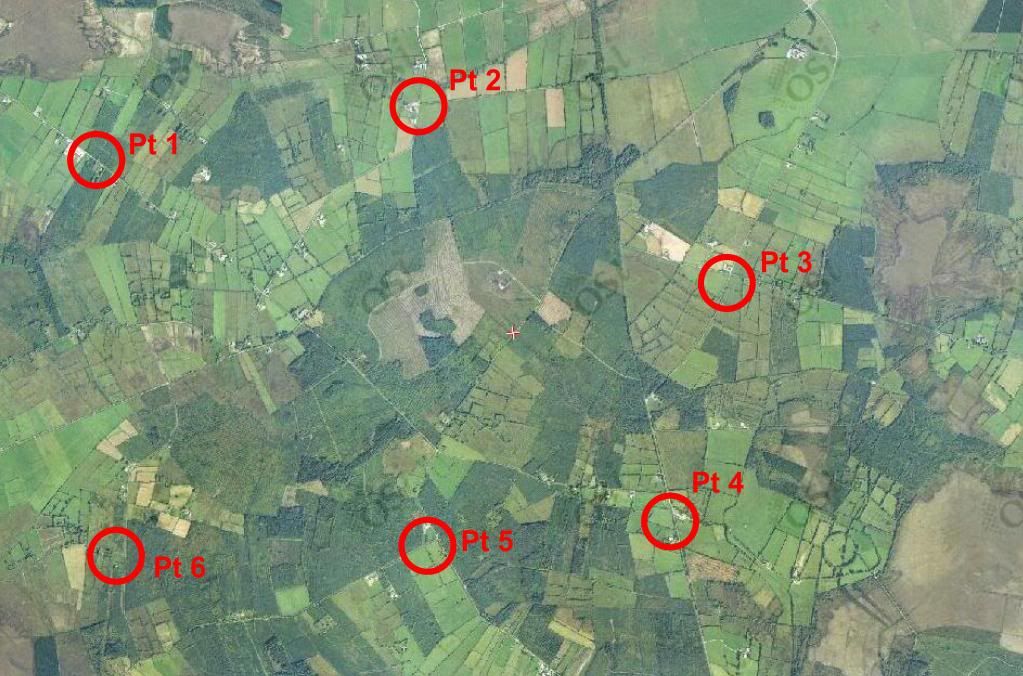
    1) First review the image and identify the locations of the control points.
    Ortho_CPs_Out.jpg


    2) Start a new map and add the recently georeferenced raster map. Next add the aerial image, dismissing the Unknown Spatial Reference warning.


    3) On the Georeferencing Toolbar set Layer to the aerial image. Now select Georeferencing-Fit To Display. This fits the aerial image, which has yet to be georeferenced, to overlap with the registered raster map.


    4) Now you want to link the location of the control points on the unregistered aerial image to their correct locations on the registered raster map.

    Turn on the aerial image and turn off the map. Select the Add Control Point button. On the aerial image select the location of the first control point.

    Now turn off the aerial image, turn on the raster map. Select the corresponding point on the raster. now the two points are linked.

    Repeat this step for all points. If you make a mistake use the View Link Table to delete that point.


    5) When all points have been completed use Georeferencing-Update Geometry. Again, to create a permanent copy use Georeferencing-Rectify. If a permanent copy is created, navigate to its location in ArcCatalog, right click on it and select Properties. For Spatial Reference select Edit. The spatial reference Dialog opens. Click on the Select button and choose Projected Coordinate Systems-National Grids-IRENET95 Irish Tranverse Mercator.prj


  • Registered Users Posts: 19 blue412


    That's fantastic YAT and Cork girl!

    Nearly there I think. Still not lining up perfectly, but it's so much better than it was!

    thank you so very much!:):):):):):):D


  • Advertisement
  • Closed Accounts Posts: 85 ✭✭YoureATowel


    blue412 wrote: »
    That's fantastic YAT and Cork girl!

    Nearly there I think. Still not lining up perfectly, but it's so much better than it was!

    thank you so very much!:):):):):):):D

    blue412,

    If you're using an actual scanned aerial photograph then don't expect it to line up perfectly with a georeferenced raster map. Such an aerial photograph is not an orthophotograph, ie you can't accurately measure dimensions from it. Orthophotography has been corrected for camera tilt and radial displacement.

    What I would recommend is that you first georeference your raster map using control points as outlined above. It will then have a permanent spatial reference.

    Next carry out temporary localised georeferencing on the scanned aerial image to digitise features from it. For example, say you first want to digitise features at the centre of the image, so link the aerial image to the map using points at the centre of the photograph. Next, to digitise a feature at the top left hand corner of the photograph, discard the previous temporary georeferencing and carry out the procedure again using points in the locality you want to digitise.

    Using a scanned aerial photograph is far from ideal but modifying the procedure in this way will help improve accuracy.


  • Registered Users Posts: 3,803 ✭✭✭El Siglo


    YoureATowel = GIS GOD!

    Man, you're an absolute legend. Without you and Cork_girl I'd hate to think what might happen. I definitely wouldn't have gotten my maps done for my MSc thesis that's for sure!:D


  • Registered Users Posts: 158 ✭✭Opelfruit


    Map2.jpg

    Hi guys, can anyone tell me how to do something like this? I have the raster maps but dont really know where to start in trying to make it a 3D maps. Its no big deal as i just want it to see how its done as it looks cool and maybe print it and hang it on a wall at home.:D


  • Registered Users Posts: 6,182 ✭✭✭Tiriel


    You need a "z" field with data on contours/heights for your map - if you have this information it is possible using ArcScene or other software to create a 3D visualisation of your OSmap.. or a digital terrain model. What kind of base map are you working with?


  • Registered Users Posts: 158 ✭✭Opelfruit


    Cork_girl wrote: »
    You need a "z" field with data on contours/heights for your map - if you have this information it is possible using ArcScene or other software to create a 3D visualisation of your OSmap.. or a digital terrain model. What kind of base map are you working with?

    Hi, thanks for the reply. I have the Ordinance Survey Discovery mapping which has contours if that helps. I dont have ArcScene though but I think I would be able to get access to it easy enough. I have Mapinfo GIS installed on my computer here. Im a novice but Im going to be using it quite a bit soon. As I said this is just for fun and games really, not important.


  • Closed Accounts Posts: 85 ✭✭YoureATowel


    Opelfruit wrote: »
    Hi, thanks for the reply. I have the Ordinance Survey Discovery mapping which has contours if that helps. I dont have ArcScene though but I think I would be able to get access to it easy enough. I have Mapinfo GIS installed on my computer here. Im a novice but Im going to be using it quite a bit soon. As I said this is just for fun and games really, not important.

    Opelfruit,

    If you want to carry out this procedure using MapInfo then you will need the Vertical Mapper add-on. This extension to the core MapInfo functionality allows you to analyse and visualise geo-spatial data in the third dimension. If installed then Vertical Mapper will exist as an option on the Main Menu.

    However, it appears that the only elevation data that you currently have exists on 1:50000 raster mapping. If this is the case then you're going to have to digitise these contours before you get to a more interesting stage of the process.


  • Closed Accounts Posts: 1 abratton01


    Hi,

    I am currently trying to determine if certain slope failures tend to cluster in areas with particular slope characteristics i.e. slope angle. I have a range of georeferenced slope failures (point data) and a reclassified slope map (converted to polygon). Is there a tool in ArcMap 10.0 that will allow me to statistically show if certain types of failures tend to occur on certain slope angles.


  • Closed Accounts Posts: 5 r_mac


    Hi,

    I have gotten my hands on a spreadsheet full of location data which I would like to overlay onto an online map. I have been told that the data I have is ITM data which will need to be converted to WGS84 and thus to GPX. OSI have an online converter for such things ( http://www.osi.ie/en/alist/batch-conversion.aspx ) but it's not particularly helpful. Firstly, it requires that the file be no larger than 8kbs (my file is 56kb) and secondly, even after I have broken the file into smaller chunks, it returns a spreadsheet without any new values. Here is a sample of what I put in and what I got out:

    Input: "1",684634,672753

    Output: "1",684634,672753,0,0,0,0,0,0,0

    The first field in inverted commas is an id field, represented as a string so as not to mess with the converter.

    What I think the problem might be, is that I haven't supplied any orthometric data. As they say on the OSI page:

    For all other co-ordinates, each line must have station name, followed by the easting, northing and orthometric height.

    However, the spreadsheet I have didn't come with any orthometric height - is there any way around this?

    Any help or advice would be much appreciated.


  • Closed Accounts Posts: 85 ✭✭YoureATowel


    r_mac wrote: »
    Hi,

    I have gotten my hands on a spreadsheet full of location data which I would like to overlay onto an online map. I have been told that the data I have is ITM data which will need to be converted to WGS84 and thus to GPX. OSI have an online converter for such things ( http://www.osi.ie/en/alist/batch-conversion.aspx ) but it's not particularly helpful. Firstly, it requires that the file be no larger than 8kbs (my file is 56kb) and secondly, even after I have broken the file into smaller chunks, it returns a spreadsheet without any new values. Here is a sample of what I put in and what I got out:

    Input: "1",684634,672753

    Output: "1",684634,672753,0,0,0,0,0,0,0

    The first field in inverted commas is an id field, represented as a string so as not to mess with the converter.

    What I think the problem might be, is that I haven't supplied any orthometric data. As they say on the OSI page:

    For all other co-ordinates, each line must have station name, followed by the easting, northing and orthometric height.

    However, the spreadsheet I have didn't come with any orthometric height - is there any way around this?

    Any help or advice would be much appreciated.


    In this case you can ignore the height data altogether. The orthometric height, H, is only used as a conversion parameter in the formula for height. Therefore, the value of H will have no effect on the Latitude and Longitude values returned.

    For example, the same X and Y coordinates, along with any value for H, will always return the same Latitude and Longitude values. However, as the value of the input orthometric height varies so will the output ellipsoid height, h.

    Input:
    1,684634,672753,0

    Output:
    1,684634,672753,0,52,47,56.86,-6,44,41.823,55.77544

    Where:

    1 = Point name
    684634 = Input ITM Easting value
    672753 = Input ITM Northing value
    0 = Input Orthometric Height dummy value

    52 = Output WGS84 Degrees Latitude
    47 = Output WGS84 Minutes Latitude
    56.86 = Output WGS84 Seconds Latitude

    -6 = Output WGS84 Degrees Longitude
    44 = Output WGS84 Minutes Longitude
    41.823 = Output WGS84 Seconds Longitude

    55.77544= Output Ellipsoid Height. IGNORE this value.


  • Registered Users Posts: 610 ✭✭✭muckish


    How many records in your spreadsheet?


  • Advertisement
  • Closed Accounts Posts: 5 r_mac


    ok thanks, so you're saying I should just fill the height column with a dummy value and then ignore this value in the output? that's easy enough.

    there are 2846 records in the spreadsheet.


  • Closed Accounts Posts: 5 r_mac


    ok, so I get the data back in the degrees, minutes, seconds format, but how do I convert that to a decimal format? is there any batch methods to do it?


  • Closed Accounts Posts: 85 ✭✭YoureATowel


    r_mac wrote: »
    ok, so I get the data back in the degrees, minutes, seconds format, but how do I convert that to a decimal format? is there any batch methods to do it?

    The processed data is output in csv format. Open this file in Excel. It's a trivial task in Excel to combine the Degree, Minute and Second elements and convert to decimal format.


    For example, providing you known your way around Excel, you would calculate the decimal degrees latitude thus:

    Degrees Latitude + Minutes Latitude/60 + Seconds Latitude/3600


    With regards to the decimal degrees longitude be careful. These are west of the central meridian and therefore are negative values. The transformation output has the Degrees Longitude as negative values, while the Minutes Longitude and Seconds Longitude are positive. Your formula in this case should therefore look something like this:

    Degrees Longitude - (Minutes Longitude/60 + Seconds Longitude/3600)


  • Closed Accounts Posts: 5 r_mac


    Ok, that worked perfectly, thanks!


  • Registered Users Posts: 6,212 ✭✭✭Rowley Birkin QC


    I was skiing last week and used the My Tracks application on my phone to record some of the runs. I'm a bit out of practice with Arc at the moment so using this to get back into using the programme.

    The programme can export the data in the following formats:
    • Google Fusion Table
    • GPX
    • KML
    • CSV
    • TCX

    These tables contain the following data:
    • Time
    • Lat, long
    • Altitude
    • Bearing
    • Speed in Km/h

    Managed to open the CSV file for one of them in Arc and it opened as a series of dots mapping out the run. Opened the KML in Google Earth and it appeared as a line. I've like to be able to open the runs in ArcMAP as a set of continuous lines, maybe with speed and elevation data represented by colour ramps?

    Just wondering if anyone has any ideas for interesting things they can do with the data? It's just something to keep me associated with GIS while jobseeking!

    I've attached the data from some of the runs if anyone wants to have a look.


  • Registered Users Posts: 610 ✭✭✭muckish


    Might have a look at it tomorrow with FME. See what it can come up with in terms of translating data into different formats


  • Closed Accounts Posts: 85 ✭✭YoureATowel


    I was skiing last week and used the My Tracks application on my phone to record some of the runs. I'm a bit out of practice with Arc at the moment so using this to get back into using the programme.

    The programme can export the data in the following formats:
    • Google Fusion Table
    • GPX
    • KML
    • CSV
    • TCX

    These tables contain the following data:
    • Time
    • Lat, long
    • Altitude
    • Bearing
    • Speed in Km/h

    Managed to open the CSV file for one of them in Arc and it opened as a series of dots mapping out the run. Opened the KML in Google Earth and it appeared as a line. I've like to be able to open the runs in ArcMAP as a set of continuous lines, maybe with speed and elevation data represented by colour ramps?

    Just wondering if anyone has any ideas for interesting things they can do with the data? It's just something to keep me associated with GIS while jobseeking!

    I've attached the data from some of the runs if anyone wants to have a look.

    If you have the Data Interoperability extension then you can add the kml and gpx vector linework data directly to ArcMap.

    Not a hell of a lot you can do with just a series of GPS points, besides experimenting with Tracking Analyst. For example, below is a speeded up animation of one of your skiing runs, symbolised by height.

    Animation.gif


  • Registered Users Posts: 6,212 ✭✭✭Rowley Birkin QC


    Cool, thanks Youreatowel.

    If it's not too much bother, this really is just an excuse to use Arc again, could you post how you did that?

    Also, I do have the Data Interoperability extension available to me.


  • Closed Accounts Posts: 85 ✭✭YoureATowel


    Cool, thanks Youreatowel.

    If it's not too much bother, this really is just an excuse to use Arc again, could you post how you did that?

    Also, I do have the Data Interoperability extension available to me.

    FME is a set of tools that allows for the transformation of spatial data between different formats. For example, you can translate data from ESRI native formats to MapInfo, GE Smallworld or AutoCAD formats.

    The Data Interoperability extension includes a subset of these tools and vastly increases the file types that can be read by ArcGIS. With the extension turned on you can now interact with and process your GPX and KML files.


    Tracking Analyst, on the other hand, allows you to analyse temporal data. This allows you create real time 3D animations of your recorded spatial data.

    1. Add the Long Run.csv file to ArcMap.

    2. Right click on the file name in the Table of Contents. Select Data - Export, save the file as LongRun.dbf and add the new file to ArcMap.

    3. Open the table and select Options - Add Field. Add new fields of type double called Latitude, Longitude and Altitude. Also add a field of type text called TimeStamp.

    4. Add the Editor Toolbar. Select Editor - Start Editing and delete the first record in the table. This is an invalid record that was imported from the original csv file.

    5. Now right click on the field heading for Latitude in the table. Select Field Calculator. The calculation rewuired is Latitude = [LAT]. Repeat this for the Longitude and Altitude fields. These fields now contain numeric values while the originals contained text values.

    6. The calculation for TimeStamp is more involved. As before right click on the field name, however change the Type radio button to String. The calculation in this caseshould be TimeStamp = Left([TIME],10) & " " & Mid([TIME],12,8). This will parse out valid ArcGIS time values for each record.

    7. Now select Editor - Save Edits and subsequently Stop Editing.

    8. Now right click again on LongRun.dbf on the TOC. Select Display XY Data. FOr X Field select Longitude, for Y Field select Latitude. For Coordinate System navigate to Geographic Coordinate Systems - World - WGS 1984.prj

    9. Right click on the newly added Events in the TOC. Select Data - Export Data and save the file as TheLongSkiRun.shp. At this stage your original csv text file has been converted to a workable shapefile.

    10. Now turn on the Tracking Analyst extension and click on the Add Temporal Data button.

    11. For 1 choose A feature class or shapefile containing temporal data.
    For 2 select TheLongSkiRun.shp
    For 3 choose TimeStamp
    Click on Next.

    12. For the date format select dd/MM/yy. For time seperators select HH:mm:ss

    13. To Symbolise the newly added temporal points by Altitude go to the Symbology tab in the Layer Properties. For Draw As select Quantities - Graduated colors. For Fields - Value select Altitude. For Classification use Equal Interval with say 10, 15 or 20 classes. Choose a suitable Color Ramp, if you right click of the Color Ramp and deselect Graphic View you can select a Color Ramp by name. Choose Distance.

    14. Now select the Playback Manager button and the Playback Manager opens. If you press play you can see your ski run in real time. Set the Options - Set the playback rate to 10 Seconds Per Second to increase the speed.

    15. Finally select Tracking Analyst - Animation Tool to export your animation as an avi file. I used GIMP to convert the avi to a gif.


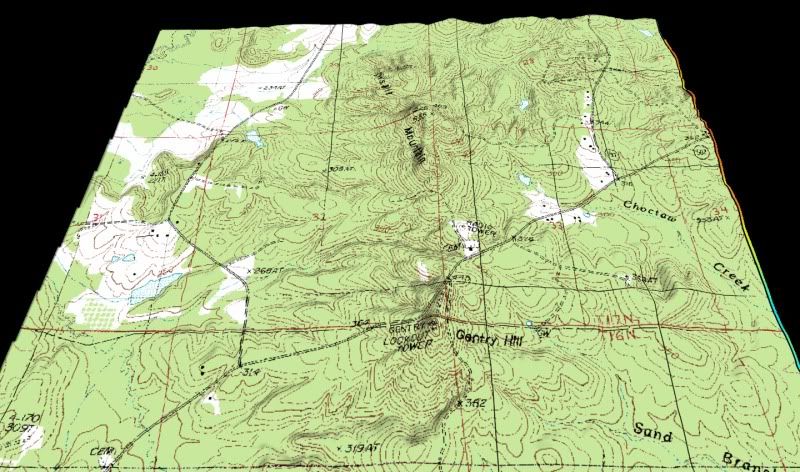
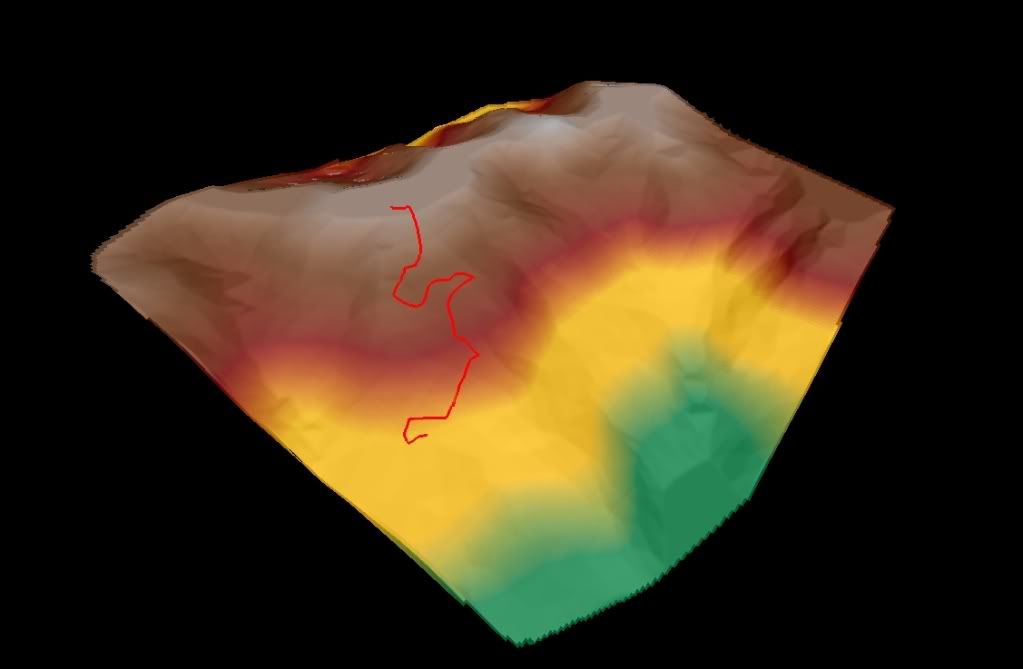
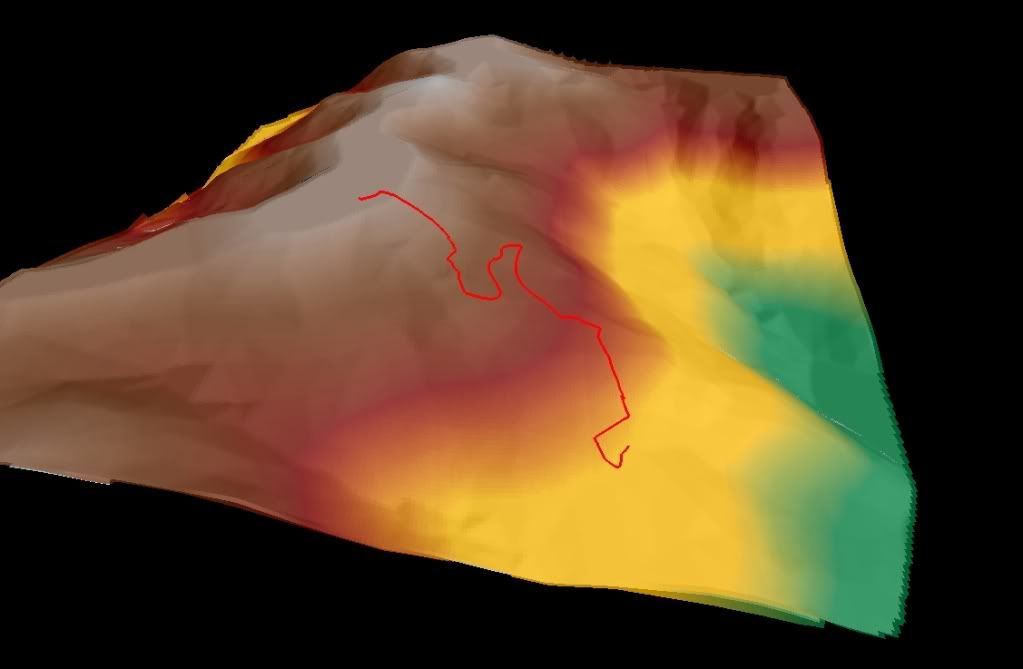
    If your interested I was able to generate a fairly crude 3D model of the same ski run.

    Ski_1.jpg

    Ski_5.jpg


  • Advertisement
  • Closed Accounts Posts: 85 ✭✭YoureATowel


    abratton01 wrote: »
    Hi,

    I am currently trying to determine if certain slope failures tend to cluster in areas with particular slope characteristics i.e. slope angle. I have a range of georeferenced slope failures (point data) and a reclassified slope map (converted to polygon). Is there a tool in ArcMap 10.0 that will allow me to statistically show if certain types of failures tend to occur on certain slope angles.

    I don't know about ArcGIS 10 but in version 9.* the Spatial Statistics Tools are what you're looking for.


Advertisement