Advertisement
If you have a new account but are having problems posting or verifying your account, please email us on [email protected] for help. Thanks :)
Hello all! Please ensure that you are posting a new thread or question in the appropriate forum. The Feedback forum is overwhelmed with questions that are having to be moved elsewhere. If you need help to verify your account contact [email protected]

GIS Help Clinic

1235710

Comments

  • Closed Accounts Posts: 91 ✭✭Tom Fiat


    thats a good suggestion - thanks.


  • Closed Accounts Posts: 74 ✭✭lil*lady


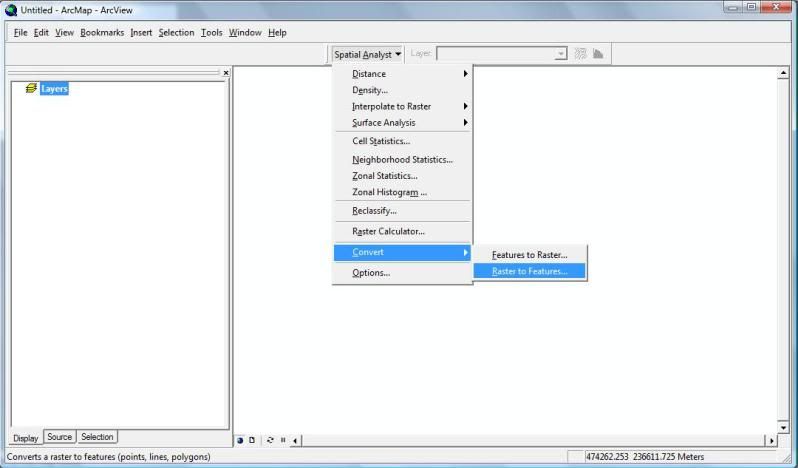
    Are you talking about spot heights, the traditional way to show heights of mountain tops on maps? If so use Spatial Analyst - Convert - Raster To Feature to create a regular grid of points containing the height attribute of each cell in the surface. Note that the grid interval will be the same as the Cell Size. Select out the points you want and you have your spot heights.

    Hi there, I've tried this but I can't seem to get it to work :/ I've no convert tool in spatial analyst, and in 3d analyst there's nothing similar, is there any other way?

    Also I'm having a mare of a time with creating my own symbology, I want to create a line that shows that there's a break in slope (see attached PDF) and I want to have a special line to show this. I'm doing it manually at the moment, but I was also wondering would there be any way of Arc doing this itself, basically, if a slope goes \___/ I want to be able to put a line in where the asteriks are in the following e.g. \*__*/ (does that make any sense?) Hopefully the PDF will help.

    Any help on just finding the spot heights though would be appreciated if you don't get the last part.

    Thanks again.


  • Registered Users Posts: 1,922 ✭✭✭WesternZulu


    Any help would be appreciated.

    I am using the electoral boundary cso data http://beyond2020.cso.ie/censusasp/saps/boundaries/ED%20Disclaimer1.htm

    I have downloaded arcgis explorer but cannot open any of the shapefiles, it either comes up as "unknown coordinates" or "invalid file" when i try and add them from the add content option.

    I have never used any GIS programme before and this is wrecking my head that i cannot even view the files never mind get anything else done with them.

    Is this a common problem or am i not doing something obvious :confused::confused:


  • Closed Accounts Posts: 85 ✭✭YoureATowel


    lil*lady wrote: »
    Hi there, I've tried this but I can't seem to get it to work :/ I've no convert tool in spatial analyst, and in 3d analyst there's nothing similar

    Are you sure that you don't have this option? Look under the Spatial Analyst Toolbar, not in ArcToolbox.

    SA.jpg


    lil*lady wrote:
    Also I'm having a mare of a time with creating my own symbology, I want to create a line that shows that there's a break in slope (see attached PDF) and I want to have a special line to show this.

    Go to Tools - Styles - Style Manager and expand ESRI.style, double click on Line Symbols. Next, right click on say the "Arterial Street" symbol and select copy. Now right click on white space beside the existing symbol name and select paste.

    A copy of Arterial Streets is pasted to the bottom of the line symbols list. Scroll down until you find it, click on the name and change it to say "SlopeBreak". Now double click on it, the Symbol Property Editor opens.

    So far, the symbology of "Slope Break" consists of just a basic solid line which is selected by default in the Layers panel. It is of type "Cartographic Line Symbol" and it has a width of 0.8 points. Change the width to 1 point.

    Next, in the Layers panel at the bottom left corner, click on the + button, a new layer is added to the symbol. It is coincident with the previous layer. Change the type of this new layer to "Marker Line Symbol". Now select the Marker Line tab and click on the Symbol button.

    Scroll down the list of symbols and select Diamond 1, also change its size to say 10 and click OK.

    Next select the Template tab. Change Interval to 3 and click OK. Click Close on the Style Manager dialog.

    You now have the new symbol created and it can be applied to linework in the normal way.


  • Closed Accounts Posts: 85 ✭✭YoureATowel


    Any help would be appreciated.

    I am using the electoral boundary cso data http://beyond2020.cso.ie/censusasp/saps/boundaries/ED%20Disclaimer1.htm

    I have downloaded arcgis explorer but cannot open any of the shapefiles, it either comes up as "unknown coordinates" or "invalid file" when i try and add them from the add content option.

    I have never used any GIS programme before and this is wrecking my head that i cannot even view the files never mind get anything else done with them.

    Is this a common problem or am i not doing something obvious :confused::confused:


    You need all three components of this shapefile to be present in a single folder for it to be valid and readable. The shp component contains the geometry of the file, ie the lines, points or whatever. The dbf stores the attribute information of features in the shp. The shx is an index, which aids in the speed with which the file can be used. Make sure all three components are together before you try to use it.

    If that is not the problem then it may be because the file doesn't have a prj component. This tells the software what map projection the data is in.

    I have created a prj file for this shapefile, you can download it here. Place it in the same folder as the other three components and try to add the data again.


  • Advertisement
  • Closed Accounts Posts: 74 ✭✭lil*lady


    Thanks YAT.

    I got cracking on the symbology and it's working perfectly, thank you, thank you, thank you, thank you.

    However I've just looked into the Spatial Analyst, (you're right I was looking in the wrong place) and I've a problem. When I was trying to get it to convert the raster to points it wouldn't let me, as you can see in the pdf it's not in bold... any ideas if I need to switch anything on or...?

    Thanks again.


  • Registered Users Posts: 1,922 ✭✭✭WesternZulu


    You need all three components of this shapefile to be present in a single folder for it to be valid and readable. The shp component contains the geometry of the file, ie the lines, points or whatever. The dbf stores the attribute information of features in the shp. The shx is an index, which aids in the speed with which the file can be used. Make sure all three components are together before you try to use it.

    If that is not the problem then it may be because the file doesn't have a prj component. This tells the software what map projection the data is in.

    I have created a prj file for this shapefile, you can download it here. Place it in the same folder as the other three components and try to add the data again.

    Thanks for that. Appreciate it!

    I think that my netbook is unable to run arcgis explorer properly so that could be a reason too.

    Have installed it and reinstalled it but the same problem of the not being ble to see any map in the screen happens.

    All i can see it whatever window is opened behind arcgis explorer where the map should appear.
    I'm getting a headache trying to sort this out :eek:
    Not the easiest programme in the world to work


  • Closed Accounts Posts: 85 ✭✭YoureATowel


    lil*lady wrote: »
    Thanks YAT.

    I'm going to get cracking on the symbology now however I've just looked into the Spatial Analyst, (you're right I was looking in the wrong place) and I've a problem. When I was trying to get it to convert the raster to points it wouldn't let me, as you can see in the pdf it's not in bold... any ideas if I need to switch anything on or...?

    Thanks again.


    You haven't got the Spatial Analyst extension turned on.


  • Closed Accounts Posts: 85 ✭✭YoureATowel


    Thanks for that. Appreciate it!

    I think that my netbook is unable to run arcgis explorer properly so that could be a reason too.

    Have installed it and reinstalled it but the same problem of the not being ble to see any map in the screen happens.

    All i can see it whatever window is opened behind arcgis explorer where the map should appear.
    I'm getting a headache trying to sort this out :eek:
    Not the easiest programme in the world to work


    What OS are you using? To run properly ArcGIS Explorer needs Service Pack 2 for Windows XP or Service Pack 1 or 2 for Vista.


  • Closed Accounts Posts: 74 ✭✭lil*lady


    Bingo, got it, thank you, feel quite silly now.

    Another silly question would be, what would I put in though to get the heights? Sorry this must be like pulling teeth, but the slope file is a "floating point raster" and it won't allow me to get data from that. Thanks again.


  • Advertisement
  • Closed Accounts Posts: 85 ✭✭YoureATowel


    lil*lady wrote: »
    Bingo, got it, thank you, feel quite silly now.

    Another silly question would be, what would I put in though to get the heights? Sorry this must be like pulling teeth, but the slope file is a "floating point raster" and it won't allow me to get data from that. Thanks again.

    The slope file doesn't contain the necessary height information in any case. Remember that the values associated with each pixel will be slope, not height. Use the surface from which the slope file was derived, this contains the necessary height information.


  • Closed Accounts Posts: 74 ✭✭lil*lady


    Thanks, the only thing is that when I'm trying to create a new feature it says that it exceeds the 2gb limit and won't let me get any further, is there any way around this?


  • Closed Accounts Posts: 85 ✭✭YoureATowel


    lil*lady wrote: »
    Thanks, the only thing is that when I'm trying to create a new feature it says that it exceeds the 2gb limit and won't let me get any further, is there any way around this?

    You have two options.

    The first involves reducing the raster layer resolution. Right click on the elevation surface layer name in the TOC. Select Data-Export Data, the Export Raster Data dialog will open. For Cell Size (cx, cy) input a suitably larger value.

    For example, if the original values were 10, 10, this means that each pixel covers 10 square meters on the ground. As you increase the Cell Size note that the Uncompressed Size property underneath will decrease. This is the size of the output file. You can continue to incrementally increase the Cell Size until an acceptable file size is reached. Set the Name, Location and Format options and then Save.

    Alternatively, if you want to maintain the original resolution as the grid interval in your output features you could split the original raster into smaller components. First zoom over the top left quadrant of the raster. Right click on the elevation surface layer name in the TOC. Select Data-Export Data, the Export Raster Data dialog will open. Under Extent select Data Frame (Current). Set the Name, Location and Format options and then Save. Repeat for the remaining quadrants. Using this method you will end up with four rasters but each will be 1/4 the file size of the original.

    In both cases note the Format option. If you are working with GRID files make sure you set this option to GRID.


  • Registered Users Posts: 6,212 ✭✭✭Rowley Birkin QC


    Any ideas how to do that with an MrSid image Youreatowel?

    I tried the procedure you outlined above, it worked but the output file is blank despite the fact it is 500MB + in size. The original MrSID image it was cropped from is over 4GB.


  • Closed Accounts Posts: 74 ✭✭lil*lady


    YoureATowel firstly thank you for all your help so far, I wouldn't be as far along as I am if it wasn't for your help. And I'm hoping you'll help with this one other thing. It's still the elevation problem.

    The original file that I've gotten my slope etc from is an image file. I figured out that the pixel value is the elevation, by clicking the information button randomly on the image actually. I can't get it to open in any way that'd be like an attribute table for me to just click and join it. I've tried to change the image to a raster to get it to the raster - > features part that you suggested before but it won't work. I've also tried to classify it, but that won't work. And I looked at getting the height data from the contours but it stops at 460m and I know for a fact that the highest peak is 466m, but I can't get Arc to tell me that won't tell that.

    Is there anyway that I could get a table of the pixel values (there's no attribute table, classifying unique values in the symbology doesn't seem to work) and convert them to elevation?


  • Closed Accounts Posts: 85 ✭✭YoureATowel


    lil*lady wrote: »
    YoureATowel firstly thank you for all your help so far, I wouldn't be as far along as I am if it wasn't for your help. And I'm hoping you'll help with this one other thing. It's still the elevation problem.

    The original file that I've gotten my slope etc from is an image file. I figured out that the pixel value is the elevation, by clicking the information button randomly on the image actually. I can't get it to open in any way that'd be like an attribute table for me to just click and join it. I've tried to change the image to a raster to get it to the raster - > features part that you suggested before but it won't work. I've also tried to classify it, but that won't work. And I looked at getting the height data from the contours but it stops at 460m and I know for a fact that the highest peak is 466m, but I can't get Arc to tell me that won't tell that.

    Is there anyway that I could get a table of the pixel values (there's no attribute table, classifying unique values in the symbology doesn't seem to work) and convert them to elevation?


    Are you sure that the pixel value being returned is actually elevation. It seems to me that you are mistaking a derived file, slope for example, as an elevation surface. Use your contours to check.

    In any case you should have absolutely no problems converting the raster to point features if that surface has already been used to interpolate contours. It's actually even a far simpler procedure.


  • Closed Accounts Posts: 85 ✭✭YoureATowel


    Any ideas how to do that with an MrSid image Youreatowel?

    I tried the procedure you outlined above, it worked but the output file is blank despite the fact it is 500MB + in size. The original MrSID image it was cropped from is over 4GB.

    If you did it as outlined then you should not have run into any problems. When you selected Data Frame (Current) were you sure that the ArcMap data frame did indeed contain imagery?

    What output format did you use? If it was .img then any space in the data frame not filled by your original image will be given all 0 RGB values, ie black. If no imagery exists in the data frame then you will just get a blank .img file.


  • Closed Accounts Posts: 74 ✭✭lil*lady


    Are you sure that the pixel value being returned is actually elevation. It seems to me that you are mistaking a derived file, slope for example, as an elevation surface. Use your contours to check.

    In any case you should have absolutely no problems converting the raster to point features if that surface has already been used to interpolate contours. It's actually even a far simpler procedure.

    Hi YourATowel, I'm fairly sure it's the elevation, the data corresponds to previously known data and the contours. I've put a link to my original data, it's a lidar image of what I've been working off and what everything's based off, if you have time if you could have a look I'd really appreciate it, if you don't that's perfectly fine. I still can't convert it to point features, I'm still having the same problems and I can't get curvature to work either, I can get a curvature output but then there are classification problems, it freezes if I try and do it through symbology or reclassify :/

    Thanks again for all your help.

    http://rapidshare.com/files/417383889/Clare_Island.zip


  • Closed Accounts Posts: 85 ✭✭YoureATowel


    lil*lady wrote: »
    Hi YourATowel, I'm fairly sure it's the elevation, the data corresponds to previously known data and the contours. I've put a link to my original data, it's a lidar image of what I've been working off and what everything's based off, if you have time if you could have a look I'd really appreciate it, if you don't that's perfectly fine. I still can't convert it to point features, I'm still having the same problems and I can't get curvature to work either, I can get a curvature output but then there are classification problems, it freezes if I try and do it through symbology or reclassify :/

    Thanks again for all your help.

    http://rapidshare.com/files/417383889/Clare_Island.zip

    OK, the problem is that the raster dataset is of a 32 bit floating point pixel type. Such raster types don't support raster attribute tables in ArcGIS, as a result many processing tasks are not possible. The solution is to then convert it to a usable format, ie a raster with a single integer band.

    1. Open ArcCatalog and navigate to the folder containing the raster in question.
    2. Right click on it, select Export - Raster To Different Format. The Copy Raster dialog will open.
    3. Give the output a distinct name.
    4. Most importantly, under Pixel Type (optional), select either 16_Bit_Signed or 16_Bit_Unsigned. Either option is suitable in this instance.
    5. Click OK.

    The output cell values will be rounded to the nearest whole number, 99.44 becomes 99 while 99.55 becomes 100.

    At this point it would be wise to reduce the raster layer resolution before continuing to create the regular grid of points. Using this reduced resolution raster for your other tasks will not only help with processing time but will also ensure that the application doesn't freeze.


  • Closed Accounts Posts: 74 ✭✭lil*lady


    Thanks YoureATowel, got it working now. Really happy, thank you.

    I've just one final question. I've made a curvature raster as well, the only thing I can't figure out is how do I classify it so that I know what is convex and concave etc? I just need to know up to what value is convex, what's flat, what's concave.

    The range in values is from -855.644 to 1546.25 for the curvature profile and -2830 to 1640 for the curvature.

    Thanks once again.


  • Advertisement
  • Closed Accounts Posts: 85 ✭✭YoureATowel


    lil*lady wrote: »
    Thanks YoureATowel, got it working now. Really happy, thank you.

    I've just one final question. I've made a curvature raster as well, the only thing I can't figure out is how do I classify it so that I know what is convex and concave etc? I just need to know up to what value is convex, what's flat, what's concave.

    The range in values is from -855.644 to 1546.25 for the curvature profile and -2830 to 1640 for the curvature.

    Thanks once again.

    For the curvature, positive values indicate that the surface is convex, negative values indicate that that cell is concave and 0 means that it is flat.

    For the profile curvature the opposite is true. Positive = concave, negative = convex.

    However, the range of values you provided indicate that there are anomalous values at the extremities of the range.


  • Closed Accounts Posts: 74 ✭✭lil*lady


    Ok, thank you, that makes sense.
    Is there a transformation I could do to remove the anomalies?


  • Registered Users Posts: 6,212 ✭✭✭Rowley Birkin QC


    Anyone know where a rail map of the country could be downloaded? It's too late to try and get in touch with Irish Rail this evening but will try in the morning if no-one has a suitable map.

    Cheers.


  • Closed Accounts Posts: 85 ✭✭YoureATowel


    lil*lady wrote: »
    Ok, thank you, that makes sense.
    Is there a transformation I could do to remove the anomalies?

    If you generate a hillshade of the original 0.5m raster you provided you will notice a strange phenomena. A series of intersecting lines that form a hatch pattern on the hillshade raster. These "lines", are artifacts of the original data processing that created the original surface. Unfortunately this design also shows up in the Curvature and can lead to some terrible results.

    To get around this I would use the ArcToolbox-Data Management Tools-Raster-Raster Processing-Resample to resample the raster to a 2.5m cell size using the Cubic resampling technique. A hillshade derived from this new surface will be devoid of these artifacts. Likewise a Curvature generated will also have much improved results.

    If you use the process I outlined to create a 16-Bit integer copy of the new 2.5m Curvature you can inspect all the Curvature values, although they will now be integer values. You will notice that the vast majority of values are centered about 0, within a range of -10 to 10. This is desirable.


  • Closed Accounts Posts: 74 ✭✭lil*lady


    Thanks YoureATowel, you've been an immense help. I'll play around with it a bit and hopefully it'll work out.


  • Registered Users Posts: 6,212 ✭✭✭Rowley Birkin QC


    Bit of a weird problem. I'm working on a map in the data view but when I go to layout view nothing shows up, just a blank screen, no layouts, no legends.

    I've tried:
    • Switching draft mode on and off
    • Creating a new data frame and copying the data into it,
    • Changing the page setup.

    Nothing is working. I realise I can start again but just wondering if there is any fix for this if I run into it again.

    EDIT: In case it happens anyone else, I right clicked in the middle of the the blank layout and clicked "Zoom Whole Page". Still don't know what caused it but that fixed it.


  • Closed Accounts Posts: 74 ✭✭lil*lady


    I have one final final question if you can answer YoureATowel or anyone else I'd really appreciate it, in the home stretch now.

    I'm submitting my map shortly, however I tested out the map on a different computer today and I realised that all the symbology isn't set up with it, which is fairly important.

    As I've created my own symbology and certain polygons have very specific colours, I was wondering how do I create a style file or something establishes what the symbology is when it is opened on another computer?

    Edit: I think I have it, created a new folder in the style manager section and just copied everything to there, won't be at another computer until Thursday so I won't be able to tell if it's working til then. Last thing is, in the style manager, can I assign a particular field in the attribute table to the symbol, currently it's coming up as default..or is it just a case that when you go into arcgis with the map my prof is going to have to click-symbology-and then choose the symbology...? Really hope that's not the case...would love if there was someway I could just program it now


  • Closed Accounts Posts: 74 ✭✭lil*lady


    Also, I've an issue with a symbol that keeps resizing itself and I don't want it to, and ideas on how to keep it a certain size? (see PDF)
    Thank you!


  • Closed Accounts Posts: 85 ✭✭YoureATowel


    lil*lady wrote: »
    I have one final final question if you can answer YoureATowel or anyone else I'd really appreciate it, in the home stretch now.

    I'm submitting my map shortly, however I tested out the map on a different computer today and I realised that all the symbology isn't set up with it, which is fairly important.

    As I've created my own symbology and certain polygons have very specific colours, I was wondering how do I create a style file or something establishes what the symbology is when it is opened on another computer?

    Edit: I think I have it, created a new folder in the style manager section and just copied everything to there, won't be at another computer until Thursday so I won't be able to tell if it's working til then. Last thing is, in the style manager, can I assign a particular field in the attribute table to the symbol, currently it's coming up as default..or is it just a case that when you go into arcgis with the map my prof is going to have to click-symbology-and then choose the symbology...? Really hope that's not the case...would love if there was someway I could just program it now

    Not entirely sure what you're saying here. When you save a mxd file all the styles are saved within it. If you then open that mxd file on another computer ArcMap will add the layers and restyle them as specified by you at the time the project was saved. Only in certain situations should there be problems, like if you used a bmp for a point style, the path of that bmp must be available to the computer opening the mxd.

    Would it not be best to just output a pdf of your finished map?

    lil*lady wrote: »
    Also, I've an issue with a symbol that keeps resizing itself and I don't want it to, and ideas on how to keep it a certain size? (see PDF)
    Thank you!

    In this situation you have to set a Reference Scale for your data frame.

    Go to View-Data Frame Properties and select a suitable reference scale for your map.

    Next, right click on the layer in question in the TOC, select Properties and then the Display tab. For your purposes, ensure that the Scale symbols when a reference scale is set is unselected.

    Now, if you zoom in and out, the symbols will remain the same size as they are at the selected Reference Scale.


  • Advertisement
  • Closed Accounts Posts: 74 ✭✭lil*lady


    Thanks YoureATowel, very helpful.


Advertisement