Advertisement
If you have a new account but are having problems posting or verifying your account, please email us on hello@boards.ie for help. Thanks :)
Hello all! Please ensure that you are posting a new thread or question in the appropriate forum. The Feedback forum is overwhelmed with questions that are having to be moved elsewhere. If you need help to verify your account contact hello@boards.ie
Help Keep Boards Alive. Support us by going ad free today. See here: https://subscriptions.boards.ie/

Daily pv production

1216217218219220222»

Comments

  • Registered Users, Registered Users 2 Posts: 2,707 ✭✭✭ECO_Mental


    I had forgotten about May 23… as the rest of 23 was a disaster…I always look fondly back at '22 we had a number of good weeks from March on that year and on a whole that was my best year so far.

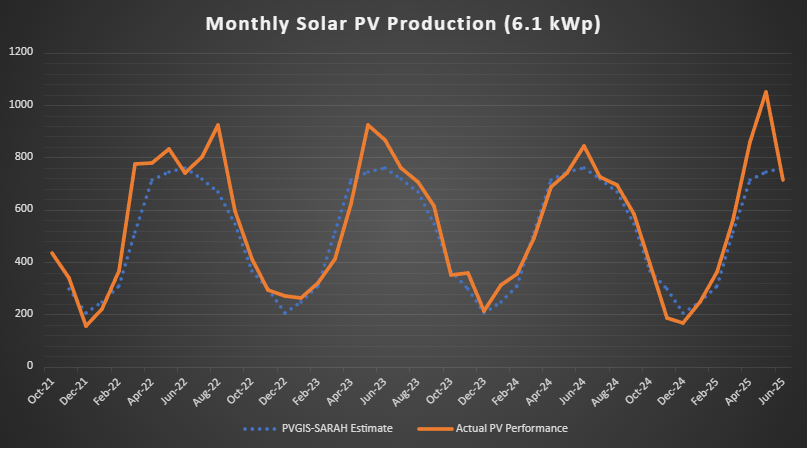
    Yeah this month will be a record breaker and if it holds out I will break the 1 MWh (6.1 kWp).. Lets not forget also August '22 which is been my best month ever at 924 kWh May '23 was only 923 kWh…😎

    image.png

    6.1kWp south facing, South of Cork City


  • Registered Users, Registered Users 2 Posts: 811 ✭✭✭JohnySwan


    Ah perfection 👌

    1000016647.jpg


  • Registered Users, Registered Users 2 Posts: 3,149 ✭✭✭pureza


    96.4kwh produced in Arklow today,the highest so far,will it break the 100 before the month is out? We are at 1502kwh already for the month so far,surpassing my wildest expectations

    26 south facing ground mounted 575 watt panels


  • Registered Users, Registered Users 2 Posts: 1,346 ✭✭✭Busman Paddy Lasty


    20.9 kWh today. Last few days…

    20.8 / 20.8 / 20.1 / 21.0 / 20.9 kWh.

    Over 300 kWh for the month from a 3.1 kWp system.


  • Moderators, Home & Garden Moderators Posts: 7,073 Mod ✭✭✭✭graememk


    You might break it, if you get a perfect day mid June

    If day light is 30 mins longer that usually shows up as longer peak power, as it starts sooner and finishes later


  • Advertisement
  • Registered Users, Registered Users 2 Posts: 811 ✭✭✭JohnySwan


    Finished the day on 71 kwh. Exported 60. 10.75 kwp SE


  • Registered Users, Registered Users 2 Posts: 811 ✭✭✭JohnySwan


    Nice, just broke 70 again, what a month.

    Screenshot (1).png


  • Registered Users, Registered Users 2 Posts: 1,346 ✭✭✭Busman Paddy Lasty


    21.1 kWh best day of the year so far.


  • Registered Users, Registered Users 2 Posts: 3,149 ✭✭✭pureza


    just surpassed 2 megawatt hours production for May with 7 days to go

    23x575w panels south


  • Registered Users, Registered Users 2 Posts: 151 ✭✭terrarev


    As a contrast to all the record production recently, yesterday it rained all day here my south facing 10.1kw system produced 16.75kw.

    There were a couple of sub 15kw days as well last week in the dark rainy weather.


  • Advertisement
  • Registered Users, Registered Users 2 Posts: 2,752 ✭✭✭oleras


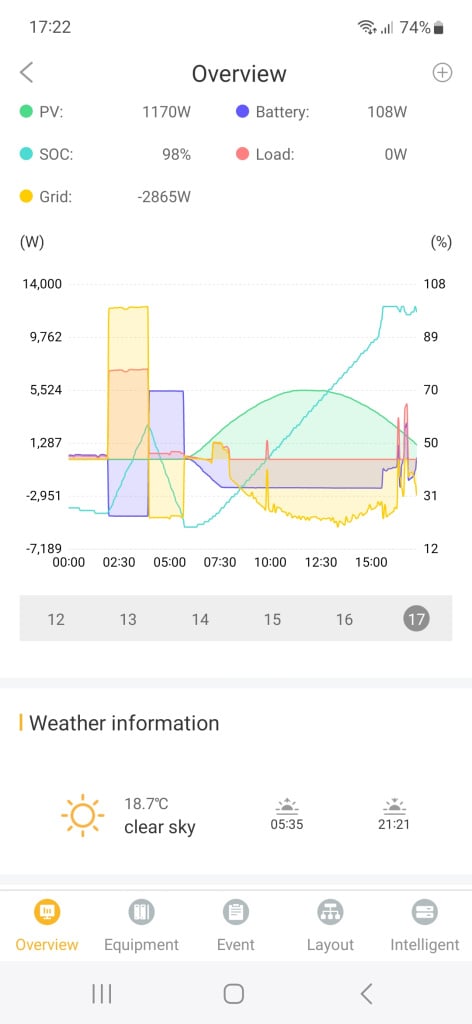
    Got my system installed Tuesday, yesterday was its first full run at it.

    12E, 8W and 4S

    Very happy lad !

    Screenshot_20250528-215820.png


  • Registered Users, Registered Users 2 Posts: 3,716 ✭✭✭John.G


    Posting this here because there is a wealth of information/knowledge.

    A few facts/observations first, I have a modest self installed flat(2) plate solar thermal array, and take the daily Roches Point irradiation numbers for the past 14 years, the yearly/period numbers change very little from year to year, for example, periods 1/1 to 17/7 for years 2022,2023,2024,2025, are 665,643,663,703 kWh/m2. I also notice, see "10 Panel Solar PV" below, that the panel efficiency appears to change very little between low and high solar Irradiation, the (10 Panel) attachment shows a 2.6kWp system with a area of 16.4m2, the modelled yearly output is 2.454 Kwh which equates to a efficiency of, 2.454/16.4, 14.96%, all the monthly efficiencies are pretty close to this, does this sound plausible? my solar thermal efficiencies certainly vary quite significantly, from say 10% to 28%.

    The real reason I'm posting here is that a neighbour is thinking of installing a 4.0kWp system and possibly a 6.0kWp one if his south facing roof can accomodate it. His yearly demand is ~ 3500kwh, 9.6kWh/day, he has a 9kW electric shower only used for 15 minutes/day, plus, electric cooking, electric kettle and the usual other low power users. The spreadsheet is just my estimation of the output.

    Would someone venture their openion(s) based on the above, as to what the ratio of self usage might be, based on a 4.0kWp system and the 6.0kWp system, Thanks, John.


  • Registered Users, Registered Users 2 Posts: 2,694 ✭✭✭bullit_dodger


    I see what your doing there, it's sort of clever, but I'm not sure it'll work doing what your doing as the efficiencies between solar thermal and solar pv are not the same. Solar thermal is about 2x as efficient in capturing the raw energy coming from the sun and converting it into usable energy than PV. So your sort of comparing apples and oranges a little.

    I think the "best" way in having a look at PV estimations has always been PVGIS.

    JRC Photovoltaic Geographical Information System (PVGIS) - European Commission

    1. Hit your location on the map you want to model and then
    2. Supply the orientation, size, slope and away you go.

    It's not perfect, but from my own experiences in South Dublin City it gives me within 10%. (usually under forecasting my production - i.e. I generate more than it thinks I'd get)

    So pumping in 6kwp of panels in south cork (facing due south), you get….

    image.png

    I wouldn't get too hung up on "self-use", he'll get paid for whatever surplus he has. More surplus = faster pay back timeline for the installation.

    Aside: in 99% of cases, if you can afford it…..always (always) go for the bigger system, it makes more financial sense in the long run.


  • Registered Users, Registered Users 2 Posts: 3,716 ✭✭✭John.G


    I'll have a look at that later,

    My simple spreadsheet seems to give more or less the same outputs. I have also included rough estimate of savings based on both 4M & 6M arrays.

    Have edited the spreadsheet, again.

    Post edited by John.G on


  • Registered Users, Registered Users 2 Posts: 2,694 ✭✭✭bullit_dodger


    I see where your going with the efficiency factors etc, but it's actually far more complicated than whats needed here. The following depends a little on the tariffs your on, but it's "ball park" really as tariffs will change of course over time. But you'll find that this works well.

    From PVGIS you can see that a 6.0kwp system above in Cork (facing due south) should generate in around 5850 kwhr. Let's say you export -all- of that at a FIT rate of €0.20/kwhr. (I'm using Energia's rate of €0.20) That gives you €1170 in savings for the year.

    Of course, you won't be exporting everything as you'll be using some/all of that solar electricity instead of your "day rate" (assuming €0.30) here. So your "lower bound" is €1170 in savings and then if you uses ALL of that electricity at day rate your "upper bound" is 5585 x €0.30 = €1755.

    Since you mentioned that his usage is about 3500/year, you can ballpark a saving of roughly half way in between. So you'll be looking at €1500/year in savings.

    Note: As mentioned the above depends a little on tariffs, but so does every model.


  • Registered Users, Registered Users 2 Posts: 3,716 ✭✭✭John.G


    PVGIS shows a Cork Irradiation number of 1199kWh/m2, much higher than my daily accumulated figure of 1036kWh/m2 I have never remotely seen numbers like this in the past 14 years, for example, 2022 was 1054kwh/m2, 2023 was 1062kWh/m2 & 2024 (the number I used) was 1036kWh/m2. Based on that then my PV generation should be ~ 6*1.036, 6.22mWh to give a PV output of 5.03mWh at a factor of 80.9%, I think 0.8 is a generally used factor?), The PVGIS's figure of 1199kWh/m2 (and a PV output of 5.85mWh) gives PV generation of 6*1.199, 7.194kWh/m2 and a factor of 5.85/7.194, 0.814. Do the Cork south facing panels reflect this high output?

    image.png


Advertisement