Advertisement
If you have a new account but are having problems posting or verifying your account, please email us on [email protected] for help. Thanks :)
Hello all! Please ensure that you are posting a new thread or question in the appropriate forum. The Feedback forum is overwhelmed with questions that are having to be moved elsewhere. If you need help to verify your account contact [email protected]

GIS Help Clinic

1457910

Comments

  • Registered Users Posts: 6,212 ✭✭✭Rowley Birkin QC


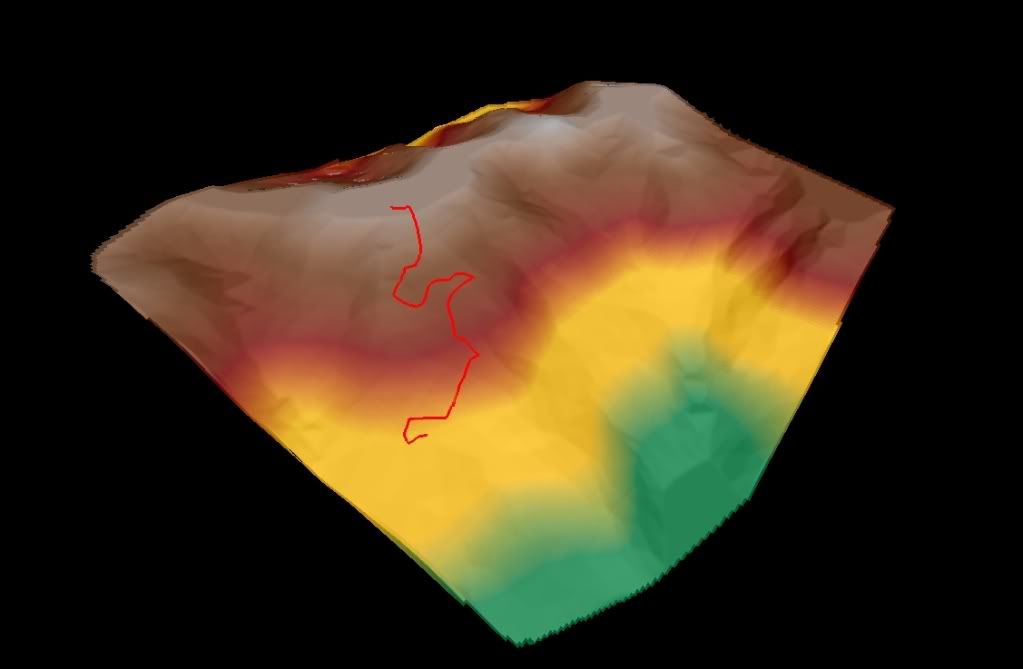
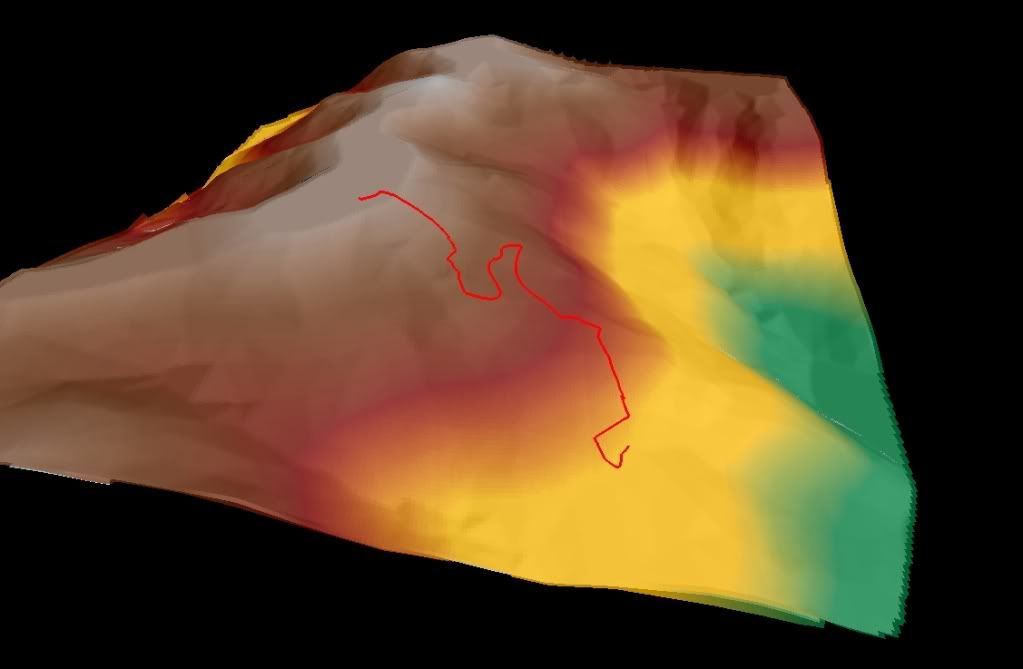
    If your interested I was able to generate a fairly crude 3D model of the same ski run.

    Wow, thanks a million for that.

    I'll try to replicate that when I get a chance, maybe tomorrow evening, and get back to you.

    Thanks again.


  • Registered Users Posts: 4 spline


    I don't know about ArcGIS 10 but in version 9.* the Spatial Statistics Tools are what you're looking for.

    You might like to look at http://www.colorado.edu/research/cires/banff/pubpapers/110/ where logistic regression was used to model some determinants of landslide occurence. Gorsevski et al used a randomly chosen set of hillsides without landslides as a control set. If I remember correctly, the paper was published in Transactions in GIS in 2006.

    Logistic regression has yet to appear in ArcGIS, but is available in R. If you have some evidence that the relationship between occurence probability and slope is not spatially stationary (for example west facing slopes might be more prone), then you might try geographically weighted logistic regression: you can fit these using the R 'spgwr' package.


  • Registered Users Posts: 487 ✭✭DBCyc


    Hi folks,

    I am looking for Irish GIS datasets such as bus stops, railway stations, schools, hospitals etc. Is this information freely available from government depts etc.?


  • Registered Users Posts: 160 ✭✭NotCarrotRidge


    DBCyc wrote: »
    Hi folks,

    I am looking for Irish GIS datasets such as bus stops, railway stations, schools, hospitals etc. Is this information freely available from government depts etc.?

    bits and pieces. Contact the OSI as your first port of call, but don't expect them to be either helpful or free.


  • Registered Users Posts: 487 ✭✭DBCyc


    bits and pieces. Contact the OSI as your first port of call, but don't expect them to be either helpful or free.

    Cheers, yeah I have been on to the OSI and they were helpful enough but far from free which is the problem :)


  • Advertisement
  • Registered Users Posts: 6,182 ✭✭✭Tiriel


    bits and pieces. Contact the OSI as your first port of call, but don't expect them to be either helpful or free.

    I was on a similar quest not so long ago and found the OSI very helpful, fair enough they have to charge but the people I was dealing with were great.

    The lack of information available is something that hinders a lot of research and GIS work in this country.


  • Registered Users Posts: 11,730 ✭✭✭✭expectationlost


  • Closed Accounts Posts: 289 ✭✭feicim


    DBCyc wrote: »
    Hi folks,

    I am looking for Irish GIS datasets such as bus stops, railway stations, schools, hospitals etc. Is this information freely available from government depts etc.?

    you can make them up yourself quite easily using the free tool in google maps for making your own maps (all you need is a gmail account). you can convert polygons and points from googlemaps into kml format which can then be converted into a shapefile. the coordinate system will be WGS84.


  • Registered Users Posts: 487 ✭✭DBCyc


    feicim wrote: »
    you can make them up yourself quite easily using the free tool in google maps for making your own maps (all you need is a gmail account). you can convert polygons and points from googlemaps into kml format which can then be converted into a shapefile. the coordinate system will be WGS84.

    Thanks - I've had a quick look but cant find this tool. Would you have a link by any chance?


  • Registered Users Posts: 225 ✭✭ManAboutCouch


    Some, if not all of the data you're looking for might be available from OpenStreetMap.

    You can highlight particular types of POIs on http://www.openstreetbrowser.org/

    If you want to get your hands on the raw data you can download it from http://download.geofabrik.de/osm/europe/ or http://downloads.cloudmade.com/

    The data may be incomplete, but what is there is usually very accurate. If you have any questions about OSM just let me know.


  • Advertisement
  • Registered Users Posts: 6,212 ✭✭✭Rowley Birkin QC


    Hi, I've been given a set of coordinates that have a notation "Int. F.T." with them. Unfortunately I can't get in touch with the person that supplied them to me.

    Does "Int. FT." ring any bells with anyone?

    Thanks in advance.


  • Closed Accounts Posts: 85 ✭✭YoureATowel


    Hi, I've been given a set of coordinates that have a notation "Int. F.T." with them. Unfortunately I can't get in touch with the person that supplied them to me.

    Does "Int. FT." ring any bells with anyone?

    Thanks in advance.
    International Foot

    All it means is that your coordinates are in feet.


  • Registered Users Posts: 158 ✭✭Opelfruit


    Opelfruit wrote: »
    Hi, thanks for the reply. I have the Ordinance Survey Discovery mapping which has contours if that helps. I dont have ArcScene though but I think I would be able to get access to it easy enough. I have Mapinfo GIS installed on my computer here. Im a novice but Im going to be using it quite a bit soon. As I said this is just for fun and games really, not important.

    If your interested I was able to generate a fairly crude 3D model of the same ski run.

    Ski_1.jpg

    Ski_5.jpg

    Hi, thats the type of model I'd like to do up in Mapinfo as I have the vertical mapper extension. How on earth did did you do it with just those points?:confused:


  • Closed Accounts Posts: 85 ✭✭YoureATowel


    Opelfruit wrote: »
    Hi, thats the type of model I'd like to do up in Mapinfo as I have the vertical mapper extension. How on earth did did you do it with just those points?:confused:
    I didn't use the ski run points to generate the 3D visualisation. I was able to source topographic mapping of the area, digitise the contours and produce it from that.

    I'm using MapInfo 8.5 and Vertical Mapper3.1, so apologies if your using a more up-to-date version.

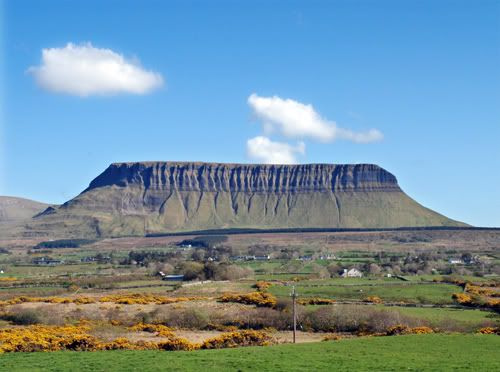
    In this example I'm going to create a 3D visualation of Ben Bulben in Co Sligo.

    Mountain.jpg

    Assuming that you have access to appropriate mapping your first task is to digitise the contours.


    Digitising

    1) In MapInfo add your map to your workspace.

    2) Go to File-New Table. The New Table dialog appears. Select the Add to Current Mapper option only and then click on Create. The New Table Structure dialog opens. Click on Add Field. For Name input Elevation, for Type select Float. Next click on Projection. For Category select Irish Coordinate Systems, for Category Members choose Irish Transverse Mercator Grid and click OK. On the New Table Structure dialog click on Create. Call the new file Contours.TAB and select Save.

    3) Your Map Window will now contain both your base mapping and the as yet empty Contours TAB file. Right click on the map window and select Layer Control. On the Layer Control dialog ensure that Countours is editable and click on OK. You are now ready to start digitising.

    4) On the Drawing toolbar pick Polyline. On your map follow each contour line inputting a vertex at each change of direction. If a contour is closed then before inputting your final point press S on your keyboard. This toggles the Snap function on and off. Turn it on to close to contour.

    5) When an individual contour is complete use the Select tool on the Main Toolbar to select it, then go to Window-New Map Window, with Selection highlighted click on OK. A Browser is open showing the Elevation field of the newly added contour. Manually input the height value of the contour here and then close the browser.

    6) Continue this process until the entire region is digitised making sure that the correct elevation values are always input.

    Here you can see the area I have digitised with Ben Bulben at the centre.
    Image1.jpg


    Create Point Data

    1) Stage 2 of the process requires the linear contours to be translated into point features.

    2) Go to Vertical Mapper-Create Grid-Poly To Point, the relevant dialog opens.

    3) Under Select Table choose Contours. Under Extract from select Polylines.

    4) Next for Distance between points select the Use nodes only radio button. This means that each point you inputted as part of the digitising process will now be used to create a spot height containing the associated height value.

    5) Give the new TAB file a relevant name, Contours_ptp.TAB for example, and click on OK

    6) A map window opens containing the new point data. Right click inside this window, select View Entire Layer, select All Layers and OK.

    Image2.jpg


    Create Grid

    1) Go to Vertical Mapper-Create Grid-Interpolation. For Interpolation Method select Triangulation with smoothing and click on Next.

    2) For Select table to grid choose Contours_ptp (this is the table containing the point data). For Select Column choose Elevation (this is the column containing the manually inputted height values). Under Unit Type pick Meters. When ready click on Next.

    3) In the resulting dialogs accept the default values calculated by Vertical Mapper. Input an acceptable name for the grid, in this case I'm calling it BenBulbenGrid.TAB.

    4) The resulting grid is opened in a new Map Window with a default colour scheme.

    Image3.jpg


    Create 3D View

    1) On the Vertical Mapper Toolbar click on the Show/Hide Grid Manager button. The Grid Manager will open showing whatever grids are available in the workspace.

    2) The first task is to change the color scheme into something related to elevation. Select the Colour tool in the Grid Manager. The Grid Colour Tool dialog opens. Load a more appropriate Colour Profile or manually edit it. I'm going to use a color scheme that transitions from dark green to dark brown dependant on elevation, as is customary. Also turn on Relief Shading. When ready select OK.

    3) Your map is updated to reflect the new colour profile and also shows relief shading.

    Image4.jpg


    4) In my example you can now clearly see Ben Bulben. In my 3D View I want to view Ben Bulben from the north west. To do this I need to record the coordinates of a viewing from and viewing to positions.

    3) In the bottom left of the MapInfo application window ensure that the Status Bar is showing Cursor Location. Now as you move the cursor around a Map Window the coordinate location will be updated.

    4) I'm choosing a point at the north west of my map as the Looking From location and a point on Ben Bulben itself as the Looking To location.

    Image5.jpg


    5) Now on the Grid Manager select 3D View-Run 3d Viewer. The Scene Properties dialog opens. This has three tabs, Viewing, Surface and lighting and Loaded Grids.

    6) On the Viewing tab select From and To as the Viewing Mode. Input the XY coordinates recorded earlier. Now switch the Viewing Mode to To Your Location and set the viewing Angle of Inclination to 45 degrees.

    7) On the Surface and Lighting tab you can set values for Lighting etc which can help to improve the aesthetic quality of the scene.

    8) On the LoadedGrid tab turn off the Show Base option. Increase the Exaggeration of Z Values to 2. Finally, slightly increase the XY Min Clipping values and slightly decrease the XY Max Clipping values. This will help eliminate any frayed edges of the scene.

    9) Now click on OK, a Grid View window opens containing the scene. To save a copy on the image go to File-Export to bmp & tab

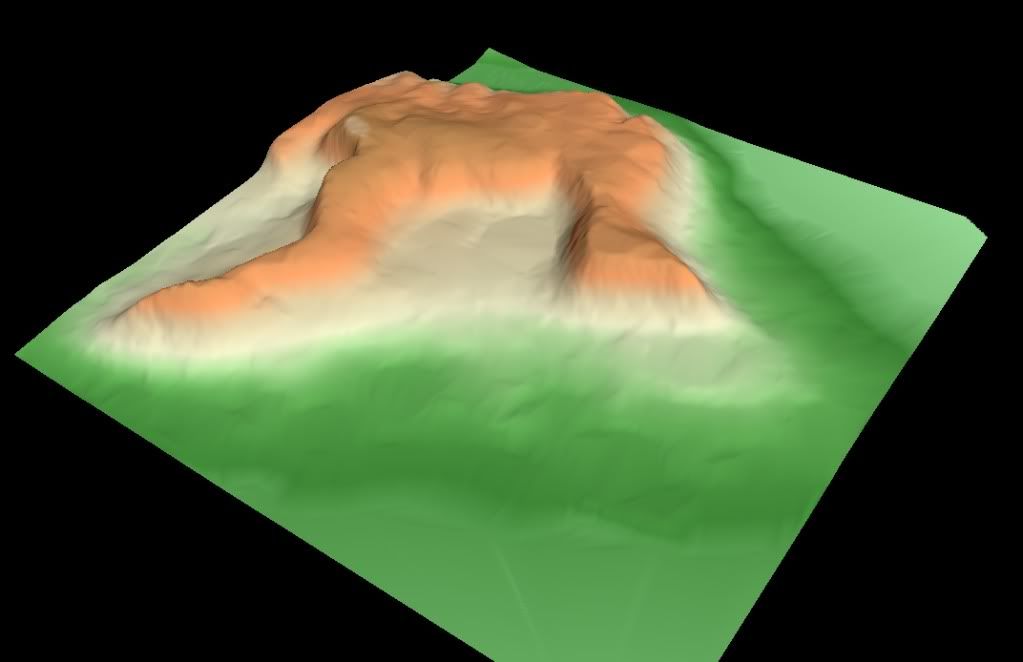
    Here you can see my final output scene of Ben Bulben.

    OutputBenBulben.jpg


  • Registered Users Posts: 158 ✭✭Opelfruit


    Cool! Tried some of this yesterday. If I digitize part of a contour and later digitize another part, how do I join them up later? Using the "S" key just starts a new line from the end of an old line.


  • Registered Users Posts: 610 ✭✭✭muckish


    Opelfruit wrote: »
    Cool! Tried some of this yesterday. If I digitize part of a contour and later digitize another part, how do I join them up later? Using the "S" key just starts a new line from the end of an old line.

    Just select both lines and goto Objects> combine. Just make sure you don't sum the value of the contours. Make sure the value option reflects the value of the contour.


  • Registered Users Posts: 610 ✭✭✭muckish


    Digitising

    5) When an individual contour is complete use the Select tool on the Main Toolbar to select it, then go to Window-New Map Window, with Selection highlighted click on OK. A Browser is open showing the Elevation field of the newly added contour. Manually input the height value of the contour here and then close the browser.

    On this point rather than opening a browser window all the time I would use the info tool window and input the value there. So long as you don't close it down, every time you digitise a new feature the info tool box will reflect the change and be ready for new attribute data.


  • Registered Users Posts: 6,212 ✭✭✭Rowley Birkin QC


    Hi all, does anyone have a link to an up to date shape file with each country boundary as a separate polygon? Ideally one that matches the attached country list.

    I'm looking around myself but if anyone can point me in a particular direction that would be great.

    Thanks in advance.

    This is the best one I've found so far in case anyone else is looking: http://geocommons.com/overlays/5603


  • Closed Accounts Posts: 85 ✭✭YoureATowel


    Hi all, does anyone have a link to an up to date shape file with each country boundary as a separate polygon? Ideally one that matches the attached country list.

    I'm looking around myself but if anyone can point me in a particular direction that would be great.

    Thanks in advance.

    This is the best one I've found so far in case anyone else is looking: http://geocommons.com/overlays/5603
    Try this. Click on the Free Download button. The shapefile is translated from MapInfo sample data.


  • Registered Users Posts: 6 mango13


    hey guys! stunning post :O !!! i m personally stuck on the phase of i importing corine colours into the attribute table of the relevant polygons.. i ve already joined the polygons with the colour settings which are stored in a different column (RGB format, say: 255-255-000), based on code 00 and things seem that they are ok by now. The problem is i cant automatically assign colours to the same land type codes.. Instead I have to pick them manually from properties, and then typing the rgb code to find the proper colour.. Is there any way to make it work? YoureAtowel, you had some instructions, but still i cant understand whats going wrong.. thanx for the input..:)


  • Advertisement
  • Closed Accounts Posts: 85 ✭✭YoureATowel


    mango13 wrote: »
    hey guys! stunning post :O !!! i m personally stuck on the phase of i importing corine colours into the attribute table of the relevant polygons.. i ve already joined the polygons with the colour settings which are stored in a different column (RGB format, say: 255-255-000), based on code 00 and things seem that they are ok by now. The problem is i cant automatically assign colours to the same land type codes.. Instead I have to pick them manually from properties, and then typing the rgb code to find the proper colour.. Is there any way to make it work? YoureAtowel, you had some instructions, but still i cant understand whats going wrong.. thanx for the input..:)

    Using Tools-Style-Style manager I was able to create the attached .Style file.

    The file contains a series of Fill Symbols based on the RGB colour scheme in the clc_legend file.

    Assuming that you have followed the steps in the previous post you should have joined the attributes, including the RGB field, of the clc_legend file to your feature class. Follow these steps to symbolise the features according to the RGB field.


    1. Download the attached file, RGB.style.

    2. Right click on your feature class in the ArcGIS Table of Contents window. Select Properties and then the Symbology tab.

    3. Under Show select Categories - Match to symbols in a style.

    4. For Value Field select RGB.

    5. For Match to symbols in Style select Browse. Navigate to RGB.style that you downloaded in Step 1 and select Open.

    6. Next click on Add Values. On the Add Values dialog select Complete List. Select all the generated values and press OK.

    7. Back on the Layer Properties dialog select Match Symbols. The relevant symbology in the Style file is now applied to value in the RGB field of each feature.

    8. Click on OK to dismiss the Layer Properties window and to see the updated symbology.


  • Registered Users Posts: 6 mango13


    Thanks for the detailed instructions, mate!Flawless!!It's done!:) Well, what I could not do was to create the style at the Style Manager.. I suppose you did it the good old "batch" way, not adding each colour separately for every code, right? If yes, how did you do it, if I am allowed to ask?:)


  • Closed Accounts Posts: 85 ✭✭YoureATowel


    mango13 wrote: »
    Thanks for the detailed instructions, mate!Flawless!!It's done!:) Well, what I could not do was to create the style at the Style Manager.. I suppose you did it the good old "batch" way, not adding each colour separately for every code, right? If yes, how did you do it, if I am allowed to ask?:)

    The .Style file can be created manually in ArcView or automatically using ArcObjects programming.

    1) To create the file manually, first go to Tools-Styles-Style Manager.

    2) Click on Styles, scroll to the bottom of the list and select Create New. Give the new file a suitable name and press Save. The new Style is added to the Style Manager.

    3) Expand the new Style by clicking on the + button next to its name. Click on the Fill Symbols folder to highlight it. The next step is to add the required fill symbols.

    4) Right click on the empty panel on the right-hand-side of the Style Manager. Select New-Fill Symbol, the Symbol Property Editor Opens. Set Type to Simple Fill Symbol. Next press the Color button and then More Colors. Enter the RGB values from the clc_legend.csv file.

    For example the first entry in the clc_legend.csv file is 230-000-077. In the Color Selector enter 230 for Red, 000 for Green and finally 077 for Blue. Click OK.

    5) Click on the Outline Color button, select No Color. Set Outline Width to 0. Click OK and rename the newly created symbol to 230-000-077.

    6) Repeat steps 4 & 5 for each entry in the clc_legend.csv file.


    The alternative approach is to automatically generate the Styles file using VBA and ArcObjects. The process creates a blank Style file. It then reads each entry in the clc_legend.csv in turn, creates a symbol and symbolises it based on the entry in the RGB field. I used this method to create the file attached above.


  • Registered Users Posts: 6 mango13


    YoureATowel, YourePureGold! Cheers, my friend!!!


  • Registered Users Posts: 487 ✭✭DBCyc


    Alright guys. I have some Mapinfo files that I want to use in ArcGIS 10 (.dat, .id, .map, .tab files). What is the best way to use them in ArcGIS - can you convert to a geodatabase or read them directly? Thanks


  • Closed Accounts Posts: 85 ✭✭YoureATowel


    DBCyc wrote: »
    Alright guys. I have some Mapinfo files that I want to use in ArcGIS 10 (.dat, .id, .map, .tab files). What is the best way to use them in ArcGIS - can you convert to a geodatabase or read them directly? Thanks

    If you have MapInfo then use its Universal Translator to export the files to ESRI shapefile format. This function located under the Tools menu.

    Check out this website for a free trial.


    If you only have access to ArcGIS then check to see if you have its Data Interoperability extension. This is located under Tools-Extensions. Once turned on you can access your Tab files in ArcCatalog as if they are in native ESRI format.

    A free trial is available here.


    A third option is to install FME Desktop.

    A trial version can be downloaded here.


  • Registered Users Posts: 3,803 ✭✭✭El Siglo


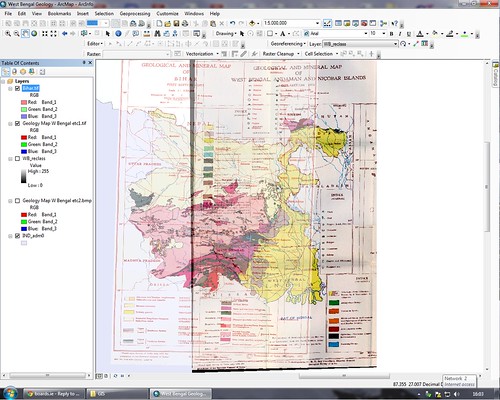
    I have a geological map saved as a tif file format that I want to start digitising using Arc 10. I've been having some trouble with two aspects of this that I was hoping to get some clarification on.

    The map is of a state in India, it has known locations on it that I can match up with XY coordinates and georeference these. However, I'm lost on the right projection. I did have a projection of WGS84 (14N) for India but it didn't work and the map was sideways and the coordinates didn't match correctly. I'm not sure now what coordinate system to use with the tif file and it's not working when I've tried other systems, it doesn't show any coordinates on the bottom of the screen when I move the mouse around. Is there a way of using the right projection and georeferencing the points?

    The second issue is the digitising bit. There's a lot to digitise and I was told that Arc Scan can do some of this work, I've never used it and I've tried to digitise by drawing polygons around the parts I want. However, this is taking far too long and I'm pushed for time, is there anyway that I can "train" the program to digitise parts of the map automatically? Essentially what's the most efficient way that I can digitise the map?

    I'd appreciate any information that anyone could offer! :D


  • Registered Users Posts: 3,803 ✭✭✭El Siglo


    This is about as far as I've gotten.
    6298717433_a4274cb355.jpg

    The two tiffs (one is at 50% transparency) are georeferenced to the base map (purple). The problem now is converting all of these into a polygon shapefile. Apart from drawing the polygons which would take ages given I'm on a slow computer that is prone to crashing, does anyone know of a way that I can make shape files out of these? I've tried reclassifying one of them, I've tried nearly everything and it doesn't seem to work at all. Any suggestions would be most welcome.


  • Registered Users Posts: 610 ✭✭✭muckish


    You need a raster2vector converter. Here's one that has a free trial. I don't know how good it is or what's in the trial version etc but might be worth giving it a go. http://www.cnccontrols.com/raster2vector.asp
    FME might be able to do some raster coercer transformations as well.


  • Advertisement
  • Registered Users Posts: 11,730 ✭✭✭✭expectationlost


    is there batch ITM to utm etc converter out therer this one is unavailable :/http://www.osi.ie/en/alist/co-ordinate-converter-tool.aspx


Advertisement