Advertisement
If you have a new account but are having problems posting or verifying your account, please email us on hello@boards.ie for help. Thanks :)
Hello all! Please ensure that you are posting a new thread or question in the appropriate forum. The Feedback forum is overwhelmed with questions that are having to be moved elsewhere. If you need help to verify your account contact hello@boards.ie

FI CHARTS AUTUMN/WINTER 2014/15 **Mod Note Post #1**

Options
13133353637

Comments

  • Registered Users Posts: 471 ✭✭KingdomRushed


    Nabber wrote: »
    In 2115 people will be still asking is this like 2010

    Models still looking good
    gfs-0-186.png?6?6

    Yeah but the northerly is trending toward ever quicker collapse from the west on GFS the last 2-3 runs. So at 200+ hours the ECM still holds cold northerly flow but GFS is showing SW winds around flank of Azores high. of the outputs the GFS also has much less favourable upper temps for snow. I feel this briefer,messier synoptic will prove closer to reality than what the ECM is showing. At no stage does proper northern blocking make an appearance in either run.

    So shortlived is my take on this possible blast from the north. But will deliver snow to some.

    It ain't 2010 like at all - as modelled anyway.


  • Closed Accounts Posts: 1,576 ✭✭✭patneve2


    Surprised by the temperature differences between GFS and ECM. It is usually gfs that forecasts lower uppers, this time it's the opposite. Anyways, those are the details and will change many times in the following runs. Hopefully the pv will pay a visit to Europe in the next week or so.


  • Closed Accounts Posts: 3,170 ✭✭✭WheatenBriar


    There's more maratime N Atlantic travel in this airflow than 2010 by far which is why it can only be a literally more watered down version

    That said, the 00Z UKMO moved that lobe of displaced polar vortex more south down the north sea (before the frames stopped)than ESE like earlier runs
    Slight touch of that in the 00Z GFS too which would favour lower dewpoints via a more NNE feed
    A trend towards filtering down some bitter air from northern Scandinavia would be good ;)

    P.s I still can't post links properly :/


  • Registered Users Posts: 6,235 ✭✭✭Oneiric 3


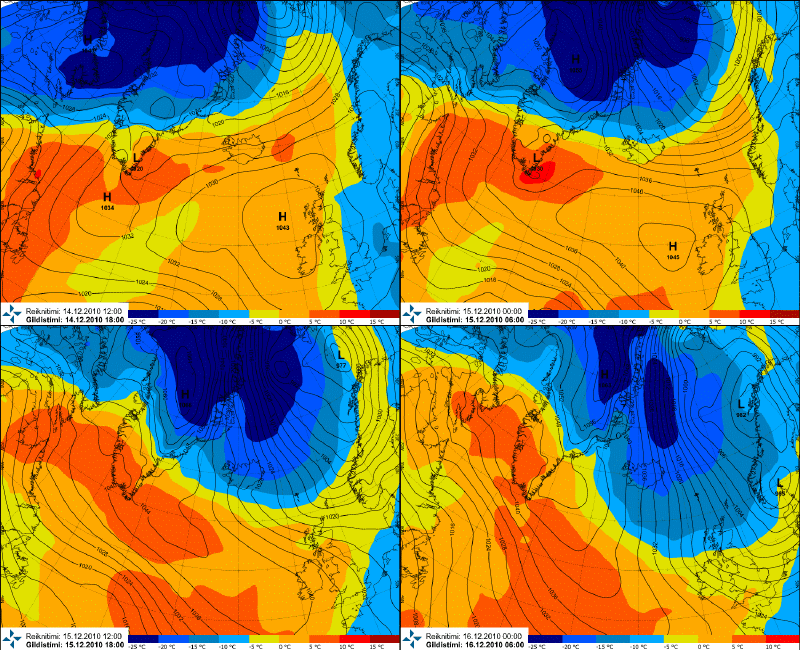
    Just to compare, this is how the mid December 2010 cold spell developed between the 14th & 16th of that infamous month:

    6jrBJb.gif

    336338.png

    A true Arctic northerly :)


    Images from Vedur.is & The UK Met Office

    New Moon


  • Registered Users Posts: 12,778 ✭✭✭✭ninebeanrows


    Mid term trends would suggest a 3-5 day northerly, followed by around 7 days of zonality before a potential prolonged cold spell by mid-Feb.

    February looks like it could deliver the goods


  • Advertisement
  • Registered Users Posts: 2,855 ✭✭✭Nabber


    It ain't 2010 like at all - as modelled anyway.

    There was a post before mine. Must have been deleted. Asking was this going to be like 2010. Hence my 2010 reference

    We are still in FI on it all. But northerly air flow is starting to edge closer to reliable time frame. How it breaks down is where the speculative models need some human fore thought.

    15020400_2500.gif

    The gfs not so pretty at 240
    gfs-0-240.png?6?6

    Given that this is the FI thread, which ever model favours the best outcome, that's the one you'll see here. Only right too 😆


  • Moderators, Science, Health & Environment Moderators Posts: 4,466 Mod ✭✭✭✭mickger844posts


    I'm finding it very hard to get excited about the GFS 06z run with -8 uppers only over the Northern half of the country between 90h and 96h.
    Compared that to the ECM 0z where -8 uppers show a lot more in a 192h period. ECM 0z is a much better run on a lot of levels. Hopefully we will see some sort of NE flow as Northerlies deliver very little in the way of snow in these parts.


  • Registered Users Posts: 1,491 ✭✭✭typhoony


    another good run from the ukmet
    meteociel.fr/ukmo/runs/2015012512/UN144-21.GIF?25-17

    not much point trying to define exact temps, 850's are not going to be reliable until we're 48hrs before this cold outbreak has started. all options are still on the table, there's talk of warm air mixing in the flow, usually we get that when there's a westerly component which is not the case this time, Met Eireann are going for daytime max of +4 by the end of the week. possible but i'd think a degree or 2 colder which will amke all the difference if your'e looking for lying snow. All areas at risk but the east looks favorable now.


  • Registered Users Posts: 6,059 ✭✭✭Elmer Blooker


    a decent easterly a possibility here on this frosty looking chart? Straw clutching I know but a nice change NOT to looking at a big fat Azores in FI land!

    gfsnh-0-288.png?6

    ...... and we end up with a nice Greeney at the end of the run!!


  • Registered Users Posts: 2,855 ✭✭✭Nabber


    This could drum up something for the Dublin/Wicklow


    15020300_2612.gif


  • Advertisement
  • Registered Users Posts: 1,008 ✭✭✭icesnowfrost


    good strong north to northeasterly on saturday.
    gfs-0-108.png?6


  • Registered Users Posts: 1,333 ✭✭✭Saganist


    This looks nice to my laymans eye.


    gfs-1-120.png?12

    With Percip

    gfs-2-120.png?12


  • Closed Accounts Posts: 230 ✭✭AnotherYear


    They are buzzing on netweather about next week. Great post that I've stolen from there

    The Enforcer, on 27 Jan 2015 - 20:25, said:
    What is it about this particular northerly airstream that makes it so unstable? Is it the proximity of the Low Pressure?

    Short answer

    The short answer to your question is yes, the presence of low pressure (at higher altitudes, being coincident with very cold upper air), makes the air more unstable, as the gradient in temperature between the surface and higher altitudes becomes larger.

    Long answer

    The long answer requires some explanation on stability. To avoid things from getting too complex, I will not go into detail about Skew-T diagrams. (If one wishes to have an explanation via Skew-T charts, just ask :smile: )

    Stability of the atmosphere

    (Un)stability has to do with the 'tendency' of a parcel of air to rise from a certain position (in altitude) or to stay at the same position. This tendency is related to the temperature a parcel has compared to its environment.

    Imagine a parcel starts to rise from a certain altitude (say, 1000 meters). The parcel then cools adiabatically (meaning it does not 'mix' with its environment) up to a certain height. If a parcel then finds itself being cooler than its environment (stable conditions), it will drop back to its original position (remember that a certain volume of cold air is in general heavier than an equal volume of warm air). However, if the parcel is warmer than its surroundings (unstable conditions), it will continue to lift to even higher altitudes until it reaches a height when the parcel becomes saturated. This height is the height where clouds start to form. Thereafter, the parcel will still continue to rise up to where it finds itself in an environment that is warmer than the parcel itself. (Note that the cooling process during ascent of a parcel is different when the parcel is saturated, but goes too far to treat this in detail). The parcel then stabilizes, and this can (under great simplifications) indicate the height of a cloud.
    What this comes down to is that when the air is unstable, showers are easier to form based on the parcel analogy described above.

    A good measure of stability is the change of temperature with height. If the temperature drops sharply with height, the atmosphere can be considered unstable (referring back to the parcel analogy). When the temperatures decreases only weakly with height or even increases with height, the atmosphere is stable (from the parcel analogy: a parcel will find itself colder than its environment after ascent, meaning it will drop back to its original position).

    To illustrate this, below is a series of images showing the parcel analogy:

    post-20885-0-40573500-1422399556_thumb.png
    Stable situation

    post-20885-0-70874400-1422399551_thumb.png
    Unstable situation

    In the images above, the x-axis indicates the temperature, while the vertical axis (y-axis) denotes height.
    For both graphs, the red line indicates the change in temperature over height of the environment of a certain parcel (technically spoken: lapse rate). Note that the environmental temperature drops much more with height in the unstable situation than in the stable situation.
    The black dot indicates a parcel on a random level. The arrow pointing to the upper-left stands for the adiabatic rising (and the accompanied cooling) of this parcel. For both images, this parcel cools at a same rate (so the black arrow has the same slope to the left on both images).

    As can be seen in the stable situation, the parcel becomes colder than its environment after rising. Therefore, it is being forced downward again. On the other hand, in the unstable situation, the parcel becomes warmer (and thus lighter) than its environment, indicating the parcel will continue to rise.

    Temperature difference representation between surface and aloft

    Coupling the part given above back to the presence of low pressure at higher heights and stability, one can realize that the difference in temperature between the surface and aloft (I'll be using the 500 hPa level, being about 6 km, as a reference for now) must be very large in order to have an unstable atmosphere. If the atmosphere can be more or less unstable when the temperature at the surface stays the same, the temperature at 500 hPa has to vary accordingly. In other words, changes in stability can be explained by variations in temperature at 500 hPa level.

    Simplifying a bit, one can assume as a general rule that low pressure activity at higher altitudes is accompanied by lower temperatures at that same level. (more in-depth explanation can be found here). This means that, in general, low pressure at higher altitudes indicates the atmosphere is more unstable than when high pressure is present at higher altitudes (and thus showers are by approximation more likely to form when low pressure is present at higher altitudes)

    Seasonality in stability

    An important difference between summer and winter regarding stability is that the surface is usually colder during winter than summer. This means that the upper air has to be colder in winter to acquire instability than during summer.

    Combing to current weather

    The weather that we are about to observe this Thursday up to the weekend is a very nice example to illustrate the relation between stability and the presence of low pressure at higher altitudes. Therefore, given below is the pressure forecast of the GFS for next Thursday:

    Rtavn481.gif
    GFS surface level pressure and 500 hPa heights (colours), 18Z T+48

    It is important to focus solely on the 500 hPa heights, indicated by colours. As a rough guide, purple/blue colours indicate low heights (lower pressure activity at 500 hPa height) while yellow/red colours indicate high heights (high pressure presence at 500 hPa height).

    Note that there is a very deep trough (low pressure area) present at 500 hPa height over Western Scandinavia and Northeastern UK. Referring to the explanations, low pressure at 500 hPa should coincide with lower 500 hPa temperatures. Much higher heights (relatively higher pressure) are present to the southwest, west and north of the UK. Therefore, the 500 hPa temperatures for the same timeframe (from the GFS forecast) are given below:

    15012918_2712.gif
    GFS 500 hPa temperatures, 12Z T+54

    The runs of the GFS are two different ones (18Z above, 12Z below), but they are valid for the same timeframe. Since big changes between runs for 2 days out are not likely, I'll therefore assume that both runs show the same situation.

    Note that there is a large swathe of very cold 500 hPa temperatures present to the east of the UK (down to -38*C). This is associated with the very deep trough present to the east and over the UK. Much warmer 500 hPa temperatures can be found to the south and west of the UK, while the 500 hPa temps are also slightly warmer to the north of the UK.

    The surface temperatures do not vary much in the neighbourhood of the UK at this timeframe (except for land/sea effects). The surface temperature chart for this Thursday can be found here.

    Thinking of the parcel analogy given in the beginning of this post, it becomes evident that showers are more likely to develop over or to the east of the UK than to the north, west or south (assuming equal surface temperatures).

    Northerlies and stability

    Regarding wind, there are northerlies present over and to the north of the UK, while to the east of the UK there is barely any wind. (you can find the wind forecast from the GFS here). However, as we can see above, the air to the north of the UK is less cold than over the UK itself. This means that despite the fact that the northerlies are stronger to the north of the UK are stronger than the ones over the UK, the air over the UK is more unstable (due to the lower upper temperatures).

    Exceptions

    One possible exception is the presence of a polar low. Such systems may pop up out of nowhere and yield a lot of snow, being completely overlooked by global models. Quoting from s4lancia:

    s4lancia, on 27 Jan 2015 - 21:00, said:
    Worth remembering that the much overused polar low can only truly form in a true AM airmass and one of a decent duration. Will be worth keeping an eye nearer the time for the formation of these rare little beasts from next weekend when a northerly kicks in. No point trying to look outside 12 hours or so as they normally pop out out of nowhere and disappear as quickly as they arrived. Great fun to be underneath one at the time though!

    Summary

    To summarize the relationship: low pressure at high heights is coincident with cold upper air, yielding a bigger temperature difference between the surface and aloft. This yields a more unstable atmosphere.

    It has to be kept in mind, though, that this relationship is simplified, so it does not have to match the actual conditions in any case.

    Conclusion

    Even a very short question can have a very long answer, and in fact there was much more that possibly could have been told about this. I hope this answers you question sufficiently :smile: . If something is not clear, do not hesitate to ask! Furthermore, I am by no means an expert on this subject, so any additions/corrections are also very welcome!

    Finally, if one would like some explanation about this via Skew-T diagrams, that's possible (probably with some delay :wink: ). A good read about Skew-T diagrams, which could also serve to visualize stability, is given below:

    https://forum.netwea...kew-t-diagrams/

    EDIT: Added graphical representation of stability.

    Sources:
    http://www.wetterzen...n/fsavneur.html
    http://www.keesfloor.../10neerslag.htm
    https://forum.netwea...-forecast-snow/
    https://forum.netwea...kew-t-diagrams/
    http://www.weatheron...38;HH=48&ZOOM=0&ARCHIV


  • Closed Accounts Posts: 230 ✭✭AnotherYear


    GFS keeps us in cold unstable Northerly

    gfs-1-96.png?18

    gfs-1-120.png?18

    gfs-1-120.png?18

    gfs-1-156.png?18


  • Closed Accounts Posts: 230 ✭✭AnotherYear


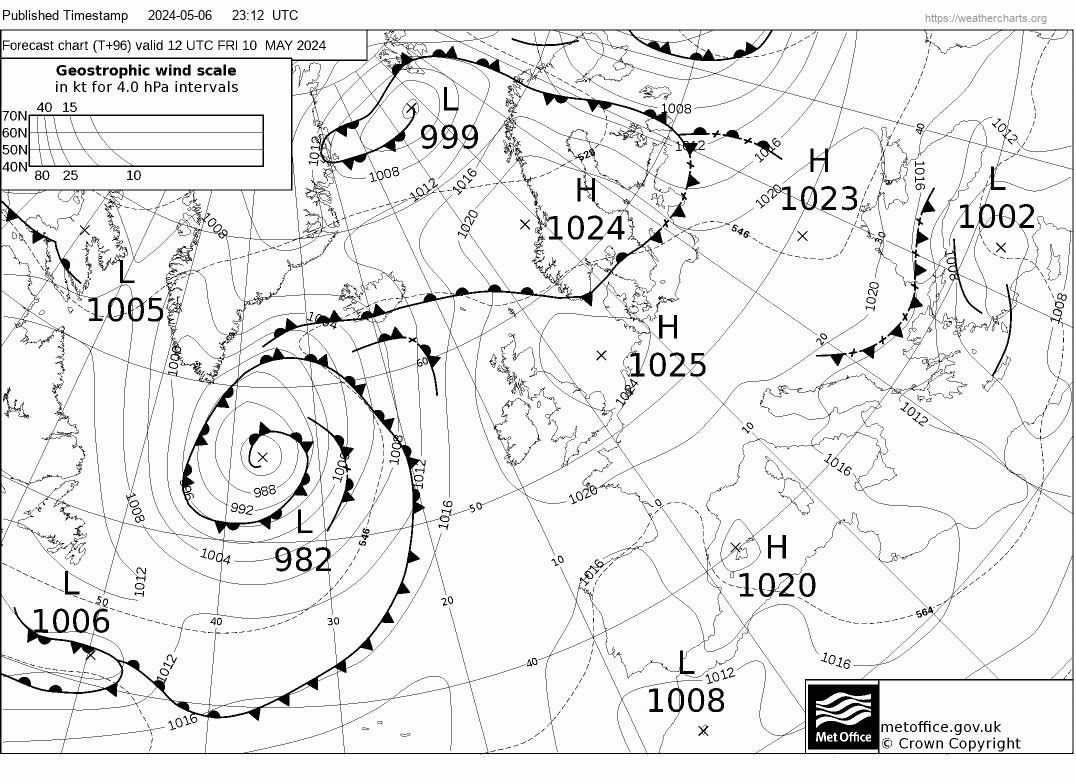
    UKMO Fax chart at t96
    post-1206-0-81911400-1422398400_thumb.gif


  • Registered Users Posts: 2,013 ✭✭✭John.Icy


    Good read!

    Just on the 18z, just shows how up in the air everything after Sunday is, we get a much better sliding of a low leading to a more potent northerly till Wednesday before the high moves in. On the 12z the high was much closer and not much snow would have been about with a slacker flow. Things are ever changing, the high moving in closer Monday/Tuesday still looks favourite, but we'll see what the 0z bring us.

    At +120 ish on the 18z, we are pretty close to getting blocking to our NW established. Ultimately a new burst from the Azores scuppers it BUT never say never.

    (We end up with a Scandi on the 18z, and at +240 on the ECM that's probably where we were heading too. As far as I'm concerned a Scandi can stay away though, next to useless for us unless it's aligned to millimetre precision and we wouldn't be that lucky).


    EDIT: Flicking through the ensembles.... several runs around +120 also developing more substantial blocking in the following frames keeping us in a more potent set up. We are not without chances regards next week. eg:

    gens-20-1-162.png

    I have some hope (a little but it's there)


  • Registered Users Posts: 11,134 ✭✭✭✭maquiladora


    UKMO Fax chart at t96
    post-1206-0-81911400-1422398400_thumb.gif

    grandma_meme.jpg

    PPVM89.gif?31415


  • Registered Users Posts: 9,235 ✭✭✭lucernarian


    Polar lows are interesting but are not feasible to predict in fantasy island sadly. We have enough to drool at in t+240 as it is. If anyone is looking out for particularly unstable in FI, -40 celsius air on the 500 hPa temperature charts is a good place to start.


  • Registered Users Posts: 2,674 ✭✭✭Rougies


    Polar lows are interesting but are not feasible to predict in fantasy island sadly. We have enough to drool at in t+240 as it is. If anyone is looking out for particularly unstable in FI, -40 celsius air on the 500 hPa temperature charts is a good place to start.

    Isn't that the whole point of fantasy island?! :P


  • Registered Users Posts: 5,981 ✭✭✭TheMilkyPirate


    06Z GFS continues the trend of cold and snowy for the east on Monday/Tuesday

    R3WP6Hd.png


  • Advertisement
  • Registered Users Posts: 5,981 ✭✭✭TheMilkyPirate


    Just to note, ECM this morning also had the feature just some small timing differences. Hopefully some V. interesting days of model watching ahead.

    xyE4TSq.gif


  • Registered Users Posts: 9,235 ✭✭✭lucernarian


    Rougies wrote: »
    Isn't that the whole point of fantasy island?! :P
    Not for picking out small mesoscale features lasting perhaps 24 hours that require several parameters to be in place before they even form! Even short range models don't track them well, they're nowcast territory :cool:

    But the bigger point is that Fantasy Island for me can show tempting pools of -40 500 hPa air advecting south to play havoc with warm Irish waters. Whether it's thundersnow, embedded troughs, shallow LPs or even a polar low won't be known nor will it matter if everyone can enjoy widespread snow showers anyway.

    Anyway about things that are actually present in FI charts, this ECMWF chart for 3rd February looks tempting especially if you're in central and northern areas or on higher ground in the East. GFS can feck off for all its supposed upgrades were worth.
    <SNIP: Posted in previous post. Beaten by a minute!!


  • Registered Users Posts: 5,981 ✭✭✭TheMilkyPirate


    Well our low is still there on the 12Z although not as pronounced but small differences.

    pR04gvE.png

    Around 16 of the 20 ensembles model the low with number 6 probably being the pick of those.

    qbyPRbg.png

    Ukmo isn't fantastic but still brings a brief N/easterly flow after the low exits to our south-east

    cvh8uAn.gif

    It's still very far away for a feature such as this and it could be completely gone by tomorrow morning but it's good to watch unfold and I'm looking forward to tonights ECM.


  • Registered Users Posts: 23,562 ✭✭✭✭Kermit.de.frog


    I raise you...

    gem-0-144.png?12


  • Registered Users Posts: 2,013 ✭✭✭John.Icy


    Glorious evolution in the latter stages of the 12z. A plausible one too, plenty of runs wanting to build heights of Scandi, but usually the heights are too far east over Scandi, but we got the undercut which allowed heights to push back west. I'd almost bank it but I'm greedy and want a NE'ly to get some snow :D

    2cyqzpy.png


  • Registered Users Posts: 23,562 ✭✭✭✭Kermit.de.frog


    Try not to keel over when you look at the 00z GEM

    gem-0-150.png?00

    http://www.meteociel.fr/modeles/geme_cartes.php


  • Registered Users Posts: 2,342 ✭✭✭red_bairn


    Try not to keel over when you look at the 00z GEM

    http://www.meteociel.fr/modeles/geme_cartes.php

    765025.gif


  • Registered Users Posts: 11,134 ✭✭✭✭maquiladora


    It's a shame the GME is such a terrible model.

    gme-0-132_zue0.png
    gme-1-132_boe5.png


  • Registered Users Posts: 6,059 ✭✭✭Elmer Blooker


    Can we do it? Touching distance!! (as I watch the snow fall)


    gfs-0-150.png?6


  • Advertisement
  • Registered Users Posts: 1,985 ✭✭✭BLIZZARD7


    gfs-0-102.png?6

    This is going to be a close run thing early next week... Somewhere in Ireland is likely to get a big dumping... Where is very uncertain.


Advertisement