Advertisement
If you have a new account but are having problems posting or verifying your account, please email us on hello@boards.ie for help. Thanks :)
Hello all! Please ensure that you are posting a new thread or question in the appropriate forum. The Feedback forum is overwhelmed with questions that are having to be moved elsewhere. If you need help to verify your account contact hello@boards.ie
Hi all! We have been experiencing an issue on site where threads have been missing the latest postings. The platform host Vanilla are working on this issue. A workaround that has been used by some is to navigate back from 1 to 10+ pages to re-sync the thread and this will then show the latest posts. Thanks, Mike.
Hi there,
There is an issue with role permissions that is being worked on at the moment.
If you are having trouble with access or permissions on regional forums please post here to get access: https://www.boards.ie/discussion/2058365403/you-do-not-have-permission-for-that#latest

2020 officially saw a record number of $1 billion weather and climate disasters.

1272830323351

Comments

  • Registered Users, Registered Users 2 Posts: 8,219 ✭✭✭Gaoth Laidir


    The link would have done grand...

    I don't think anyone here is denying that the climate is warming, just the extent of the human contribution and the hyperbole after every weather event, extreme or otherwise.

    The latest GHCN v4 dataset has an increased proportion of automated stations, which we've recently seen can give falsely high readings if not in standard screens. I don't see that discussed above. The German floods were greatly exacerbated by several factors not related to the actual rainfall totals, yet it's only the rainfall that's discussed (in the media and general commentary, at least). The attribution studies are unable to give any real estimate of value as to the extent of human effects (huge ranges), but the upper estimate is always the one quoted. And so on.

    We'll have Hurricane Ida tomorrow and of course the hyperbole will appear, as if there has never been a Cat 4 there before. Will the Guardian or Channel 4 quote those below?


  • Registered Users, Registered Users 2 Posts: 22,597 ✭✭✭✭Akrasia


    I posted that list because pretty much all of them have been brought up on various threads on this forum over the years as justification for not taking action on climate change and when the argument gets defeated opinion never changes, another argument is pulled in to justify the opinion that never changes. And you’ve just done it again here, introducing a concept that is novel to you as though nobody in the scientific community is aware of it.

    Biases and anomalies in station data are discovered by climate scientists or people working in the area and when these are validated, the data is regularly reanalysed and corrected where appropriate

    ‘skeptics’ for decades have been using these kinds of anomalies as excuses to disregard calls to act on climate change, always focusing only on the gaps in our knowledge or areas of uncertainty instead of the conclusions from what we do know

    Scientists warned for decades that we needed to keep CO2 below 350ppm to limit warning to below 1c where dangerous consequences would begin to happen. Governments failed to act, in a very large part due to cynical deliberate efforts to spread doubt and prevent government action

    we’re at 410ppm now and we are past the threshold where we can prevent 1.5c of warming so we’ve got severe consequences already locked in, our target now is to limit those consequences which will be locally catastrophic, and avoid globally catastrophic warming, which scientists agree, has the potential to escalate into the plot of those made for TV movies you accused me of fantasizing about.

    Climate change of more that 5.5c for a doubling of CO2 is not ruled out by the IPCC.(there’s a roughly 10% chance of more than. 4.5c of warming for ECS) Given how high the risks to ecological and political stability are at ‘only’ 2 or 3c of global warming a 10% chance of 4.5c is unacceptably high

    “climate change is the threat multiplier that worsens social, economic, and environmental pressures, leading to social upheaval and possibly even violent conflict”.

    According to her, the “story” around climate change should not only be told in terms of resource scarcity, extreme weather and the need to foster clean energy. The narrative must go beyond and present climate change as a complex and multidimensional risk, with security and stability at its heart.

    “If we fail to reduce emissions and build our capacity to cope with impacts, over the long term, climate change will result in more disruption, more instability and more displacement as impacts intensify. The world will be less stable, less secure … We must redouble our efforts or this story will have a dramatically different ending”.”


    Anyone who continue to downplay climate change or call people ‘alarmists’ for urging action are on the wrong side of history

    Hurricane Ida is showing many of the fingerprints of climate change Yet another rapid intensification fueled by extreme warm ocean surface temperatures

    You’ve already stated your intention to downplay the climate change link to Ida. You’re putting in your rapid non attribution study before it’s blown itself out


  • Registered Users, Registered Users 2 Posts: 6,143 ✭✭✭OldRio


    The post serious issue is when did the spellinging of sceptical change to skeptical. This needs addressing.


  • Registered Users, Registered Users 2 Posts: 22,597 ✭✭✭✭Akrasia


    In the UK dictionary, sceptic is spent with a c, in the US, it's spelt with a K, but by convention, because the 'scientific skepticism' originated largely in the US with claims like 'tobacco doesn't cause cancer' using the deliberate strategy to focus on the 'uncertainty' rather than the scientific evidence. when I use the word 'Skeptic' in quotes, this is what I refer to. Not genuinely sceptical, but more on the pretending to be sceptical because they've already made up their mind based on political ideology or some other non scientific basis

    "There is an exception, though: In reference to some 21st-century strains of scientific skepticism, writers and publications from outside North America often use the spellings with the k."

    https://grammarist.com/spelling/sceptic-skeptic/

    Being sceptical is very important, all scientists are sceptical by profession.

    People who claim to be sceptical but are only sceptical in one direction (they'll believe things that agree with their pre-existing with little or no fact checking or supporting evidence, but poke holes in absolutely everything the 'other side' say and demand certainty and other impossible standards


  • Registered Users, Registered Users 2 Posts: 8,219 ✭✭✭Gaoth Laidir


    Hurricane Ida is showing many of the fingerprints of climate change Yet another rapid intensification fueled by extreme warm ocean surface temperatures

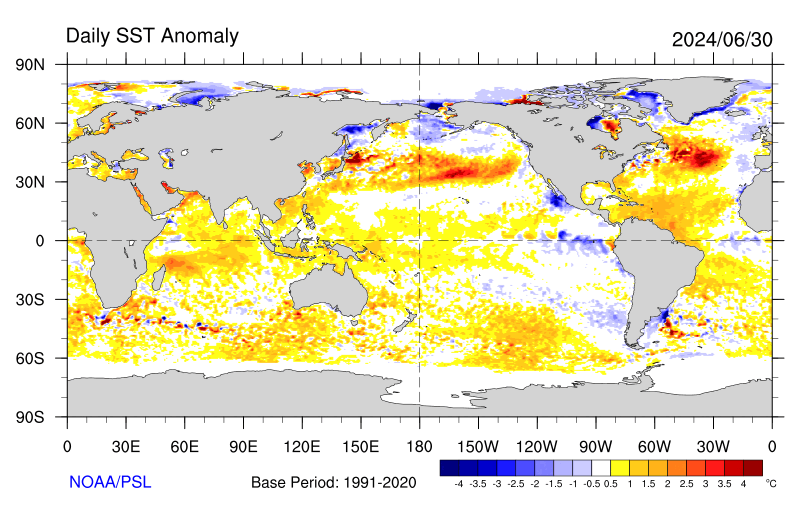
    Eh, it's been over anomalously cold SST for the past few days and will only now be going over the Loop Current Eddy, which has always been a periodic warm anomaly in that area. It hasn't intensified at all yet and if it does it will be nothing out of normal ranges. You're just making stuff up now.


  • Registered Users, Registered Users 2 Posts: 8,219 ✭✭✭Gaoth Laidir


    This was when Ida formed a couple of days ago. The cold anomaly was even larger.


  • Registered Users, Registered Users 2 Posts: 22,597 ✭✭✭✭Akrasia


    Lol. anomalously cold with a baseline starting in 1981. What’s the anomaly over the 20th century average?

    every single datapoint will have been warmer than that average with the deep red elements likely being record high temperatures for any period before 1980

    rapid intensification was rare before climate change, now it’s becoming normal, so normal that it’s expected multiple times per hurricane season. This is the shifting bell curve I keep talking about

    also an Eddy which has always been a periodic warm anomaly makes no sense logically

    it might have been part of a natural oscillation but you need to look at the magnitude of that anomaly. Each fraction of a degree of temperature represents enormous amounts of energy. That energy came from the sun, got trapped by the radiative imbalance caused by AGW and has to go somewhere

    where does that energy go Gaoth Laidir

    This is your chance to change the K to a C


  • Registered Users, Registered Users 2 Posts: 6,238 ✭✭✭Oneiric 3


    Hurricane Camille, August 1969:

    Hurricane Camille - August 17, 1969 (weather.gov)

    And a list of 20th Century Gulf hurricanes from Baldy Bezo ran WaPo:

    WashingtonPost.com: WeatherPost -- Memorable Gulf Coast Hurricanes of the 20th Century

    Sorry Arkrasia, but your claim that 'rapid intensification before climate change (whatever that means in itself) was rare' is nonsense.

    New Moon


  • Registered Users, Registered Users 2 Posts: 6,238 ✭✭✭Oneiric 3


    And it doesn't matter how Americans spell 'scepticism' because they spell it wrong.

    New Moon


  • Registered Users, Registered Users 2 Posts: 22,597 ✭✭✭✭Akrasia


    You are one to talk. You can’t spell my username when it’s right there in front of you


  • Advertisement
  • Registered Users, Registered Users 2 Posts: 22,597 ✭✭✭✭Akrasia


  • Registered Users, Registered Users 2 Posts: 6,238 ✭✭✭Oneiric 3


    I'd prefer to read actual accounts, just as in those links on historic Gulf hurricanes I linked, which are evidence enough that you are talking complete nonsense.

    New Moon


  • Registered Users, Registered Users 2 Posts: 22,597 ✭✭✭✭Akrasia


    You didn’t have time to read the paper before you replied so I’m assuming You’d just prefer to read the evidence that agrees with your pre-existing opinion. ‘Skeptics’ hate reading anything that might inform them

    A study that researches the rate of rapid intensification is more valuable than link dumping a list of events don’t change think?

    You don’t even need to read the paper I posted, it was peer reviewed in a top journal so it has already been checked for errors


  • Registered Users, Registered Users 2 Posts: 6,238 ✭✭✭Oneiric 3


    I just posted links of historic accounts of major Gulf hurricanes which you also didn't read for the very same reason you accuse me of. Are you even capable of seeing the world outside of 'peer review'?

    New Moon


  • Registered Users, Registered Users 2 Posts: 8,219 ✭✭✭Gaoth Laidir


    also an Eddy which has always been a periodic warm anomaly makes no sense logically

    It makes perfect sense. If you think that back in the utopian climate the SST anomaly charts showed no positive or negative anomalies then you're sorely mistaken. There have always been warm and cold anomalies at any instant in the past, and now is no different. The Loop Current has always formed a warm eddy in the mid-Gulf with a periodicity of 1-2 years. The Cat 4-5 storms that impacted Louisiana back in 1856 and 1893 most likely rapidly intensified over the same warm eddy. We just didn't have the luxury of satellites and aircraft recon to detect these rapid changes.

    Taking the 1971-2000 average (below), the trend is the same. Ida formed in an area of average SST and is now entering the same warm anomaly.


  • Registered Users, Registered Users 2 Posts: 6,238 ✭✭✭Oneiric 3


    The 1971-2000 anomaly shows more or less the same thing:

    Though the cooler south Gulf region may have been down to recent hurricanes passing through the area and absorbing a lot of that excess SST's as they passed over.

    New Moon


  • Registered Users, Registered Users 2 Posts: 22,597 ✭✭✭✭Akrasia


    Your list was completely irrelevant to the post you replied to which related to the increasing rate of rapid intensification


  • Registered Users, Registered Users 2 Posts: 6,238 ✭✭✭Oneiric 3


    I didn't reply to any post, and I only brought up one small quote from you to make the point that you are trying to sell a very distorted version of history, which my links easily prove.

    New Moon


  • Registered Users, Registered Users 2 Posts: 8,219 ✭✭✭Gaoth Laidir


    Does it? Some very key statements from said article. When I mention the AMO I get shot down. They can't find any anthropogenic trend in the observational dataset so they resort to model data again. Still, apparently observations make it unequivocal that anthropogenic effects have been responsible for increasing trends (IPCC).

    The upward trend in TC activity during the 1990s is typically attributed to the Atlantic Multidecadal Oscillation (AMO), which features multidecadal fluctuations in SSTs in the Atlantic basin. In the late 1990s, the phase of the AMO shifted from negative to positive which coincides with warming in parts of the Atlantic basin where TCs develop14. Therefore, the AMO phase favored RI at the end of the time series. In addition to the AMO behavior, the reliability of the observational data in the Atlantic basin suggests the positive trend in intensification rates during 1982–2009 is likely robust.


    The variations in the slope of RI ratio among the global observations as well as the lack of a published theory that explains the source of a significant positive slope in global TC intensification metrics highlight the uncertainty in the global results. Conversely, the recent uptick in intense TCs and RI magnitude in the Atlantic basin appears more plausible because of the AMO shifting phase.


  • Advertisement
  • Registered Users, Registered Users 2 Posts: 6,238 ✭✭✭Oneiric 3


    Gulf SST anomalies over the last month:


    New Moon


  • Registered Users, Registered Users 2 Posts: 6,238 ✭✭✭Oneiric 3


    Edit to above post. These are the actual anomalies over the last month. The above shows temperature trend rather than deviation.


    New Moon


  • Registered Users, Registered Users 2 Posts: 22,597 ✭✭✭✭Akrasia


  • Registered Users, Registered Users 2 Posts: 22,597 ✭✭✭✭Akrasia


    I request peer reviewed research instead of random links because the peer reviewed research has already had qualified people spending hours checking the work to make sure the data matches the conclusions, and I have very good reasons for not trusting you to follow up on my questions. Dumping links is easy because you can just ignore any comments afterwards.

    Primary data is the starting point of science. The conclusions from peer reviewed research are the outcome of that data being assessed against our collective knowledge


  • Registered Users, Registered Users 2 Posts: 6,238 ✭✭✭Oneiric 3


    I don't know. NOAA does not (as far as I can tell) make this clear, just as they did not with the previous version of these maps which they ran for years.

    But this long-winded link might give a hint: Description of the Version 3.1 NOAA Coral Reef Watch Daily Global 5km Satellite Coral Bleaching Heat Stress Monitoring Product Suite Climatology

    New Moon


  • Registered Users, Registered Users 2 Posts: 6,238 ✭✭✭Oneiric 3


    I don't post 'random links'. If there is any flaw or misleading information in any of those links I posted earlier, then please call it out.

    New Moon


  • Advertisement
  • Registered Users, Registered Users 2 Posts: 22,597 ✭✭✭✭Akrasia


    If the conclusions were not supported by the data, then the paper either would not have passed peer review, or there would be other papers challenging the results by now.

    If you have these links, send them to me and I'll happily retract my reference and revise my view, otherwise, your opinion is just waffle.


  • Registered Users, Registered Users 2 Posts: 22,597 ✭✭✭✭Akrasia


    so what is your aim in posting sst anomaly gifs if you don't know what the baseline is? That's a fundamentally important element when you're arguing about multi decadal trends like Climate change


  • Registered Users, Registered Users 2 Posts: 22,597 ✭✭✭✭Akrasia


    My point is that I try really hard to post data that has already been validate by experts (peer reviewed) you dump random graphics without even checking what the baseline for the anomaly is, thereby making everyone else do the work you couldn't be arsed doing. You have zero accountability for the information you repost on the internet. Just like all those unqualified bloggers who are never held accountable for their errors.


  • Registered Users, Registered Users 2 Posts: 6,238 ✭✭✭Oneiric 3


    There is no aim other than to show what they are and where in the weeks beforehand. The maps are from NOAA, whom I am sure you trust, given that they are all sciencey and stuff, so take up your gripe with them.

    And I already know what are 'fundamentally important elements' are, so enough with the preachy tone.

    New Moon


  • Registered Users, Registered Users 2 Posts: 6,238 ✭✭✭Oneiric 3


    Wow, somebody is angry today...

    I'm not the who has been giving out misleading and false information here.. you are. If you don't like to be called out for doing so, then don't do it in the first place.

    New Moon


  • Advertisement
  • Registered Users, Registered Users 2 Posts: 22,597 ✭✭✭✭Akrasia


    so the anomaly baseline is in the previous few weeks?

    How ludicrous is that? In the northern hemisphere SSTs get hotter until the summer ends and then get colder as autumn and winter kick in.

    How on earth could any sensible person think that this anomaly gif is anyway useful in the context of this argument?

    You might as well take a picture of a cloud and use that as an argument against climate change


  • Registered Users, Registered Users 2 Posts: 8,219 ✭✭✭Gaoth Laidir


    I'm quoting the paper you yourself referenced, which states that the observations don't show what is claimed to be already happening. It the same with many other features too, where the only possible attribution comes down to some very shaky model outputs with ranges as wide as the Atlantic.

    Now you're already attributing a future even (Ida) to CO2 without even one shred of evidence. You dismiss my opinion (based on actual facts, which I have always referenced) as waffle, which is a bit rich, considering.


  • Registered Users, Registered Users 2 Posts: 6,238 ✭✭✭Oneiric 3


  • Registered Users, Registered Users 2 Posts: 8,219 ✭✭✭Gaoth Laidir


    There are several maps posted above spanning two different reference periods. What more do you want? They didn't show what you wanted so now you've gone off on some unrelated tangent.


  • Registered Users, Registered Users 2 Posts: 22,597 ✭✭✭✭Akrasia


    in a warming world, the observations lag the model predictions.

    We cannot use double blinded experiments on planetary systems. This is why we use Models. The models are our best way of assessing risk and responses to theoretical changes.

    Which part of the above do you disagree with?


  • Registered Users, Registered Users 2 Posts: 22,597 ✭✭✭✭Akrasia


    I never analysed the results of those gifs because the base period was not provided, but I guarantee, than if these were the evidence provided in a peer reviewed research paper awaiting validation, that these would be first the questions asked of the researchers, and they would be obliged to justify why they chose these data, these baselines and to demonstrate how that data supports those arguments. If you don't like these questions, then I'm sorry, but that's the standard. you need to emulate if your arguing against other peer reviewed papers (in reputable journals)


  • Registered Users, Registered Users 2 Posts: 8,219 ✭✭✭Gaoth Laidir


    I can't make it any clearer, but let me try.

    We are being told that X weather event has become more frequent/severe due to climate change. In most cases this X event is a weather event that has occured in the past (e.g. Cat 4-5 hurricane landfall in Louisiana), but now the implication is that its occurrence these days is due to a theoretical increased probability of these events happening, not actually any observed increase.

    Tell me, how did such hurricane landfalls occur back 150 years ago if you're now putting them down to increased sea temperatures? Just taking hurricanes as an example.


  • Registered Users, Registered Users 2 Posts: 22,597 ✭✭✭✭Akrasia


    at least you're honest.

    Now that you've agreed you're clueless, do you think you might like to defer to people who are regarded as experts in their fields?


  • Registered Users, Registered Users 2 Posts: 8,219 ✭✭✭Gaoth Laidir


    The two charts I posted clearly had the reference periods on them (and I also stated them for good measure). Are static maps not good enough now?


  • Registered Users, Registered Users 2 Posts: 6,238 ✭✭✭Oneiric 3


    Gulf of Mexico annual temp (monthy or daily not availablve from this site) for 1969, the year of Camille, which brought a central low pressure of 900hPa and recorded winds of 200mph in August.

    And long term temperature trend in Gulf SSTs.

    From this 'random link' here:

    Climate Reanalyzer

    New Moon


  • Advertisement
  • Registered Users, Registered Users 2 Posts: 8,219 ✭✭✭Gaoth Laidir


  • Registered Users, Registered Users 2 Posts: 6,238 ✭✭✭Oneiric 3


    More than once, and only recently, you have given out misleading information on here and also accused me of saying things that even your own evidence that you produced says I didn't, so I'd quit with the preachy tone if I were you.

    But a question I will put to you... do you ever do you own research on anything? or do you just leave everything to your chosen 'experts'? to do?

    New Moon


  • Registered Users, Registered Users 2 Posts: 22,597 ✭✭✭✭Akrasia


    also keeping it super simple.

    If extreme events required multiple rare confluences to happen, then they happen over long timespans, but happen infrequently. If you make any of those required events less rare, then all else being equal that same extreme event becomes more common.

    Its as simple as that. One of the most common requirements for rapid intensification is hot SSTs

    It the rest of the requirements are random stuff like wind sheer, the PDO, the NAO, ENSO, jet stream being in a certain position etc etc etc

    Locking the SSTs to be generally much warmer than preindustrial means that one of the random events becomes a constant instead of a potential blocker. So what is left to decide is the intensity of the event, rather than whether or not it forms


  • Registered Users, Registered Users 2 Posts: 8,219 ✭✭✭Gaoth Laidir


    Where did the warm SSTs come from in 1856 or 1893?


  • Registered Users, Registered Users 2 Posts: 22,597 ✭✭✭✭Akrasia


    Or because I obviously can’t keep things simple. The odds of rolling a double 6 on 2 sets of dice are 2 times in a hundred. I’d you make both dies 7 sided, the odds of rolling 12 or greater changes to more than 8%


  • Registered Users, Registered Users 2 Posts: 22,597 ✭✭✭✭Akrasia


    I don’t do my own research. I’m not a researcher and have nobody to peer review my findings. I do try my best to fact check my claims and other people’s claims

    This involves checking others sources to make sure they are based on peer reviewed science as much as possible


  • Registered Users, Registered Users 2 Posts: 6,238 ✭✭✭Oneiric 3


    I do do my own research, because as someone who has gone through the rigmarole of academia, as I am sure you have and others on here who I do know have, that is what I was taught and trained to do, so I too will 'fact-check' (a totally meaningless media created term - which they have more than once, had to retract their own 'fact-checks' for being totally wrong ) where I see fit.

    New Moon


  • Registered Users, Registered Users 2 Posts: 22,597 ✭✭✭✭Akrasia


    Local variability

    ya know. Weather. Climate is the average of local weather over decades. anthropogenic Global climate change is the progressive changes to local climates caused by the global average temperature increasing caused by the greenhouse effect

    This is basic stuff


  • Registered Users, Registered Users 2 Posts: 6,238 ✭✭✭Oneiric 3


    It's 'weather' when I can't explain it, but 'climate' when I think I can.

    That is how 'basic' this really is.

    New Moon


  • Advertisement
  • Registered Users, Registered Users 2 Posts: 8,219 ✭✭✭Gaoth Laidir


    And this local variability ceased to exist after the mid-20th century, right? It fits the story for explaining old events but not the new.


Advertisement