Advertisement
If you have a new account but are having problems posting or verifying your account, please email us on hello@boards.ie for help. Thanks :)
Hello all! Please ensure that you are posting a new thread or question in the appropriate forum. The Feedback forum is overwhelmed with questions that are having to be moved elsewhere. If you need help to verify your account contact hello@boards.ie
Hi there,
There is an issue with role permissions that is being worked on at the moment.
If you are having trouble with access or permissions on regional forums please post here to get access: https://www.boards.ie/discussion/2058365403/you-do-not-have-permission-for-that#latest

SUDDEN STRATOSPHERIC WARMING (Watch 2012-2013)

  • 10-11-2012 12:17pm
    #1
    Closed Accounts Posts: 2,693 ✭✭✭


    Hi there folks and welcome once again to the Stratosphere thread.

    What the ??????

    Some new people on here might already be lost but here are some links to get you up to date.
    The previous threads on this explain in great detail.
    This next link gives a good place to read first.

    http://www.boards.ie/vbulletin/showthread.php?t=2056438481

    Current temp showing a dive at 30mb and usually not good as this helps the polar vortex to gain strength. Not what we want to see but it's so early in the season that any wave breaking of warmer temperature can reverse it fairly quickly and has history has shown, actually caused a SSW soon after.

    30mb9065.gif

    The Strat westerly wind is not influencing much at the moment as can be seen below. There is still a fair amount of reduced west zonal wind in lower atmosphere fighting its progress.

    Negative Quasi Biennial Oscillation is seen over equator (blue) 30mb

    ecmwfzm_u_f24.gif

    Just getting thread up and running for now. More to be added.

    It's early doors yet and other members can and have contributed greatly in the past so please keep it going.


«13

Comments

  • Closed Accounts Posts: 4,279 ✭✭✭Su Campu


    ECMWF showing a strengthening of the PV over the next 10 days at least.


  • Registered Users, Registered Users 2 Posts: 39 Capillatus


    Hello again.

    Nice to see the topic up and running already.
    First, I would like to take this opportunity, to say a big THANK YOU, to all who contributed to a very educational topic in the last season, especially Mr. Redsunset and Mr. pistolpetes11. Looking forward to some good debates this season.

    Nothing much on the horizon for now, but I am optimistic, that this year we could see a bit more intense "SSW" action than in the 11/12 season. Mainly because of the overall setup, which looks a bit different than last year.

    Ok. First I am going to make the reanalysis of the 500mb pattern composite from October 1. to November 10., just to show how we stand against last year.

    2011
    compday89142234105317642.gif

    2012
    compday89142234105317643.gif

    I don't think any comment is needed, because its clearly obvious that this year the overall pattern looks almost reversed, when compared to last year. What I like the most, is the strong Aleutian blocking and the warm AMO ridging.


    Now I think we all know there are also significant changes in the ocean oscillations compared to last year.

    2011
    compday89142234105317715.gif

    2012
    compday89142234105317715.gif

    Most obvious are the "neutral warm" ENSO regions, with ENSO4 a bit more intense than the rest. Also worth pointing out is the well defined warm AMO area, to support Atlantic ridging and hopefully some heat fluxes. :D And the "warm cored" cold PDO area (as funny as it may sound).

    The AO and NAO have been responsive to all that. AO has gone up lately and you probably all know why, so i wont waste your time with that.
    cdasaonaodaily.png

    Last but not least, QBO.

    2011
    compday89142234105317830.gif

    2012
    compday89142234105317822.gif

    As usual, QBO propagated downward. Lost a bit of its intensity, but still in the game, at least in my eyes.

    I will end with my opinion/idea (not really a forecast) on how I see Polar Vortex activity in the near future.

    As mentioned above, Polar Vortex (at least the stratospheric part) is going to intensify a bit. What I find interesting, is the activity in the upper troposphere/lower stratosphere. Feel free to correct me, if I am wrong in any segment.

    The main trough, associated with the PV center, is going to move from N America, over Greenland into Atlantic. This corresponds with my December 500mb anomaly analog, I posted on some local forums (in our country) as a part of my statistical "model" winter outlook (Maybe i will also post the results on this forum, somewhere down the line). :)

    pv.gif

    wk1wk220121111z500.gif

    Now what I find interesting, is what is going on behind the PV center. The Aleutian and Scandinavian ridge are really going on a offensive towards the north pole, rising the geopotential heights. Polar vortex gets really "oval" shaped from all the offensive from the side, and getting the "split up" features in mid and upper troposphere.

    ecmepsz500aarctic11.png

    ecmwf50f240.gif

    AO responding.
    ecmepsmslpaarctic11.png

    aosprd2.gif

    There are still no real signs of impending SSW just yet, but I do believe they will (and should) start to appear as we move into December. But it sure is interesting to see the PV taking a bit of a punch, which will be interesting to see how it evolves down the line.

    I hope I am not breaking any rules with posting so many images, or making such a long post. I just thought it would be a nice "intro post" on this whole stratospheric matter.

    Best regards,

    Andrew.


  • Registered Users, Registered Users 2 Posts: 245 ✭✭Blizzard 2010


    Real good stuff there very technical.:pac:


  • Registered Users, Registered Users 2 Posts: 1 captdallas2


    Redsunset wrote: »
    Nothing too exciting to report as of yet.
    I'll also just pop on here the Zonal winds graphs.


    fluxes.gif

    Interesting subject. Do you have a any idea if there is an index or some estimate of the average heat loss for SSW events? I know they are complex and the accuracy would be limited, but since there was a lull in NH SSWs during the 90s and increase following the 98 El Nino, it would be interesting to estimate that impact on NH average temperatures.

    Thanks


  • Closed Accounts Posts: 2,693 ✭✭✭Redsunset


    I haven't time but you can check for yourself by using past Strat temps.

    http://www.cpc.ncep.noaa.gov/products/stratosphere/temperature/


  • Advertisement
  • Registered Users, Registered Users 2 Posts: 39 Capillatus


    ...but since there was a lull in NH SSWs during the 90s and increase following the 98 El Nino, it would be interesting to estimate that impact on NH average temperatures.

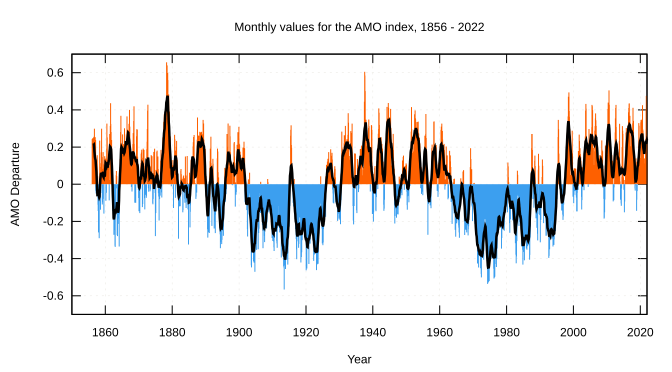
    Well, I have seen some papers linking the numbers of SSW events with the AMO. Warm AMO is allegedly more favorable or supportive for SSW events, probably due to the support for high latitude blocking and heat fluxes.

    672px-Amo_timeseries_1856-present.svg.png

    Here are decadal composites for 30mb temperature anomaly in the Dec-Feb period (yes I love the reanalysis tools, simply because it is so practical and can really help you understand certain things ).
    I will start with 1980, because that's when accurate satellite observations began and of course data older than that is unreliable. Keep in mind that these graphics are composites or "blends" of 10 years. So there is high variance within this average. But just so you get the feel of the overall thing. I will also add QBO and Heat flux blends.

    1980-1990
    89142110137322151511.png

    1990-2000
    89142110137322151649.png

    2000-2010
    89142110137322151733.png

    There is a real feeling of transition between these periods. First you have the cool polar stratosphere and warmth around, then you have cool stratosphere and kinda neutral around, basically cooling when compared to previous period. And then you have the latest period, which kinda continues the cooling of the stratosphere, but warms the polar stratosphere, mainly because of the increased number of SSW events. And I have to point out that all this is with respect to the 81-10 climatology, so given the extent of the reanalysis period (80-10), slight appearance of transition is expected. But it is still interesting. Besides the Earth/Atmosphere/Ocean factors, there are also other factors involved. Maybe solar output?

    The activity does seem a bit stronger in the 80's and the 90's, with two nice maximums on the decade transition. We had a lower maximum in the 00's transition, and basically one big minimum throughout the whole decade (this chart only goes till 2005). Predictions are slowly taking us into a new "Maunder minimum" on the longer range (something that snowlovers can be glad to hear lol)
    I am not jumping to any conclusions here, but just trying to take more things into consideration (maybe I should also check volcano activity), with my thoughts on the whole strat./trop. matter. And I think we all realize how complex the weather really is. With all the big and small factors affecting it.
    solar-cycle-19-23.gif

    Next up is QBO. The reanalysis period is written on the chart. Left is the height in mb scale.

    89142110137322151922.png

    89142110137322151944.png

    8914211013732215202.png

    I would almost expect a bigger contrast between 80-90 and 00-10, but the real contrast is between 90-00 and 00-10. Overall positive QBO phase in the 90s, which is less supportive for SSWs than the negative phase that was present in the last decade. At this point it would be interesting to read some papers and studies on what affects the QBO phases. There is negative and positive variance with each year, but these composites are just the blend of all years, to give the feeling of the overall "tendencies".

    Last but not least, heat flux.

    89142110137322152441.png

    8914211013732215253.png

    8914211013732215323.png

    Not really sure how to comment on this one, but there is a positive heat flux anomaly in the Atlantic in the last decade, most likely linked to the warm AMO cycle, which links on to the processes and factors involved with SSW events.

    I will finish off with the 500mb pattern composite for each decade.

    89142110137322155631.png

    89142110137322155654.png

    89142110137322155711.png

    As I said, AMO looks to be supportive for high latitude blocking, and negative NAO. But lets keep in mind, that this period had more SSW events, which also reflect down on the troposphere pattern. So it would be interesting to make further studies on the overall AMO-SSW "linkage".

    I also have to add that in the 80's and the 90's, we were in a warm PDO cycle, which can be noticed on the heat flux reanalysis to some extent. The PDO began to shift down into the negative phase with the double La Nina in 99/00 and later into the mid 00's. And looking overall we were in a transition from a warm to cold PDO phase in the last decade. And right now, we are in the beginning of a cold PDO cycle. I am just trying to say here, that there is more going on in the big picture than just the AMO and PDO. And at this point, I could start talking about how Al Gore is using the natural cycles to make dirty profits, but I guess that would be off topic. :)

    Again, another long post, but its basically the only way I can express my thoughts. And all above is nothing more and nothing less than just some of my thoughts.

    Best regards.


  • Closed Accounts Posts: 2,693 ✭✭✭Redsunset


    I've taken the following info from an Italian website and it helps to explain in particular the Brewer Dobson Circulation. Talks about the QBO and solar influence on Strat. Please pardon some translation errors.


    SOLAR ACTIVITY and QBO

    With regard to solar activity, the situation is quite poised and therefore difficult to interpret. We know that the activity of our star, despite being "near" the phase of maximum, remains relatively low values, with the solar flux that oscillates almost periodically for months between 100 and 140. In an attempt to better frame the "sunshine state", let us understand some of the mechanisms by which solar activity affects the Earth's atmospheric circulation, referring to the top of world research (Durkenton, Hood, Labitzke, Salby and Callaghan etc. .. ). direction and intensity of equatorial stratospheric winds tropo-play a key role in the modulation of the Polar Vortex winter (VP), and therefore the climate at mid-latitudes. 

    Direct evidence of this comes from Quasi Biennial Oscillation (QBO), which corresponds precisely to a periodic oscillation of the stratospheric winds in the tropics: the evolution of these winds, as is well known, is one of the leading "regulators" intensity of the VP. Now, without going into too much detail (return to talk about these interesting topics in a more appropriate location), in the last few years has been identified a mechanism by which solar activity can influence the performance and strength of the equatorial stratospheric winds , thus interfering heavily on the strength of the VP. This mechanism is based on the variation of the emission of ultraviolet rays between maximum and minimum solar and its interaction with the production cycle of stratospheric ozone. In this regard it is necessary to clarify beforehand two fundamental concepts:

     1) in relation to solar radiation, the only village that varies "heavily" between maximum and minimum solar ultraviolet light (also 7.6 percentage points), while all other fractions tend to vary significantly lower quantities of (the TSI in the cycles of the twentieth century to more than 0.1%). 

    Raggi-UV-cicli-22-e-23.png

    This figure shows the emission intensity of ultraviolet (UV) during cycle 22 and 23. As can be seen, between maximum and minimum solar, there are significant variations (of the order of 6%).This fact led major research centers worldwide to focus on ultraviolet radiation to explain the very short-term climate change that occur in the northern hemisphere over the years characterized by low solar activity (as happened in recent years);

     2) most of the ozone production occurs in tropical stratosphere, where it is stronger and is always present solar radiation. Ozone is created in this region as it is here that the sun, this all day and throughout the year, it is more intense flows solar (UV) break oxygen molecules (O2) into oxygen atoms (O), which react rapidly with other O2 molecules to form ozone (O3). All these reactions are highly exothermic, leading to radiative heating of the high tropical stratosphere, where there is the main area of training ' ozone. The main consequence of the radiative heating the thermal gradient is positive with increasing height (in contrast to what occurs in the troposphere), and therefore an increase in the stability of the stratosphere same. Ultimately, the reduction of the amount of ultraviolet radiation that occurs in the years of low solar activity, is due to a reduction in radiative heating: this makes the stratosphere colder and unstable (it reduces the thermal gradient positive with increasing height). 

    This fact, by binding with the thermal wind, produces a weakening of the zonal wind (U) in the mesosphere-stratosphere high tropical going to interact with the westerly regime of the SAO (semi-annual wind oscillation), which precisely in the months in which form the stratospheric polar vortex reaches its maximum value (October-November). The abnormal weakening of the SAO is very important for the following reasons: • it was noted that the weakening of the zonal stratospheric winds in 'high tropical stratosphere is associated with a weakening of the zonal wind within the Stratospheric Polar Vortex (VPS), particularly during the period in which they recorded their maximum (solstice ' winter) . In other words it has been observed that statistically, when the zonal wind in the mesosphere / high tropical stratosphere are less intense, the VPS tends to be weaker in the first part of the winter;• there is a relationship between the regime of the SAO and the QBO. Specifically, in the years of QBO negative, the weakening of the SAO produces, over the entire column stratospheric, twenty easterly of greater intensity (absolute value of the QBO higher) with a consequent increase in the duration of the phase. 

    It is no coincidence that all the episodes of QBO strongly negative (values ​​below -23/-24) were recorded only in the years of low solar activity. these circumstances (increased intensity and duration) are essential given the importance that covers the QBO negative action of disturbance to the detriment of future Stratospheric Polar Vortex. In this regard it should be noted that when the wind regime is stratospheric tropical eastern tropical easterlies tend to restrict the width of the planetary wave-guide in the extratropical lower stratosphere, favoring a larger amplitude wave and a lower phase velocity.The result is an increase in wave propagation in the stratosphere, thus heating and slowing down the VPS.discovery of these dynamics, although constitutes a major step forward in the understanding of the phenomena of "transmission" of the solar signal, does not yet allow to explain fully the real mechanism of coupling between the high stratosphere tropical lower stratosphere-troposphere tropical and polar stratosphere.

     It is no coincidence that the simulation models ("GCM simulations"), while showing consistent results with theoretical predictions, are still substantial differences with the experimental measurements. This suggests that there are additional retroactive phenomena can strongly amplify the response of the atmosphere with respect to the primary signal "photochemical" Variable-induced solar, thus playing an important role in coupling: one of these is definitely the Brewer-Dobson circolation (BDC).

     In the past we have already had occasion to speak of this "fascinating" meridian circulation. Briefly recall that the BDC, so named for its discoverers Brewer and Dobson, is a slow circulation in the stratosphere and hemispheric agent arranged along the meridians. This circulation is responsible for the movement of air particles from equatorial regions up to the polar regions and is most active in the northern hemisphere. In particular, this movement is characterized by ascending motions in the equatorial regions and descending motions in extratropical areas (especially in the northern hemisphere polar). The action of the BDC produces some basic effects: • thanks to the vertical transport of chemical species and southern, mainly including ozone, BDC greatly influences the chemistry of the polar bear.transport of ozone to the north pole ricompre, including other things, a great importance for the fate of the second half of winter (mid-January onwards), since, with the arrival on the pole of the first solar radiation, ozone absorbs most of the solar ultraviolet radiation and the returns in the form of heat, favoring the development of phenomena of stratwarming and making the VPS weaker;  • the vertical motions associated with the BDC have important consequences for the distribution of temperatures in the stratosphere. 

    Indeed, due to the action of the BDC, the tropical tropopause is the coldest region in the troposphere and stratosphere. This is because the air in the tropics lifts cools to adiabatic expansion, bringing the temperatures of the tropical lower stratosphere well below the equilibrium temperature radiative local. In this regard, since the BDC is stronger during the northern winter, the strength of the air lift (upwelling) in the tropics, and then the low temperature of the tropopause trope-equatorial, presents an annual cycle, with values ​​records during the 'northern winter. 

    On the contrary, in the polar region, the descending air is heated by adiabatic compression, bringing the temperatures in the stratosphere polar to several tens of degrees above the local radiative equilibrium. The latter circumstance favors the heating and greater "instability" of the stratosphere polar also in the early stages of winter

    schema-BDC.png

     Figure constitutes a schematization of the BDC. diagram of operation of the BDC is quite complex. 

    In the first analysis we might expect a mechanism type Hadley cell, in which the circulation originates from the tropics solar heating and cooling in the polar region and is characterized by a large transport of warm air ascending (tropical) towards the colder regions (where the air goes down). 

    Actually BDC been closely related to the action of planetary waves (Rossby waves) in the extratropical stratosphere. Indeed, when stationary planetary wave reaches the stratosphere, deposits its time Esterly, decelerating the jet stream which is westerly stratospheric winter. On these occasions the polar vortex slows down and can also be moved. The deposition of momentum in the east polar stratosphere and the resulting slowdown in the winter polar jet is known as "breaking wave". This condition produces friction the stratospheric sudden warming phenomenon. The result is a situation that is thermodynamically unbalanced.

     At this point, to restore the balance radiative, starting from high stratosphere quickly starts a process of cooling. The cooling air is accompanied by movements within, as the cooler air is denser and sinks. And it is precisely this movement that determines the movement of air along the meridian from the equator to the pole hemisphere winter . In fact the air descending in the polar region must be balanced by a flow of air towards the moving toward the poles. Requirements for earth continuity, this air must come from the tropics. The BDC is therefore that cell movement in which the tropical air moves towards the poles to replace air descending to the poles.

    Now that we have more clearly one of the key mechanisms of solar activity, along with the QBO modulates the intensity of the polar jet, we are certainly capable of better managing the current situation. Indeed, we understand that, to be able to decipher ' current "solar puzzle", the parameter that should be monitored with particular attention to the intensity of ultraviolet radiation arriving on earth. To do this we consider the flows at wavelengths equal to 205 nm, as are those which can penetrate up to an altitude of 30 km, or up to the border area between the mesosphere and the high stratosphere tropical (this is the altitude where there is maximum production of ozone). 

    Below is a graph then from which you can infer the performance of UV rays on the last year: To be able to "quantify" the intensity of the current flow, we use as comparing the performance of UV rays recorded during the solar minimum in between cycles 22 and 23 (1995-1996): As you can see we are practically at the same level, so we can say with reasonable confidence that the current situation may be considered more from minimum to solar maximum.Responding to this trend of UV rays, the QBO is clocking negative values ​​of respect. Specifically, in reference to the proportion of 30 hPa, for two consecutive months (July and August) was marked by an almost record (-28), while in the next phase (September-October), despite the passing of the peak, the QBO remained still at very low levels (around -25). E 'likely that the current cycle of the QBO negative is particularly long. In fact, in reference to the amount of 30 hPa, if the change of sign you will have in February (as one might expect), the current cycle will be composed of no less than 18 consecutive months of easterly regime (QBO-). As regards instead the QBO to share 50hPa, what is practically certain that the change of sign will occur to winter completed. So we can conclude that, even as regards the QBO, the situation in view of the winter is decidedly positive. 

    Finally, Always with reference to the QBO, we wanted to make you note that the current situation is very similar to the one it had in the period 1984-1985. Even at that moment the QBO in 30hpa did mark a significant peak (still -28) at the end of the summer (in that case in September).Obviously we can not use this information as an indication of the progress of the coming winter, but surely it is a "coincidence" to watch, especially considering that in that period the solar activity appeared weak.    

    Raggi-UV-2011-2012.png

    Raggi-UV-1995-1996.png


  • Registered Users, Registered Users 2 Posts: 545 ✭✭✭weatherfiend


    Bloody hell!! Eh just thanks


  • Registered Users, Registered Users 2 Posts: 566 ✭✭✭Wine Goddess


    Just came into thread and WOW!

    Thanks guys for such extensive learned and frankly in some parts baffling!!! posts.

    Brilliant to have you on the forum.:)


  • Registered Users, Registered Users 2 Posts: 39 Capillatus


    Thank you @Redsunset for the translation. I will try to find time to study that text, because I only read a few lines and it seems really interesting. :)

    If I can touch the P.V. a little bit.
    I think we all noticed the tropospheric split-up starting to appear, with its effect reaching quite far up.

    ecmwf30f240.gif

    Easterlies starting to appear, most likely as a result of all the ridging into the polar circle and displacement of lows. Notice how the ensembles have a mean 300+ anomaly on a 10-day range. That is indicative of a fair agreement of the models.

    ecmwfzmuf168.gif

    ecmepsz500aarctic11-1.png

    Down the road, it looks like only the right vorticity will "survive" the split and the Polar vortex will reform. And I know this is quite far out, but this image still runs my imagination. Or that's just me. :)

    nhhgt30mb384.gif

    Things starting to shape up.

    Best regards.


  • Advertisement
  • Moderators, Science, Health & Environment Moderators Posts: 7,147 Mod ✭✭✭✭pistolpetes11


    Possible Stratospheric Demolition & Final Winter Thoughts…

    27
    NOV
    With just a few days of autumn left and an autumn which has produce quite a few extremes, the attention now turns towards winter. I’ll add at this junction that (time willing) I’ll produce a blog looking specifically at December in the next few days. In this blog I wanted to directly focus my attention and information on the state of the stratosphere as we now enter into winter.

    Many may well have heard of the ‘stratosphere’ in recent months and also within the last year or so as this particular ‘variable’ has been given more and more scientific attention. Some people believe that the stratospheric conditions aren’t the be all and end all when it comes to affecting the weather across the UK during the winter and in a way they are correct. There are a large number of variables which come in to play, but equally I can disagree and argue that comment with substantial evidence, of which I have acknowledged myself over the last few years. Without question, the conditions of the stratosphere do affect the weather across the UK and the northern hemisphere during the winter and early spring period.

    In one of my previous blogs, which explains the two primary different states of the stratosphere (http://matthugo.wordpress.com/2012/10/01/stratospheric-conditions-winter-weather-analysis-information/) I give a perfect example of how the stratosphere can directly affect the weather within the troposphere and a perfect example of that was last December. Now without going over those details, I wanted to take a look at the state of the stratosphere up to present day and what is forecast to happen in the coming days;

    Initially, through this autumn, the stratosphere has cooled (as it should) at quite a significant rate to say the least and generally this progression would often lead to a pattern as evident last December. However, for a number of factors, including the likes of the QBO (Quasi-biennial Oscillation) these particularly potent stratospheric conditions haven’t been able to filter down into the troposphere this autumn and are now highly unlikely to do so. The rapid drop in temperatures across the polar stratospheric region can be seen on the below 2 images;
    polar-temps.gif

    30mb9065.gif


    As can be clearly seen on the first image in particular the temperatures have now dropped below -80C which is pretty much as low as they can go. Within the second image you can see that at this time last year the temperatures were very similar, but perhaps slightly warmer. However, there are clear differences, of which I highlighted earlier, this year the stratospheric conditions have been unable to penetrate down into the troposphere and aid the development of a significant polar vortex (http://en.wikipedia.org/wiki/Polar_vortex). To give an example of what the stratospheric vortex looks like at the moment, the below image shows this;

    ecmwf30a12.gif

    What this image is essentially showing is the temperatures within the stratosphere and also the overall ‘shape’ of the stratospheric vortex. At the moment, whilst rather elongated, it remains a noteworthy feature and as can be seen within the bottom left of the image the lowest temperature on that chart is -83c (82.5N 2.5W) essentially near the center of the vortex over the polar region.

    So what is expected in the coming 7 to 14 days to change this setup?…

    Well, without going into the details too much, of which even I am still attempting to get a grasp of, the stratospheric vortex through the winter period can often be at risk of under-going ‘attacks’ from various sources. These ‘attacks’ help to distort and weaken the vortex and the so-called “holy grail” can be a complete split and relocation of the vortex as well, you may have heard of an SSW (Sudden Stratospheric Warming) event. At this point don’t forget that a highly disorganised stratospheric vortex has been found (time after time) to aid in the development of northern latitude blocking and a heightened risk of colder weather across the UK and other areas of the northern hemisphere during the winter period than if the vortex is well organised.

    So a few more charts of interest;
    1)
    ecmwf30f192.gif


    2)
    ecmwfzm_u_f216.gif


    3)
    temps.gif


    1) The first image clearly shows a very different vortex within the next 7 or 8 days compared with the actual vortex of present day. The vortex, as can be seen, has split and of significance is the major warming event taking place over Eastern Russian in association with a major region of higher pressure across Alaska and far eastern areas of Russia. This is represented by the lighter blue colours and also the patch of pale yellow colour of which represents temperatures of -50C or above. This may still seem cold but clearly compare that to temperatures of below -80C and that is a marked area of warming.

    2) The second image shows the zonal wind speeds (m/s) up through the troposphere and more specific the stratosphere in relation to latitude. Of significance here is the negative (blue) colours and contours above 70N across the right of the image. This highlights a progression towards a highly disorganised and weak stratospheric vortex.

    3) Finally the bottom image and more importantly the top 3 graphs show how the temperatures are forecast to rise into early December compared with at present to either near or even above average. Of significance, don’t forget that a warmer stratospheric vortex essentially equates to a weaker vortex and a greater likelihood of potential blocking (higher pressure) within the troposphere.

    In conclusion;

    Gathering the above information and more together the situation through this autumn has been quite unique. The behavior of the vortex would (more often than not) have led to a likely period of zonal conditions across the UK as the autumn progressed, but clearly this hasn’t happened. Despite the highly organised and very cold stratospheric vortex there are now a variety of variables which are forecast to “attack” the vortex within the next 7 to 14 days of which, if successful, may actually demolition the vortex almost completely. For this to happen at this time of year would (combined with other factors) lead to a heightened risk of more meridional and blocking conditions developing.

    So, and finally, combining this data and with other information I believe that the winter across the UK between December and February will end up being colder than average with a greater frequency of blocking patterns leading to cold outbreaks. Clearly details are not possible, but particularly as we progress through the second half of December and also particularly into January if the stratosphere fails to recover from this potential “attack” then I wouldn’t be surprised to see at least one major and noteworthy cold outbreak across the UK.

    It’s all to play for, but I certainly feel that compared with last winter, the coming winter will be markedly colder for the UK.

    Time will tell as ever in meteorology and I look forward to looking back on this particular blog come next March to contrast and compare.

    Regards to all,

    M.


    http://matthugo.wordpress.com/2012/11/27/possible-stratospheric-demolition-final-winter-thoughts/


  • Banned (with Prison Access) Posts: 25,234 ✭✭✭✭Sponge Bob


    On a related note, if the vortex splits what will this do for the Thermohaline.

    http://arctic-news.blogspot.ie/2012/09/changes-to-polar-vortex-affect-mile-deep-ocean-circulation-patterns.html
    “In a region south of Greenland, which is called the downwelling region, water can get cold and salty enough – and thus dense enough – so the water starts sinking.”

    And it comes back to the surface a long time later as the Gulf Stream. But we already know that. This is the interesting bit.
    Scientists already knew that events in the stratosphere, 6 miles to 30 miles above Earth, affect what happens below in the troposphere, the part of the atmosphere from Earth’s surface up to 6 miles or about 32,800 feet. Weather occurs in the troposphere.

    “It is not new that the stratosphere impacts the troposphere,” says Reichler, an associate professor of atmospheric sciences at the University of Utah. “It also is not new that the troposphere impacts the ocean. But now we actually demonstrated an entire link between the stratosphere, the troposphere and the ocean.”

    So far so interestinng. However the centres of the new vortices resulting from a split are themselves of interest. Normally one develops in Eastern Siberia ...but what about the second vortex??
    “Stratospheric sudden warming” events occur when temperatures rise and 80-mph “polar vortex” winds encircling the Artic suddenly weaken or even change direction. These winds extend from 15 miles elevation in the stratosphere up beyond the top of the stratosphere at 30 miles. The changes last for up to 60 days, allowing time for their effects to propagate down through the atmosphere to the ocean.

    Thats a new one, the thermohaline circulation under a vortex aligns itself over a period of weeks.
    In a region south of Greenland, which is called the downwelling region, water can get cold and salty enough – and thus dense enough – so the water starts sinking.”

    It is Earth’s most important region of seawater downwelling, he adds. That sinking of cold, salty water “drives the three-dimensional oceanic conveyor belt circulation. What happens in the Atlantic also affects the other oceans.”

    So in a nutshell a split vortex with a sub vortex positioned over/south of Greenland for an extended period may have an effect on the cold water that is supposed to sink in that region and chug off south at slow speeds. And that, in time, would affect the Gulf Stream ...these are very slow cold currents mind.

    Artci Sea Ice has recovered pretty well in the area around Greenland ( not as well elsewhere) and is not as far below its long term average as it was 6 weeks ago.


  • Registered Users, Registered Users 2 Posts: 85 ✭✭maw368


    Su Campu, you mention the lack of SSW as a sign of no serious cold or snowy conditions in the near future. I am curious about the SSW. This is a topic that I hear a lot of people discuss lately and some make out that this is the MAIN thing needed for a good cold and snowy UK.

    But isn't the theory of SSW and the cold and snow a recent thoery that was only coined to attempt to explain the 2010 winter? Which considering not many winters have passed since, is this theory scientific in the respect that it has been tested and observed with repeated success? Obviously not if my assumptions about it being a new thoery is right. So what is the basis for your strong belief in the need for a SSW?

    Also, has there been a period of significant snow and cold in the UK without an SSW? I am not even sure if we can look at past winters and see if there was an SSW at the time or prior to the winters if 1962/3 just to name a bad winter.

    I do not know much about this so please excuse any errors that I may have made. If there is errors in my thoughts, I think some of my questions can be ignored but one still stands... Has there been significant winters with severe cold and snow in the past without an SSW event? I understand there is a perception issue with severe cold and snow. I am happy to have snow and cold that I have experienced many times in my 27 years here but I am not sure if you could define these winters as severe. So for clarification, I am talking about 2010 type winters.


  • Registered Users, Registered Users 2 Posts: 85 ✭✭maw368


    I am querying because as I said it has become in the eyes of many/most of a good cold and or snowy spell. The MO have now declared a minor warming of the Stratosphere and I wondered about the confidence in such events. But, let's consider it is right for a moment; I am struggling with the lack of definition, the MO states a minor warming. What does a minor warming mean for us? minor warming creates minor cooling or significant cooling?

    Or if a minor warming only leads to minor changes for us, does a minor warming point to any trends or does it fluctuate all the time and this warming could be insignificant. Sorry for the mass of questions but I do not know much about SSW and when reading some materials it is jargon full and not laymen friendly.


  • Closed Accounts Posts: 304 ✭✭Jaffusmaximus


    maw368 wrote: »
    I am querying because as I said it has become in the eyes of many/most of a good cold and or snowy spell. The MO have now declared a minor warming of the Stratosphere and I wondered about the confidence in such events. But, let's consider it is right for a moment; I am struggling with the lack of definition, the MO states a minor warming. What does a minor warming mean for us? minor warming creates minor cooling or significant cooling?

    Or if a minor warming only leads to minor changes for us, does a minor warming point to any trends or does it fluctuate all the time and this warming could be insignificant. Sorry for the mass of questions but I do not know much about SSW and when reading some materials it is jargon full and not laymen friendly.

    https://docs.google.com/viewer?a=v&q=cache:LzADa6vkshAJ:meetings.copernicus.org/www.cosis.net/abstracts/EGU06/01411/EGU06-J-01411.pdf+&hl=en&gl=ie&pid=bl&srcid=ADGEESibgu0VkU9AAt0C7DQie7AStRxLFxKHbrOz6Bt4R94JXAvhLuilu44uSd-EQMZNdH8ELOxec5UMhHQVnSWnqEaFi02mUIDK4eHDPTD1ELKcLB5AGknpc18UOKwVOXaJCswefM_T&sig=AHIEtbTqdLH67uHIVtvQNIt8FhMfW4R0Hg

    • a major SSW is identified when the warming is significantly greater than 10 Kand the mean zonal wind reverses from westerly to easterly through the polarregion (at 60˚N)
    • a minor SSW is obtained when the warming is significantly greater than 10 Kbut there is no reversal of the mean zonal wind in the polar region.


  • Moderators, Science, Health & Environment Moderators Posts: 7,147 Mod ✭✭✭✭pistolpetes11


    Going to firstly post an update from the met office about the Stratosphere :

    During a period of colder than average weather across northern Europe in February this year we issued a blog discussing potential causes – including changes in circulation high up in the atmosphere.

    We also discussed these disruptions, known as Sudden Stratospheric Warmings (SSWs), in a news release about advances in predicting these events in our long-range guidance for winters.

    SSWs happen when the usual westerly winds in the stratosphere, between 10km and 50km up, are disrupted, break down and even reverse.

    This signal can then burrow down to the lower atmosphere over the course of a few days to a few weeks, thereby reducing the westerly winds at lower levels.


    Figure illustrates how reversal of winds in the stratosphere ‘burrows’ down to surface level.
    For the UK in winter, that means a disruption to the westerly flow that usually brings mild air from the Atlantic and there is a potential to allow easterly winds to take hold, bringing in cold air from the continent.

    So SSWs can herald cold weather ahead. However, there are variations in their magnitude – sometimes they are fairly minor, just a ‘wobble’ in the flow of the stratospheric winds, but sometimes they are more pronounced, with a complete reversal of the pattern of winds.

    The more significant the SSW, the more likely it is to have an impact at the surface and also the greater the potential impact.

    Met Office observation systems have picked up a minor SSW in the stratosphere over the past few days, suggesting that this may have an impact on the UK.

    Jeff Knight, a Climate Scientist at the Met Office, said: “Satellite and other observation data show that there is a minor SSW going on and this is one factor amongst many others which could perpetuate the colder than average conditions we have seen recently.

    “It could take anything from a few days to a few weeks if it is going to have an impact. However, it’s consistent with the current 30-day outlook from the Met Office which favours colder than average conditions – albeit with a fair amount of uncertainty.”

    The Met Office will continue to monitor the situation and, as ever, will keep everyone up to date on any periods of cold weather through our forecasts and warnings

    231419.png


  • Moderators, Science, Health & Environment Moderators Posts: 7,147 Mod ✭✭✭✭pistolpetes11


    http://forum.netweather.tv/topic/74587-stratosphere-temperature-watch-20122013/page__st__920#entry2429079

    Just a little update with the current stratosphere state.

    Looking at the mid stratosphere - 30 hPa we can see the warming that has been mentioned on the metoffice site:

    231420.png

    I don't know how higher this is likely to reach - but it certainly is a change around from the earlier autumnal cold strat. All areas below 30hPa are now above average - though this has not reached 10 hPa.


    I remember saying early in November that I thought that the start of December would have a positive AO unless we saw some increased wave activity. Well didn't we just!

    231421.png

    The increase in the wave 2 amplitude has been critical in delivering the current pattern. And the increase in wave 1 amplitude will hopefully help deliver the displacement of the vortex to the Canadian sector which assists in the NE height rises

    231423.png

    So critically how has this affected the mean zonal winds in the stratosphere? It is these that have the strong influence over the tropospheric mean zonal winds.

    Well as we can see from 10 hpa downwards these are now running well below average and will probably take some time to recover.

    231424.png
    231425.png

    (I will put the last chart on the next post ) PP

    All good news for the rest of the month.


  • Moderators, Science, Health & Environment Moderators Posts: 7,147 Mod ✭✭✭✭pistolpetes11


    Last Chart from the post above

    231427.png


  • Closed Accounts Posts: 304 ✭✭Jaffusmaximus


    Hi pistolpete would u have a link to up to date info on those charts so I can keep an eye on it the next few days. I have a strong feeling that if temps keep rising it will be the stabilizers on any cold outbreak that may occur!


  • Moderators, Science, Health & Environment Moderators Posts: 7,147 Mod ✭✭✭✭pistolpetes11


    Hi pistolpete would u have a link to up to date info on those charts so I can keep an eye on it the next few days. I have a strong feeling that if temps keep rising it will be the stabilizers on any cold outbreak that may occur!

    http://acdb-ext.gsfc.nasa.gov/


  • Advertisement
  • Registered Users, Registered Users 2 Posts: 1,135 ✭✭✭compsys


    Hi pistolpete would u have a link to up to date info on those charts so I can keep an eye on it the next few days. I have a strong feeling that if temps keep rising it will be the stabilizers on any cold outbreak that may occur!

    I could be wrong but I think strat warming actually increases the liklihood of a cold outbreak. In other words it's not going to put the stabilisers on any cold outbreak.


  • Closed Accounts Posts: 304 ✭✭Jaffusmaximus


    compsys wrote: »
    I could be wrong but I think strat warming actually increases the liklihood of a cold outbreak. In other words it's not going to put the stabilisers on any cold outbreak.

    Oh what I meant is it could help keep any potential cold in place if it weakens the westerly flow from the Atlantic thus stabilizing the cold from being pushed back East.


  • Registered Users, Registered Users 2 Posts: 1,997 ✭✭✭BLIZZARD7


    http://wekuw.met.fu-berlin.de/~Aktuell/strat-www/wdiag/ts.php

    We can see the warming is forecast to continue before dropping below average again, hopefully we will see more warmings or wave activity over the next few weeks. I notice the last few ECM/GFS runs have started showing a polar vortex movement from canada to siberia in FI, this could help us get height rises over greenland later in the month/start of January.


    Dan :)


  • Closed Accounts Posts: 2,693 ✭✭✭Redsunset


    maw368 wrote: »
    I am not even sure if we can look at past winters and see if there was an SSW at the time or prior to the winters if 1962/3 just to name a bad winter.

    All info you need has been posted before.
    For example here's one I posted nearly 3 years ago (wow time flies) to answer your question.

    http://www.boards.ie/vbulletin/showpost.php?p=64259161&postcount=22

    Follow links posted and you will find previous threads with lots of info.


  • Moderators, Science, Health & Environment Moderators Posts: 7,147 Mod ✭✭✭✭pistolpetes11


    NW Link

    06z GFS .... best strat forecast of the winter, admittedly at the very extended range but it demonstrates the evolution of the cut off lobe which is now reliably being modelled, as is the shift of the main body towards Siberian sector.

    70 hPa post-2478-0-61205700-1354793105_thumb.jpgpost-2478-0-33028700-1354793122_thumb.jpg

    30 hPa post-2478-0-79866000-1354793090_thumb.jpg post-2478-0-04025900-1354793075_thumb.jpg

    10 hPa post-2478-0-20887100-1354793044_thumb.jpg post-2478-0-90180000-1354793058_thumb.jpg

    A very displaced vortex and we have a full on Canadian warming forecast there, which could very conceivably shift northward into the Pole and trigger a MMW. Based on this GFS output, MMW centred late December, tropospheric feedback mid jan with a possible earlier fast response similar to what we've seen in the last 2-3 weeks.

    This is the GFS we're talking about, and there has been a great deal of uncertainty in these outputs w/r/t the eastward development of the warm pool in the middle and lower stratosphere, but the building blocks being put in place around the middle timeframe are worth keeping tabs on from run to run because this could be highly signifiacnt in terms of weather ramifications in January.


  • Closed Accounts Posts: 3,548 ✭✭✭Harps


    Not going to pretend I have a clue about the mechanisms behind all this but the stratosphere has been consistently projected to warm up dramatically over Russia in the last week of the month, worth keeping an eye on to see if it amounts to anything

    gfsnh-10-384_eam2.png


  • Registered Users, Registered Users 2 Posts: 39 Capillatus


    The most appropriate comment would be: "Are you ******g kidding me"? :) (pardon the expression)

    nhtmp10mb384.gif

    nhtmp5mb384.gif

    These charts are nothing short of amazing.

    And I guess that now we can really say (regardless of it being beyond 10 days), that things are starting to heat up (pun intended). :)

    Best regards.


  • Registered Users, Registered Users 2 Posts: 139 ✭✭JFKIRELAND


    Hi,
    Sorry for my ignorance, but what is a MMW?
    Thanks
    JK


  • Registered Users, Registered Users 2 Posts: 2,780 ✭✭✭Rougies


    JFKIRELAND wrote: »
    Hi,
    Sorry for my ignorance, but what is a MMW?
    Thanks
    JK

    Major Midwinter Warming... another term for a SSW as far as I know.


  • Advertisement
  • Registered Users, Registered Users 2 Posts: 39 Capillatus


    JFKIRELAND wrote: »
    Hi,
    Sorry for my ignorance, but what is a MMW?

    Major Midwinter Warming

    "A Stratospheric Major Midwinter Warming (MMW) is defined by a reversal of the temperature gradient (at the 10hPa level) between the North Pole and 60°N (i.e., polar region warmer ) – and by a reversal of the normal westerlies to easterlies (winds from the east), i.e. a negative AO."

    Edit: Rougies was faster. :/:)


  • Registered Users, Registered Users 2 Posts: 33 andrioolis


    hi guys,
    i was following these post for a while just trying to understand are we expecting something big to come around the Ireland in the dropping temperature meaning???? Baltic states are getting -25 for xmas... can we expect @ least -10 in coming January in Ireland???


  • Closed Accounts Posts: 1,745 ✭✭✭whitebriar


    andrioolis wrote: »
    hi guys,
    i was following these post for a while just trying to understand are we expecting something big to come around the Ireland in the dropping temperature meaning???? Baltic states are getting -25 for xmas... can we expect @ least -10 in coming January in Ireland???
    In simple terms,the warming could enhance Atlantic blocking meaning we import our weather from the Ne or East.
    But its by no means certain.


  • Closed Accounts Posts: 2,693 ✭✭✭Redsunset


    Bit of a ramp here but I think we're staring down the barrel of a loaded gun.

    Stratosphere wise things are beginning to heat up (pardon the pun).
    Lower Stratosphere conditions at 240hrs

    ecmwf100f240.gif

    Remember that Stratosphere modeling is far more reliable than tropospheric.

    Most of the troposphere vortex is around Siberian quarters and at 240hrs the current Ecm begins to show the makings of some blocking in the correct place as we near year end and welcome a new.

    ECH1-240_khe1.GIF[/IMG]

    There could be serious Stratosphere polar vortex displacement during January and so provided the set up is playing ball then we could be in the freezer sooner than we think.

    I'm away a lot lately so will try update when I get time. Perhaps the usual suspects could keep updating. Cheers.


  • Registered Users, Registered Users 2 Posts: 39 Capillatus


    While models always seem to show snow scenarios and then removing them or just keeping them in the future forever, the stratosphere is a different story. The general idea with the warming and the polar vortex disposition remains more all less the same, with minimal "away moving".

    The latest runs are basically already carving out the "R.I.P Polar Vortex" tombstone, or at least for its influence, hinting at a possible "official" SSW event around January 10th.

    strat.gif

    ECMWF is also picking up the warming in the mid and upper strat. and will possibly continue to do so as the "main events" move closer to the 240h time frame. And with the wave1 picking up the pace again throughout the whole 0-10 day timeframe, the vortex already began its displacement mode.

    strat10.gif

    waves.gif

    ecmwfzmha1f24.gif

    The forecasted sounding for the point where EC has Tmax at 10mb at 192h. You can see the the warm air intrusion fairly good in the mid and more the upper strat.

    sound.png

    With the High strengthening and putting more pressure on the Polar Vortex, along with the warm air intrusion, the wind forecasted beyond 300h, shows a zonal reversal over the pole.

    wind10f336-1.png

    So basically, quite a clash forming above our heads. :D

    wmag5f336.png

    It is too far away to start speculating on possible effects on the troposphere and the winter in Europe.

    I apologise for not posting here so often. I have noticed that many of you are keeping an eye on the netweather.tv SSW thread, so you can also find my posts there (@Recretos).

    Best regards.


  • Registered Users, Registered Users 2 Posts: 1,789 ✭✭✭BEASTERLY


    Thanks for the update, I've been keeping an eye on the Netweather some very good discussion going on. What would the usual time delay be for effects to start showing in the troposphere? Is the level of warming forecast unusual? Or would it be something seen during many winters?


  • Advertisement
  • Registered Users, Registered Users 2 Posts: 39 Capillatus


    Well, given the composite by Reichler, the "average" delay would be around 10-15 days from upper strat. down to the upper and mid troposphere. This is an average value, so I think there could be a 5 day deviation from this mean.

    baldwin_fig2.jpg

    About the warming, I would say that its not really off the scale. Its in the "normal" SSW values.

    I was playing around with the reanalysis tools and I made an analog of January 500mb anomaly with conditions: Dec/Jan 30mb CW (Canadian Warming) in an east QBO and a Polar vortex disposition in December. Basically something similar that we are going to go through now.

    ncl1091824516035114156tm.gif

    Its hard to say what exactly is going to happen in the troposphere if the warming comes to fruition with the current forecasted intensity and dynamics. We have to wait first for the charts that are now in the 300h+ range, to come under 192h, so we determine the exact type of the possible SSW and to start looking in the past for similar events, besides looking at the model feedback when it tries to pick up the downwelling into the troposphere. So lets give it some time first to see how it shapes up. :)

    Best regards.


  • Registered Users, Registered Users 2 Posts: 23 Luisport


    Hi everyone, this is my first post here! A portuguese forecaster say that we will see a polar vortex collapse in the first 10 days of January. What do you think about this? I don't understand nothing of it yet, so what could happen if this massive event take place? Thank you everyone for all this information posted here!


  • Closed Accounts Posts: 1,745 ✭✭✭whitebriar


    Luisport wrote: »
    Hi everyone, this is my first post here! A portuguese forecaster say that we will see a polar vortex collapse in the first 10 days of January. What do you think about this? I don't understand nothing of it yet, so what could happen if this massive event take place? Thank you everyone for all this information posted here!
    Depends on where it collapsed.
    Down into Canada or even Russia wouldn't be much use here.
    In 2010 it broke and fell down into the north sea and the rest as they say is history.
    That usually replaces behind with high pressure that if as can happen (and did in Nov Dec 2010) it links mid Atlantic with another high..then your winds turn north and north east advecting very icy air to us.

    Thats as layman as I can describe.

    That said,Portuguese man has no way of knowing what's to happen in chaos theory, so if right he's a lucky guesser.

    In this thread,we're discussing a possible warming of the upper atmosphere in polar regions that could cause another 2010 as described.
    Could but so many variables,we just don't know.
    These things have a nasty habit of bringing snow to Athens rather than Dublin mostly.

    Hope that helps


  • Registered Users, Registered Users 2 Posts: 23 Luisport


    whitebriar wrote: »
    Depends on where it collapsed.
    Down into Canada or even Russia wouldn't be much use here.
    In 2010 it broke and fell down into the north sea and the rest as they say is history.
    That usually replaces behind with high pressure that if as can happen (and did in Nov Dec 2010) it links mid Atlantic with another high..then your winds turn north and north east advecting very icy air to us.

    Thats as layman as I can describe.

    That said,Portuguese man has no way of knowing what's to happen in chaos theory, so if right he's a lucky guesser.

    In this thread,we're discussing a possible warming of the upper atmosphere in polar regions that could cause another 2010 as described.
    Could but so many variables,we just don't know.
    These things have a nasty habit of bringing snow to Athens rather than Dublin mostly.

    Hope that helps
    Thank you so much! I'm following this ia portuguese forum, here is the link: http://www.meteopt.com/forum/seguimento-meteorologico/seg-previsao-do-tempo-modelos-dezembro-2012-a-6836-17.html#post356341


  • Registered Users, Registered Users 2 Posts: 23 Luisport


    By the way, if a collapse happen, what can we expect, for how long and how fast it happen?


  • Advertisement
  • Closed Accounts Posts: 1,745 ✭✭✭whitebriar


    Luisport wrote: »
    By the way, if a collapse happen, what can we expect, for how long and how fast it happen?
    Bear in mind those Portuguese guys need different positions from everything for very rare(much rarer than us) cold to get to them
    Also the highs aligning the wrong way could actually mean warmer weather steering in southerlies-chaos theory is weather.

    Longest living memory cold snap arising out of a scandi high would be 1947 ie 6 to 8 weeks on and off.
    Longer than 2 weeks would be an unusual in an unusual.

    No idea on timing for what's discussed here.Going on mt craniums winter forecast,I'd guess near February alas if at all.


  • Registered Users, Registered Users 2 Posts: 23 Luisport


    whitebriar wrote: »
    Bear in mind those Portuguese guys need different positions from everything for very rare(much rarer than us) cold to get to them
    Also the highs aligning the wrong way could actually mean warmer weather steering in southerlies-chaos theory is weather.

    Longest living memory cold snap arising out of a scandi high would be 1947 ie 6 to 8 weeks on and off.
    Longer than 2 weeks would be an unusual in an unusual.

    No idea on timing for what's discussed here.Going on mt craniums winter forecast,I'd guess near February alas if at all.
    well i'm a bit more confused, but i think it's normal... so we can get more warmer with a polar vortex collapse? I thought the it will bring polar temp to lower latitudes.:confused::o


  • Registered Users, Registered Users 2 Posts: 23 Luisport


    How is the situation of polar vortex now? Any development? Thank's!


  • Closed Accounts Posts: 1,745 ✭✭✭whitebriar


    Luisport wrote: »
    How is the situation of polar vortex now? Any development? Thank's!
    Theres a good updated discussion on it over on netweather.tv


  • Closed Accounts Posts: 1,745 ✭✭✭whitebriar


  • Registered Users, Registered Users 2 Posts: 245 ✭✭Blizzard 2010


    Looks like we will have a SSW in the next forthnight, While nothing is gaurenteed hopefully we wont have another false dawn as we did earlier this month:)


  • Registered Users, Registered Users 2 Posts: 23 Luisport


    Sunday, December 30, 2012Significant Cold Ahead For January-February
    By Andrew at 11:58 AM
    http://theweathercentre.blogspot.de/2012/12/significant-cold-ahead-for-january.html


  • Registered Users, Registered Users 2 Posts: 23 Luisport


    And while on the topic of cold and snow, the GFS and ECMWF models show significant stratospheric warming across the North Pole and Canada towards the middle of January. With the NAO expected to fall rapidly at that time, and with the AO expected to rise rapidly at that time, it's about to get very cold for many across the United States. The split & temporary collapse of the polar vortex we've seen in recent years has been interesting.. Considering it tends to happen after solstice, one of these years it's not going to set back up for the rest of winter. http://www.wunderground.com/blog/JeffMasters/comment.html?entrynum=2319#yourcomment


  • Registered Users, Registered Users 2 Posts: 1,789 ✭✭✭BEASTERLY


    Looks like we will have a SSW in the next forthnight, While nothing is gaurenteed hopefully we wont have another false dawn as we did earlier this month:)

    SSW currently forecast for 6 days time, has been a consistent forecast for a while now.


  • Registered Users, Registered Users 2 Posts: 23 Luisport


    Posted 19 minutes ago

    Interesting to note the tropospheric polar vortex at d16 shifts from Siberia into Sapporo!

    Insane conditions over northern Japan !
    http://modeles.meteociel.fr/modeles/gfs/runs/2012123012/gfsnh-13-384.png?12 http://forum.netweather.tv/topic/74587-stratosphere-temperature-watch-20122013/page__st__1640


  • Advertisement
This discussion has been closed.
Advertisement