Advertisement
If you have a new account but are having problems posting or verifying your account, please email us on hello@boards.ie for help. Thanks :)
Hello all! Please ensure that you are posting a new thread or question in the appropriate forum. The Feedback forum is overwhelmed with questions that are having to be moved elsewhere. If you need help to verify your account contact hello@boards.ie

The sun is dead!! Mini iceage???

Options
1161719212232

Comments

  • Closed Accounts Posts: 4,559 ✭✭✭pedigree 6


    That's 8 days so far this year that the sun has been spotless.
    If we were on the old system of measuring that would be everyday so far this year.

    http://spaceweather.com/


  • Posts: 0 [Deleted User]


    Yep! still trending downwards, I wonder how long it will be before it hits the bottom of the chart and if it ever "flatlines" like it did for the first half of 2009.
    solar-cycle-sunspot-number.gif


  • Closed Accounts Posts: 592 ✭✭✭hotwhiskey


    I'm not sure how credible this is but it is interesting looking at some of the charts posted.


    Also some more interesting reading on mass gains af Antarctic ice. Quote: The good news is that Antarctica is not currently contributing to sea level rise, but is taking 0.23 millimeters per year away.

    https://www.nasa.gov/feature/goddard/nasa-study-mass-gains-of-antarctic-ice-sheet-greater-than-losses

    Also some information for people who want to read has I had read a couple of weeks ago about the cracking in Antarctica was due to increase temperature well not entirely true.

    http://www.npr.org/sections/thetwo-way/2017/01/16/509565462/an-ice-shelf-is-cracking-in-antarctica-but-not-for-the-reason-you-think

    So if Antarctica is gaining in ice why is the Artic loosing it. Does anyone know is there a comperhensive study on this between the two poles on the internet if so can you post a link.


  • Registered Users Posts: 244 ✭✭rickdangerouss


    hotwhiskey wrote: »
    I'm not sure how credible this is but it is interesting looking at some of the charts posted.


    Also some more interesting reading on mass gains af Antarctic ice. Quote: The good news is that Antarctica is not currently contributing to sea level rise, but is taking 0.23 millimeters per year away.

    https://www.nasa.gov/feature/goddard/nasa-study-mass-gains-of-antarctic-ice-sheet-greater-than-losses

    Also some information for people who want to read has I had read a couple of weeks ago about the cracking in Antarctica was due to increase temperature well not entirely true.

    http://www.npr.org/sections/thetwo-way/2017/01/16/509565462/an-ice-shelf-is-cracking-in-antarctica-but-not-for-the-reason-you-think

    So if Antarctica is gaining in ice why is the Artic loosing it. Does anyone know is there a comperhensive study on this between the two poles on the internet if so can you post a link.

    The Video starts with a picture of the Express Newspaper...

    latest?cb=20100305052502


  • Posts: 0 [Deleted User]


    The Video starts with a picture of the Express Newspaper...

    latest?cb=20100305052502
    That alone puts me off watching the video.


  • Advertisement
  • Posts: 0 [Deleted User]


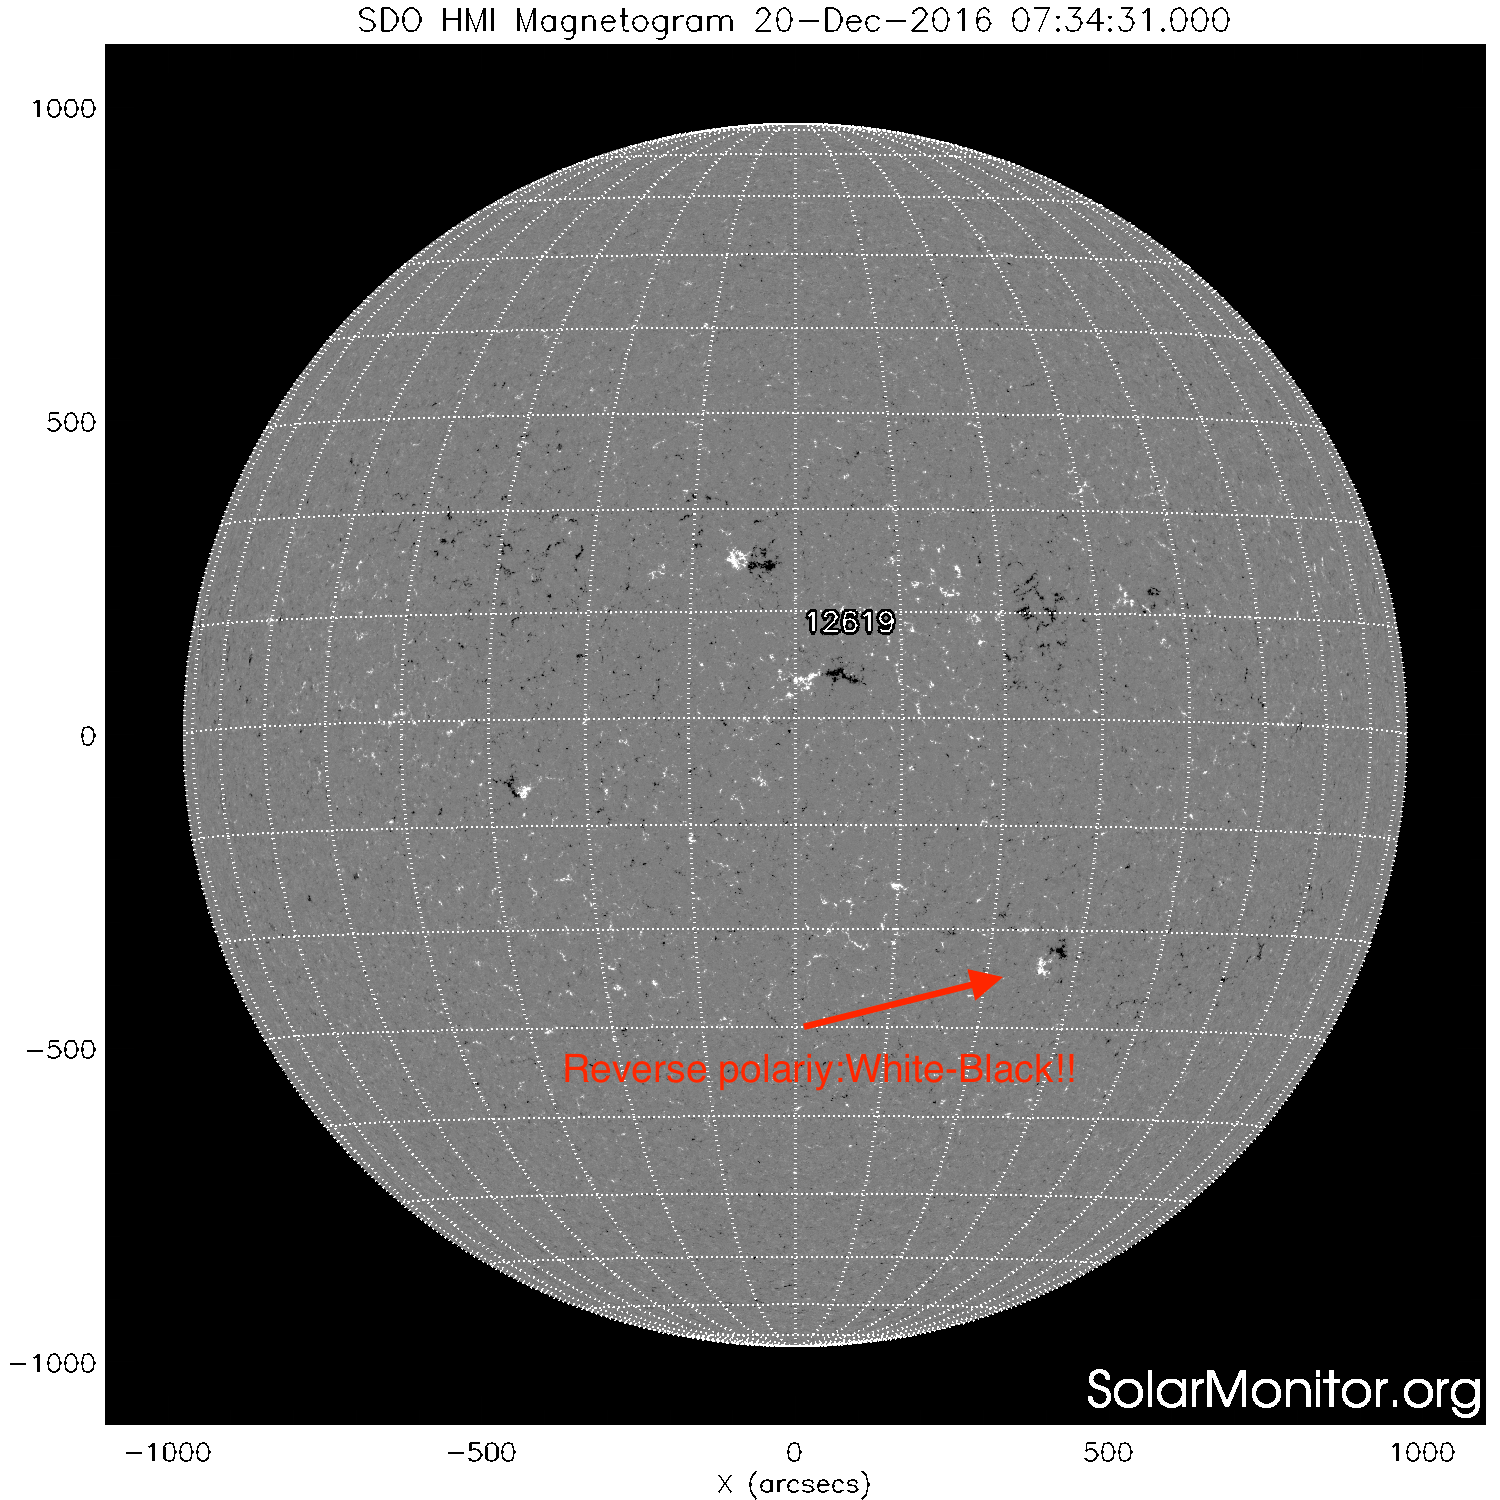
    The first sunspot of cycle 25 is seen!

    http://www.stce.be/node/359


    An attentive sunspot observer from USET spotted on December 19 a particular interesting structure in a magnetogram. It differed from the other present structures because of its position on the solar disk and the leading black - instead of white - area. By its high latitude (23°) and reverse polarity, the small magnetic dipole definitely belonged to the next sunspot cycle. If it would get strong enough to produce sunspots, it would make it the very first sunspot group of cycle 25.

    shmi_maglc_fd_20161220_073431.png
    I know the cycles overlap but this the minimum is still several years away.

    It's that low latitude that that increases the risk of it being a false positive, otherwise cycle 25 could end up seriously overlapping 24.

    On the other hand maybe having two opposing cycles together may be the cause of the low sunspot count in the first place, one cancelling out the other.

    A thought that provokes far more question that I could possibly answer.


  • Posts: 0 [Deleted User]


    hotwhiskey wrote: »
    I'm not sure how credible this is but it is interesting looking at some of the charts posted.


    I watched it in the end. :o

    Definitely an alarmist video, that appears to require a few major volcanic eruptions to kickstart the process before the "mini ice age" arrives. I would be more inclined to think that additional volcanic activity indicates an unstable magnetic influence on the Earth.
    Does this imply that a solar minimum results in an unstable magnetic field.


    Edit:
    yet another video proclaiming the coming of the next ice age, but with lots of charts.


  • Closed Accounts Posts: 592 ✭✭✭hotwhiskey


    How comet Honda has awoken the Sun with increase sunspots. Honda will pass earth around Feb 11 2017. Chance of polar storms from Jan 18.


  • Posts: 0 [Deleted User]


    Current Weak Solar Cycle Could Reduce Global Temperatures By Half A Degree
    https://wattsupwiththat.com/2017/03/31/current-weak-solar-cycle-could-reduce-global-temperatures-by-half-a-degree/
    Current Weak Solar Cycle Could Reduce Global Temperatures By Half A Degree
    Anthony Watts / 16 hours ago March 31, 2017

    From ​the Swiss National Science Foundation (SNSF)

    Sun’s impact on climate change quantified for first time

    A solar flare captured by NASA’s Solar Dynamics Observatory – click for much larger image

    For the first time, model calculations show a plausible way that fluctuations in solar activity could have a tangible impact on the climate. Studies funded by the Swiss National Science Foundation expect human-induced global warming to tail off slightly over the next few decades. A weaker sun could reduce temperatures by half a degree.

    There is human-induced climate change, and there are natural climate fluctuations. One important factor in the unchanging rise and fall of the Earth’s temperature and its different cycles is the sun. As its activity varies, so does the intensity of the sunlight that reaches us. One of the key questions facing climate researchers is whether these fluctuations have any effect at all on the Earth’s climate. IPCC reports assume that recent solar activity is insignificant for climate change, and that the same will apply to activity in the near future.

    Researchers from the Physical Meteorological Observatory Davos (PMOD), the Swiss Federal Institute of Aquatic Science and Technology (EAWAG), ETH Zurich and the University of Bern are now qualifying this assumption. Their elaborate model calculations are supplying a robust estimate of the contribution that the sun is expected to make to temperature change in the next 100 years. For the first time, a significant effect is apparent. They expect the Earth’s temperature to fall by half a degree when solar activity reaches its next minimum.
    The article is written on a "climate sceptical" site, but still worth a mention that ultimately the sun provide 100% of the energy input to the earth.
    Even a weaker solar magnetic field would reduce the heating affect of the Earth's core on the surface.


  • Registered Users Posts: 6,038 ✭✭✭Elmer Blooker


    hotwhiskey wrote: »
    I'm not sure how credible this is but it is interesting looking at some of the charts posted.


    Interesting connection between solar activity and increased vulcanism. I'm not sure how credible it is either but a volcano in the Kamchatka Peninsula has suddenly become active after 248 years and first major eruption for about 600 years- no tremors and no warning signs!
    This link is worth a look in my opinion. Make your own minds up.
    http://beforeitsnews.com/environment/2017/03/russian-volcano-first-major-eruption-in-600-years-following-mini-ice-age-cycles-2573203.html
    It is claimed that the very severe winter of 1739-40 was caused by volcanic activity on the Kamchatka Peninsula.


  • Advertisement
  • Registered Users Posts: 3,495 ✭✭✭Pa ElGrande


    A history of solar activity over millennia - Ilya G. Usoskin - http://jultika.oulu.fi/files/nbnfi-fe201703061963.pdf
    Abstract - Presented here is a review of present knowledge of the long-term behavior of solar activity on a multi-millennial timescale, as reconstructed using the indirect proxy method. The concept of solar activity is discussed along with an overview of the special indices used to quantify different aspects of variable solar activity, with special emphasis upon sunspot number.

    continued . . .

    If you want the conclusion
    In general, the following main features are observed in the long-term evolution of solar magnetic activity.

    – Solar activity is dominated by the 11-year Schwabe cycle on an interannual timescale. Some additional longer characteristic times can be found, including the Gleissberg secular cycle, de Vries/Suess cycle, and a quasi-cycle of 2000– 2400 years (Hallstatt cycle). However, all these longer cycles are intermittent and cannot be regarded as strict phase-locked periodicities.

    – One of the main features of long-term solar activity is that it contains an essential chaotic/ stochastic component, which leads to irregular variations and makes solar-activity predictions impossible for a scale exceeding one solar cycle.

    – The sun spends about 70% of its time at moderate magnetic activity levels, about 15–20% of its time in a grand minimum and about 10–15% in a grand maximum.

    – Grand minima are a typical but rare phenomena in solar behavior. They form a distinct mode of solar dynamo. Their occurrence appears not periodically, but rather as the result of a chaotic process within clusters separated by the 2000-2500 years (around the lows of the Hallstatt cycle). Grand minima tend to be of two distinct types: short (Maunder-like) and longer (Spörer-like).

    – The recent level of solar activity (after the 1940s) was very high, corresponding to a prolonged grand maximum, but it has ceased to the normal moderate level. Grand maxima are also rare and irregularly occurring events, though the exact rate of their occurrence is still a subject of debates.

    These observational features of the long-term behavior of solar activity have important implications, especially for the development of theoretical solar-dynamo models and for solar-terrestrial studies.

    Net Zero means we are paying for the destruction of our economy and society in pursuit of an unachievable and pointless policy.


  • Closed Accounts Posts: 4,559 ✭✭✭pedigree 6


    Spotless again. That's 4 days on the trot now.

    screenshot_1.png

    http://spaceweather.com/


  • Closed Accounts Posts: 951 ✭✭✭Floki


    Almost the same post as above.
    4 spotless days on the trot again.
    The spotless days have racked up this year.

    There's a good article in space weather.com about pink auroras currently taking place which is unusual but it seems to have a correlation between a spotless quiet Sun and solar wind or maybe cosmic rays able to reach lower down into the earths atmosphere (possibly from a lower than normal earth magnetic field ) hitting nitrogen atoms and producing this pink colour.

    More here..
    http://spaceweather.com/


  • Posts: 0 [Deleted User]


    http://spaceweather.com/
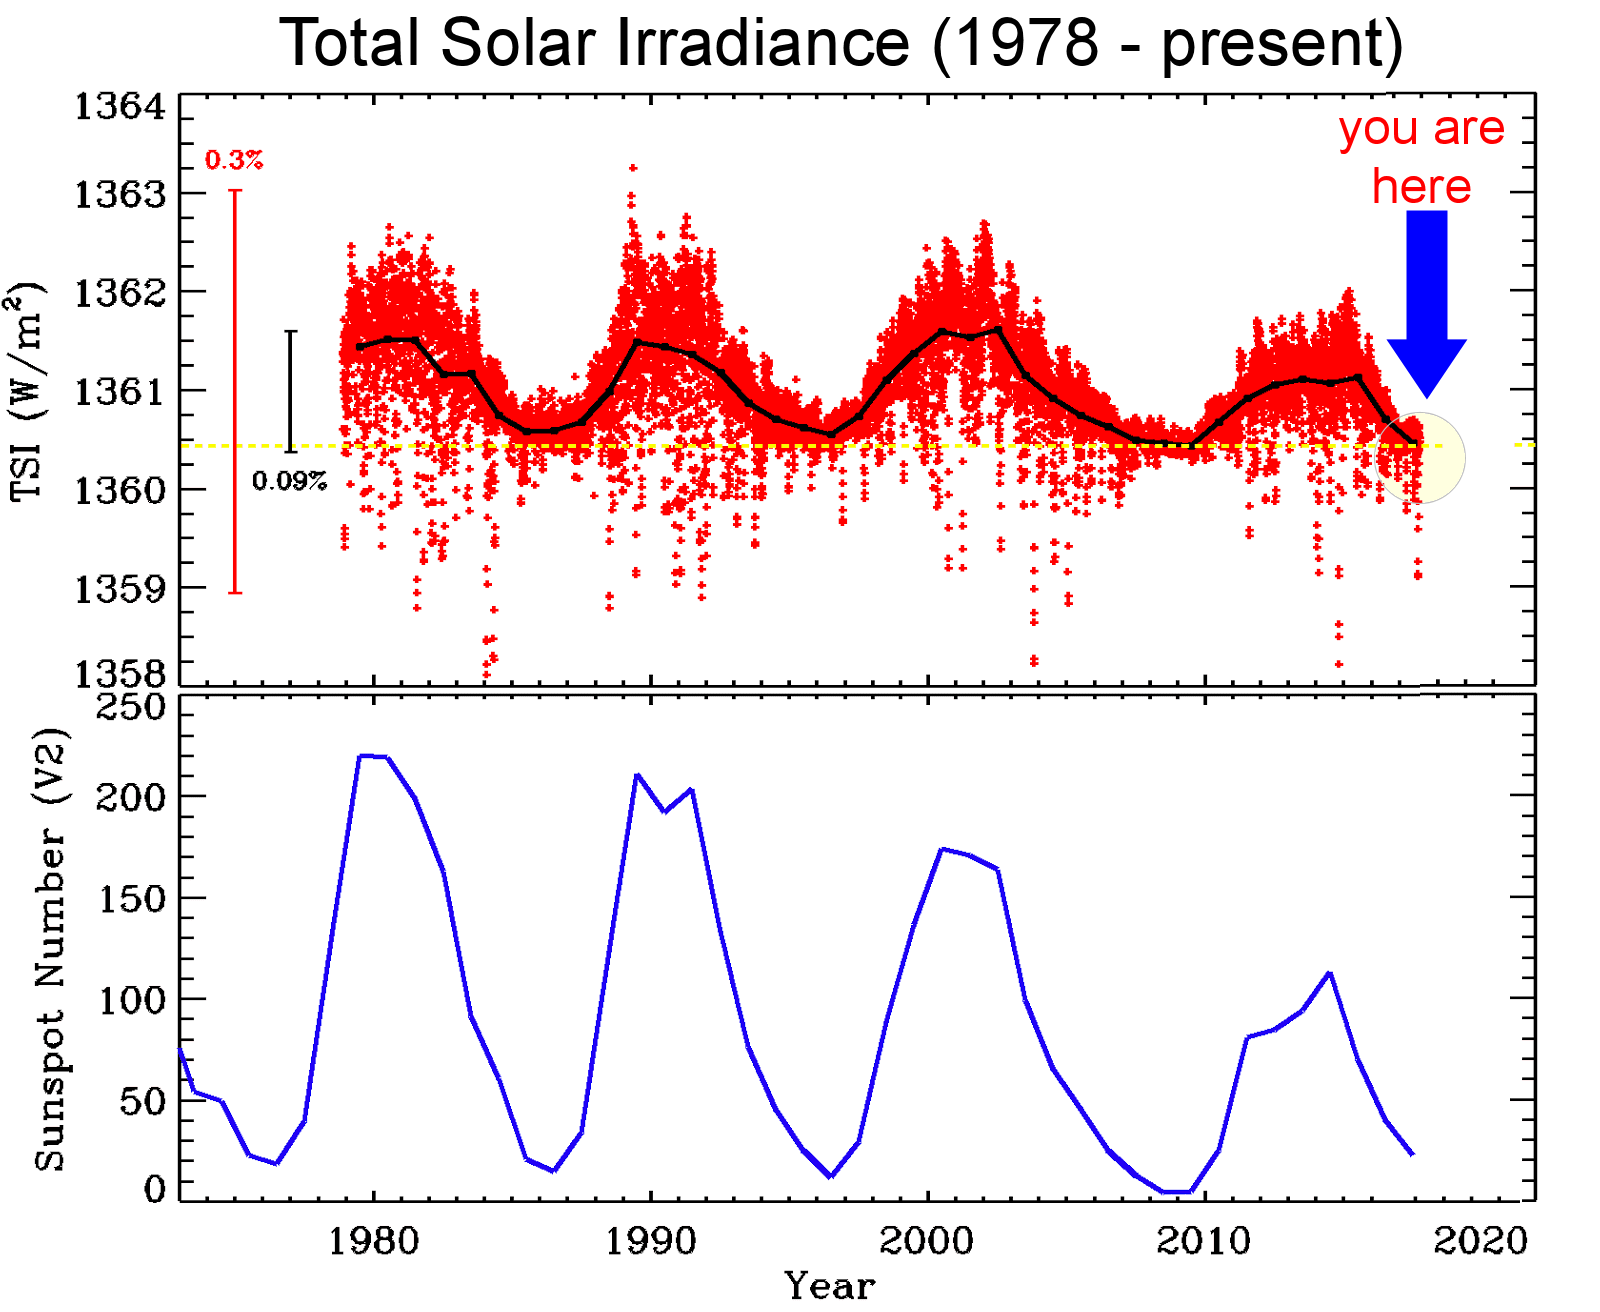
    THE SUN IS DIMMING:
    Today at Cape Canaveral, SpaceX launched a new sensor to the International Space Station named TSIS-1. Its mission: to measure the dimming of the sun. As the sunspot cycle plunges toward its 11-year minimum, NASA satellites are tracking a decline in total solar irradiance (TSI). Across the entire electromagnetic spectrum, the sun's output has dropped nearly 0.1% compared to the Solar Maximum of 2012-2014. This plot shows the TSI since 1978 as observed from nine previous satellites:

    tsi.png?PHPSESSID=4ki9c00oe7vja5id6edgmim7d7
    We may soon see if the "man made warming" is really warming the planet as much as has been claimed, will the reduced solar irradiation reverse this warming or will it get even cooler. One thing that appears to be apparent is the wakening solar magnetic field is also weakening the Earth's magnetic field and this is allowing in more radiation.

    So this could mean more cancers.


  • Registered Users Posts: 3,495 ✭✭✭Pa ElGrande


    Intense solar activity such as sunspots and solar flares subsides during solar minimum, but that doesn’t mean the sun becomes dull. Solar activity simply changes form.

    Net Zero means we are paying for the destruction of our economy and society in pursuit of an unachievable and pointless policy.


  • Registered Users Posts: 6,038 ✭✭✭Elmer Blooker


    I think its worthwhile getting this thread going again as it looks that things are getting very interesting. Hopefully we get something a bit longer than a cold snap next winter.
    Could you find any dark cores? Answer: No. The last time the sun was blank more than 50% of the time was in 2009, near the end of the deepest Solar Minimum of the Space Age. Now the sun is entering a new Solar Minimum, and it is shaping up to be even deeper than before.

    http://www.spaceweather.com/


  • Registered Users Posts: 68 ✭✭dring


    Number of Days with snow Dublin Airport-

    Year SN
    1973 16
    1974 11
    1975 19
    1976 12
    1977 25
    1978 27
    1979 45
    1980 15
    1981 15
    1982 19
    1983 20
    1984 27
    1985 28
    1986 35
    1987 18
    1988 17
    1989 20
    1990 24
    1991 20
    1992 9
    1993 -
    1994 13
    1995 34
    1996 25
    1997 13
    1998 15
    1999 13
    2000 8
    2001 10
    2002 9
    2003 11
    2004 9
    2005 -
    2006 10
    2007 8
    2008 9
    2009 16
    2010 41
    2011 9
    2012 6
    2013 26
    2014 5
    2015 16
    2016 12
    2017 10


  • Registered Users Posts: 13,509 ✭✭✭✭sryanbruen


    dring wrote: »
    Number of Days with snow Dublin Airport-

    Year SN
    1973 16
    1974 11
    1975 19
    1976 12
    1977 25
    1978 27
    1979 45
    1980 15
    1981 15
    1982 19
    1983 20
    1984 27
    1985 28
    1986 35
    1987 18
    1988 17
    1989 20
    1990 24
    1991 20
    1992 9
    1993 -
    1994 13
    1995 34
    1996 25
    1997 13
    1998 15
    1999 13
    2000 8
    2001 10
    2002 9
    2003 11
    2004 9
    2005 -
    2006 10
    2007 8
    2008 9
    2009 16
    2010 41
    2011 9
    2012 6
    2013 26
    2014 5
    2015 16
    2016 12
    2017 10

    This seems a bit inaccurate. Where did you get your data from?


  • Registered Users Posts: 68 ✭✭dring


    this website https://en.tutiempo.net/climate/ws-39690.html , I cannot find a similar table on the meteireann website, This would be the number of days with even one snow flurry observed, 2010 had snow in Jan and again in Nov./Dec. Jan/Feb 79 was very cold so that explains the two highest numbers, the 82 snow was gone by Jan 18th I think. There is some comparison here on snow events http://www.met.ie/climate-ireland/weather-events/ColdSpell10.pdf
    This year´s event seems both less cold and shorter than many of the other historical events but I would guess more snow fell last Friday than on possibly any one day on record


  • Advertisement
  • Registered Users Posts: 13,509 ✭✭✭✭sryanbruen


    dring wrote: »
    this website https://en.tutiempo.net/climate/ws-39690.html , I cannot find a similar table on the meteireann website, This would be the number of days with even one snow flurry observed, 2010 had snow in Jan and again in Nov./Dec. Jan/Feb 79 was very cold so that explains the two highest numbers, the 82 snow was gone by Jan 18th I think. There is some comparison here on snow events http://www.met.ie/climate-ireland/weather-events/ColdSpell10.pdf
    This year´s event seems both less cold and shorter than many of the other historical events but I would guess more snow fell last Friday than on possibly any one day on record

    That explains it then, that site is full of inaccurate information. Stay away from it.


  • Closed Accounts Posts: 191 ✭✭Casualsingby


    Is it counting days with sleet/snow falling rather than just snow falling.


  • Registered Users Posts: 1,985 ✭✭✭BLIZZARD7


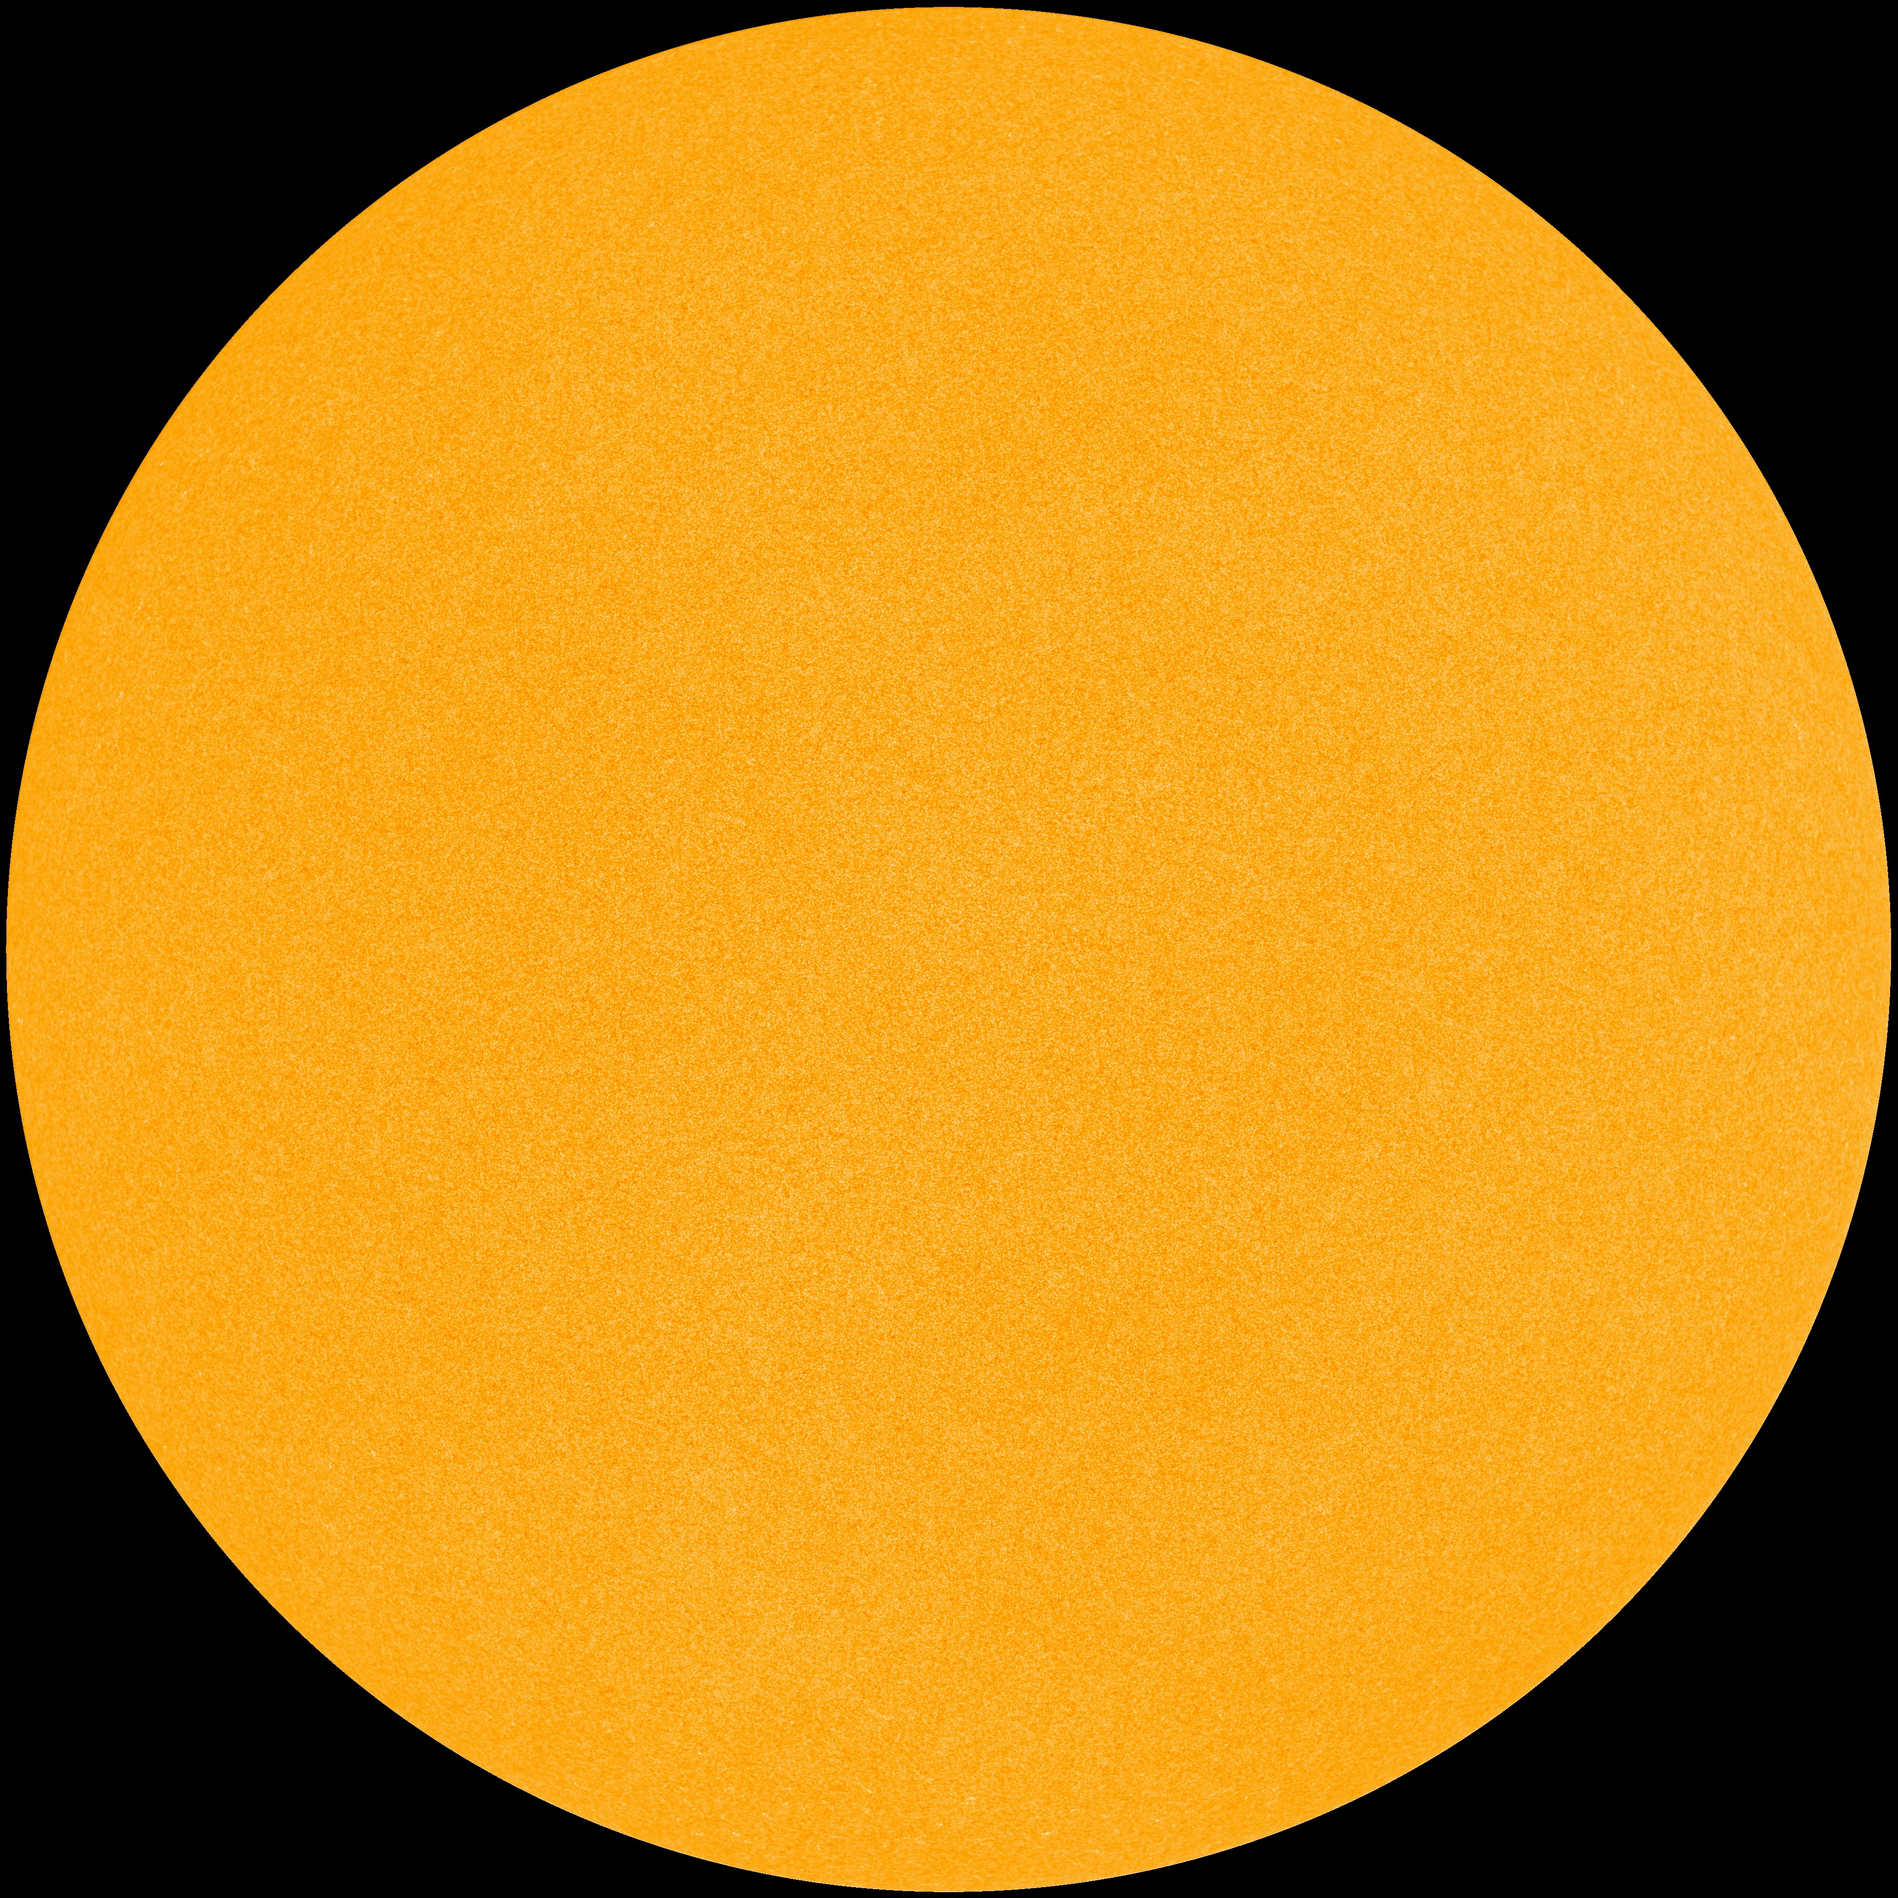
    Day 9 in a row blank - we are heading towards 2009 levels fast :)

    hmi1898.gif?PHPSESSID=mggcqer3rj2m3ss6g2vnj9h810


  • Registered Users Posts: 13,509 ✭✭✭✭sryanbruen


    This is my graph of the mean monthly sunspot numbers for November 2009 to February 2018 with notable points of interest marked. You can clearly see that we're not long off solar minimum, going by what 2009 was like on the chart.

    YLefzqf.png

    Data is from SILSO.


  • Registered Users Posts: 13,509 ✭✭✭✭sryanbruen


    If you'd like to know about the solar activity or sun as of recently and what it could mean for us in Winter time or even the globe in general, I'd highly recommend GavsWeatherVids' most recent Solar Sunday video he did in February. In my opinion, it's absolutely brilliant.


  • Registered Users Posts: 1,985 ✭✭✭BLIZZARD7


    Sun blank again, day 10 in a row.
    38 days blank this year (52%)


  • Registered Users Posts: 624 ✭✭✭Mullaghteelin


    Is it counting days with sleet/snow falling rather than just snow falling.

    Either way, Im highly surprised at 1993 having nothing! January and December had some cold westerlies that gave a slushy covering in north county Dublin, for a few hours at least.

    If you dont count spring snowfalls in March or April, we had very little winter snow during the years from 1997 to 2000.


  • Registered Users Posts: 13,509 ✭✭✭✭sryanbruen


    Either way, Im highly surprised at 1993 having nothing! January and December had some cold westerlies that gave a slushy covering in north county Dublin, for a few hours at least.

    If you dont count spring snowfalls in March or April, we had very little winter snow during the years from 1997 to 2000.

    It didn't have nothing (you are correct), that site is just very inaccurate, as I already stated.

    1993 was one of the more snowier years of the 90s.


  • Registered Users Posts: 1,985 ✭✭✭BLIZZARD7


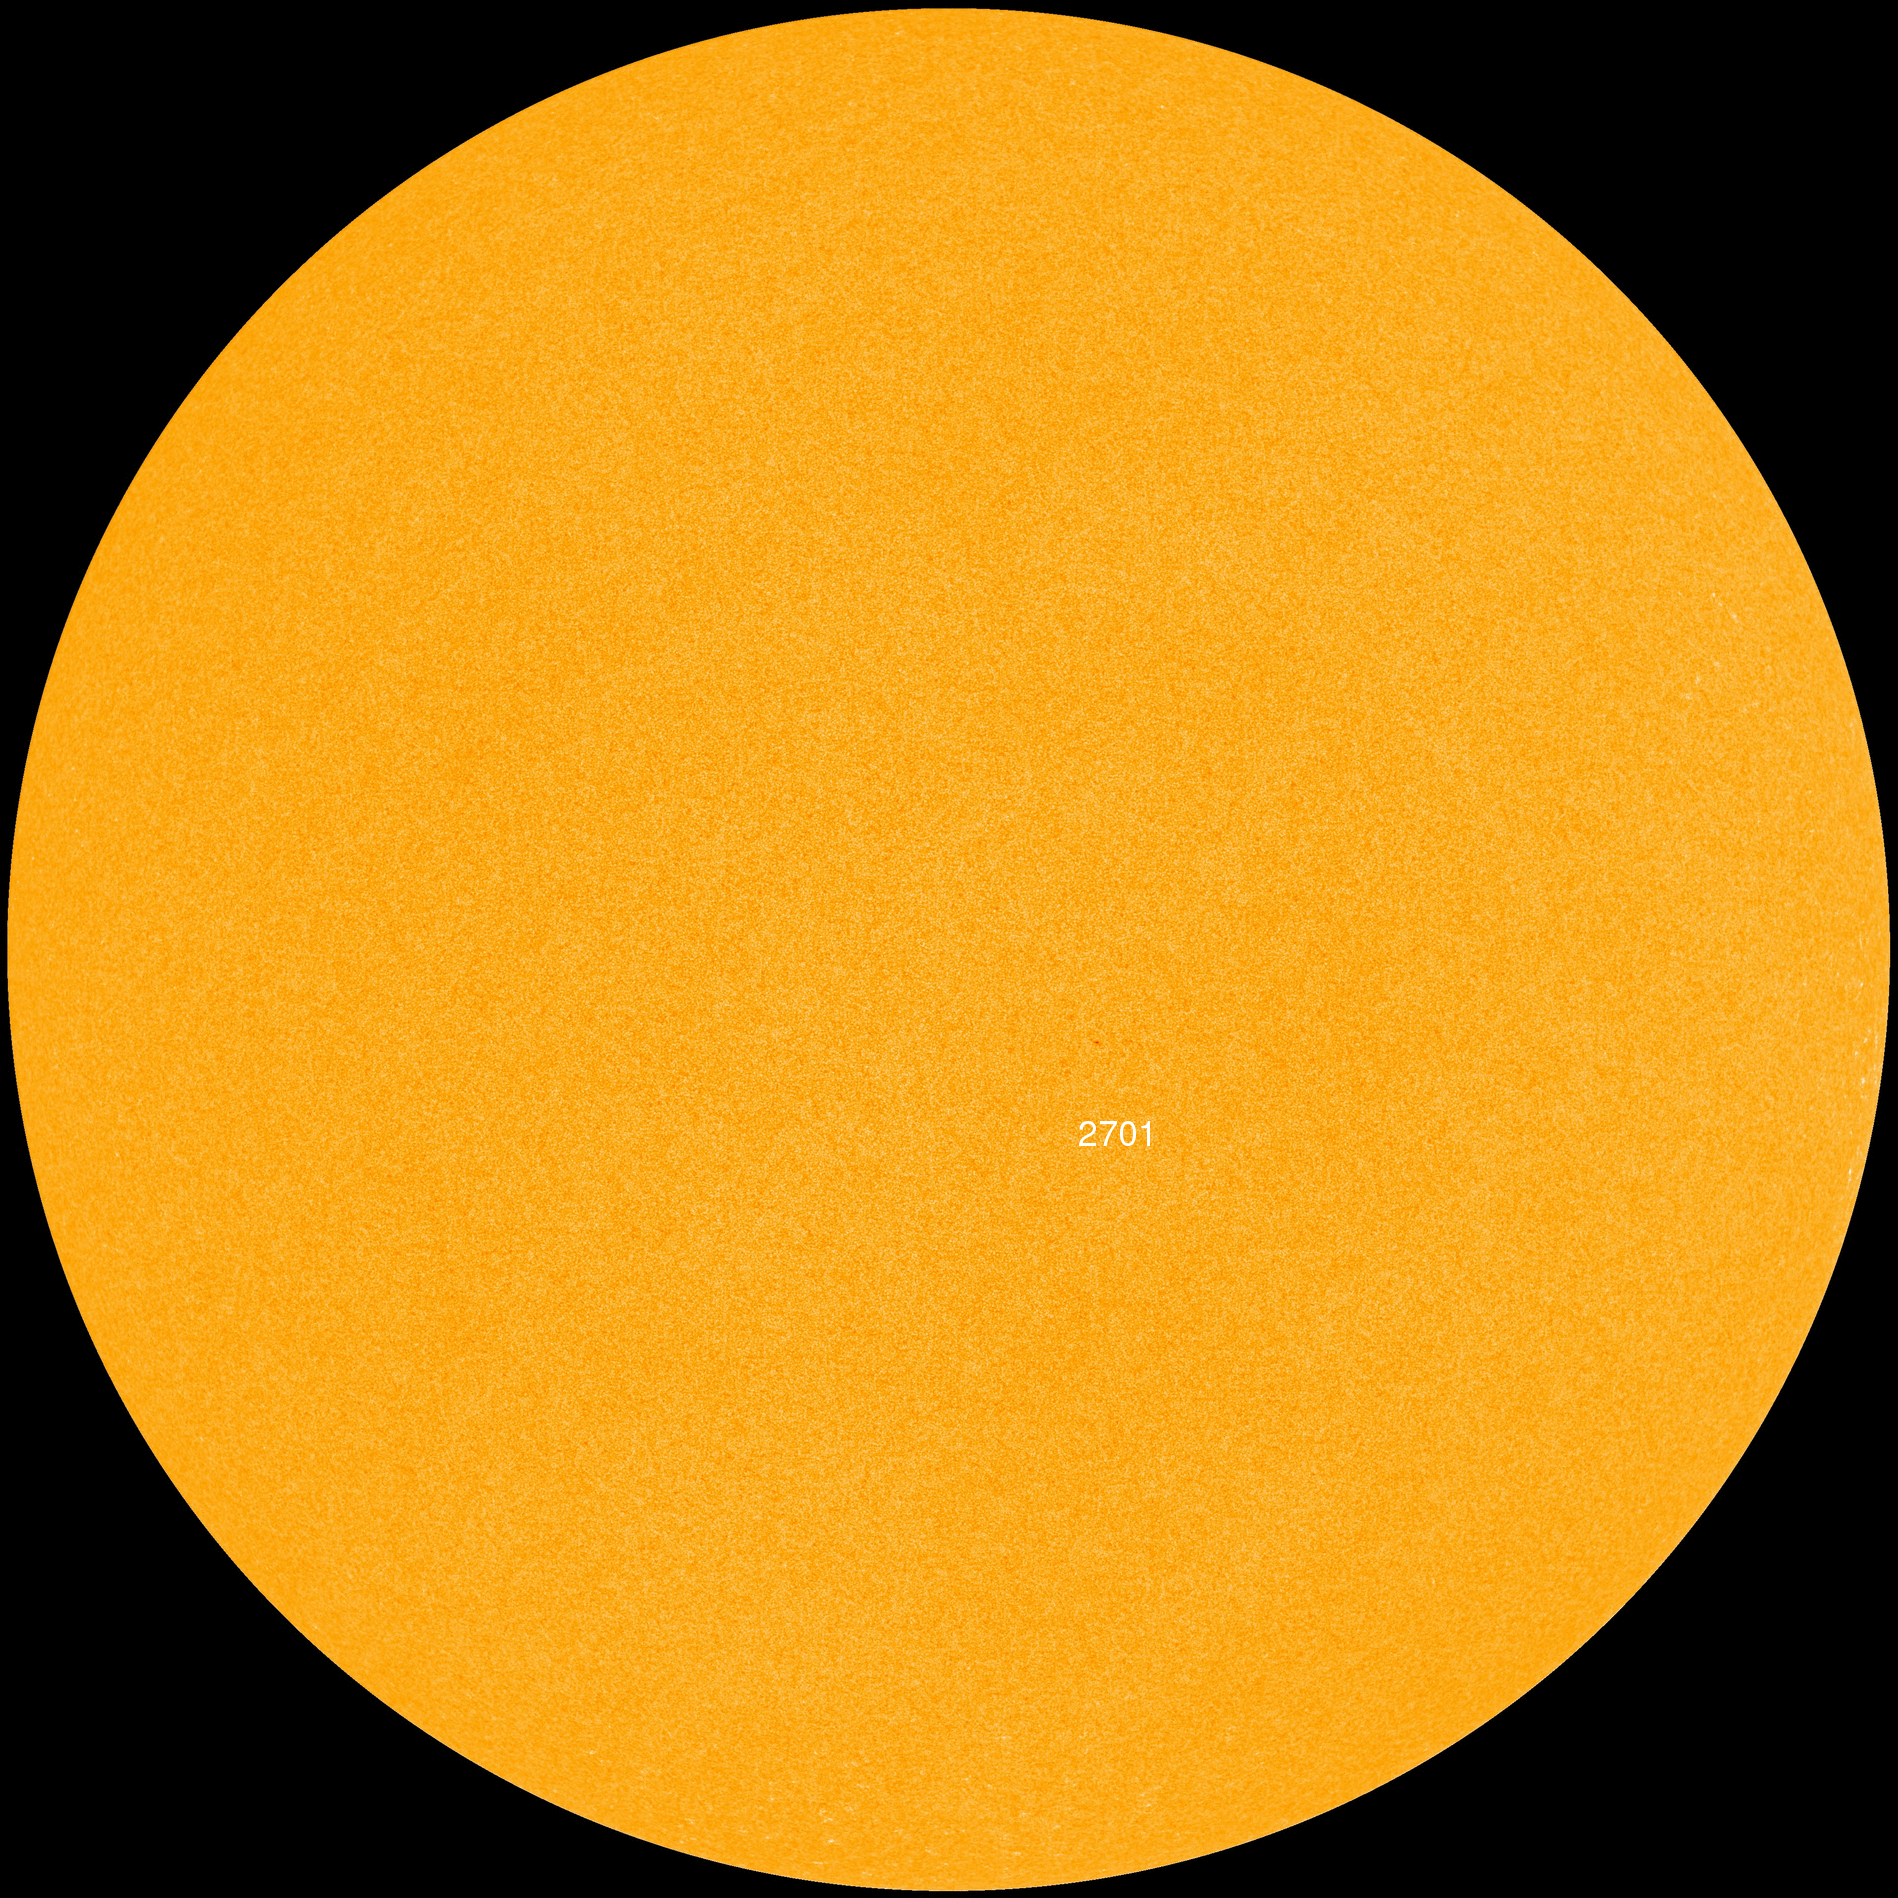
    Not sure why space weather counted this one, tis so tiny I can't see it. Anyway 12 days blank then this, no way this would have been counted during the last grand minimas.

    "Tiny new sunspot AR2701 is nearly invisible and will likely be gone tomorrow as it quickly fades away"

    hmi1898.gif?PHPSESSID=01l141k7lo32pb9gjluhf68v03


  • Advertisement
  • Registered Users Posts: 7,796 ✭✭✭Calibos


    BLIZZARD7 wrote: »
    Not sure why space weather counted this one, tis so tiny I can't see it. Anyway 12 days blank then this, no way this would have been counted during the last grand minimas.

    "Tiny new sunspot AR2701 is nearly invisible and will likely be gone tomorrow as it quickly fades away"

    Quite a few sunspots on that image I thought to myself. Then I scrolled the page and realised that in fact what I had was quite a few residuals from a big sneeze on my monitor last night.

    Don't worry, I've now wiped it down with some Dettol AntiBac/Viral Wipes :D


Advertisement