Advertisement
If you have a new account but are having problems posting or verifying your account, please email us on hello@boards.ie for help. Thanks :)
Hello all! Please ensure that you are posting a new thread or question in the appropriate forum. The Feedback forum is overwhelmed with questions that are having to be moved elsewhere. If you need help to verify your account contact hello@boards.ie
Hi all! We have been experiencing an issue on site where threads have been missing the latest postings. The platform host Vanilla are working on this issue. A workaround that has been used by some is to navigate back from 1 to 10+ pages to re-sync the thread and this will then show the latest posts. Thanks, Mike.
Hi there,
There is an issue with role permissions that is being worked on at the moment.
If you are having trouble with access or permissions on regional forums please post here to get access: https://www.boards.ie/discussion/2058365403/you-do-not-have-permission-for-that#latest
There is an issue with role permissions that is being worked on at the moment.
If you are having trouble with access or permissions on regional forums please post here to get access: https://www.boards.ie/discussion/2058365403/you-do-not-have-permission-for-that#latest
The sun is dead!! Mini iceage???
Comments
-
We have breached the 200 day spotless mark for 2018 - SFU @ 69
Spotless Days
Current Stretch: 6 days
2018 total: 200 days (60%)
2017 total: 104 days (28%)
2016 total: 32 days (9%)
2015 total: 0 days (0%)
2014 total: 1 day (<1%)
2013 total: 0 days (0%)
2012 total: 0 days (0%)
2011 total: 2 days (<1%)
2010 total: 51 days (14%)
2009 total: 260 days (71%)
2008 total: 268 days (73%)
2007 total: 152 days (42%)
2006 total: 70 days (19%)
Will be very interesting to see just how deep and long this minimum gets...0 -
Not sure what criteria/parameters are used for these forecasts but if they prove correct we will be testing the LIA theory very soon...


Meanwhile we have our first spot in 9 days with minor B-class flares - spot number 2729
SFU @ 71
2018 : 203 days blank (60%)0 -
Not sure what criteria/parameters are used for these forecasts but if they prove correct we will be testing the LIA theory very soon...
Meanwhile we have our first spot in 9 days with minor B-class flares - spot number 2729
SFU @ 71
2018 : 203 days blank (60%)
Sorry Blizzard can you enlighten me what the LIA theory is again please?0 -
Sorry Blizzard can you enlighten me what the LIA theory is again please?
The idea that the 'Little Ice Age' (LIA) was caused atleast in part by periods of deep solar minima such as the Sporer, Maunder and Dalton minimums. We don't know that this was definitely the cause of the cold period, it may have been volcanic activity or a slowing of the thermohaline circulation amongst other things. It may also have been a combination of these things.
If we are currently entering a similiar grand solar minimum to those mentioned then atleast we will have a modern day equivalent to observe any drop in temperatures that may or may not occur.
It's looking increasingly likely this minimum will break modern records - the next 6-9 months will be key to see if this is just a normal sharp drop minimum or if we are entering something more prolonged.0 -
would ice coverage give a clue? either Artic or Antartic? and if so which season?
A belief in gender identity involves a level of faith as there is nothing tangible to prove its existence which, as something divorced from the physical body, is similar to the idea of a soul. - Colette Colfer
0 -
Arctic sea ice has been declining in volume and area year on year from about 1990 until around 2012, since then it has mainly had similar annual minimum values.
If it starts a trend of having higher minimum volumes and extents each year, then it is possible to either attribute the variation to a natural cycle or to the solar minimum.
I expect that average temperatures in this part of the world would be the best indicator of whether there is a little ice age or not.0 -
Over a longer period, Schove produced the following reconstruction of solar activity from 290 A.D. to the recent documented modern observational period. He did this by assuming that records made of auroral sightings (mostly in China and Korea) would correlate with solar activity. He divided the solar activity peaks into nine groups from "very weak" to "very strong" and this graph is my adaptation of his research in a form where it's easy to skim up or down the page and see the variations over the past seventeen centuries.
If you look at this you'll see that solar downturns are often about a century apart. Some are longer and deeper than others. Intervals of active Sun are probably three-quarters of the total record, many of them rival the past century. The 16th century about a hundred years before the Maunder was quite active, for example.
The "peaks" in the Maunder were all in the weak or very weak category and I don't think the year numbers mean much. But you'll notice that when the Sun goes into quiet mode, the period of solar cycles slows down from its usual 10-11 year pace in active periods, to something more like 12-14 years. This happened in both the Dalton and the more recent 1883-1893-1905-1917 peak downturn.
In research that I reported on here,
https://www.netweather.tv/forum/topic/47871-the-known-history-of-solar-activity/
I documented evidence that the active periods of stronger solar activity seem to be modulated by a Jupiter-Saturn interaction over a ten year cycle. When the Sun is less active, this shuts off and the timing seems to switch to something closer to a Jupiter-Sun interaction (Jupiter's orbital period is 11.9 years, the Jupiter-Saturn mutual opposition cycle is 19.86 years).
Here's that graph anyway. I reduced the scale so it's easier to scroll up and down to see the variations. This is slightly edited from what appears in the link.
..................290
........................302
...............311
...............321
.........330
.........342
.....................354
.....................362
........................372
...............387
...............396
.........410
.........421
..................430
..................441
.....................452
.........465
..................479
...............490
........................501
.....................511
.........522
.....................531
...............542
...............557
........................567
...............578
.....................585
............597
.........607
...............618
............628
...............642
..................654
...............665
.....................677
.........689
.........699
.....................714
.....................724
.........735
........................745
...............754
........................765
..................776
.........787
..................798
.....................809
.........821
.....................829
........................840
..................850
...............862
.....................872
...............887
.........898
.........907
...............917
........................926
..................938
............950
........................963
........................974
...............986
.........994
.....................1003
...............1016
...............1027
.........1038
......1052
...............1067
...............1078
...............1088
........................1098
............1110
........................1118
.....................1129
........................1138
.....................1151
............1160
..................1173
..................1185
...............1193
........................1202
...............1219
...............1228
...............1239
............1249
...............1259
...............1276
...............1288
.........1296
...............1308
...............1319
...............1324
.........1337
............1353
........................1362
...........................1372
..................1382
...............1391
...............1402
......1413
............1429
............1439
............1449
............1461
......1472
......1480
............1497
.........1505
...............1519
........................1528
.....................1539
.....................1548
........................1558
........................1572
.....................1581
............1591
............1604
...............1615
..................1629
............1639
......1649
......1660
.........1675
......1685
...1693
......1705
.....................1718
........................1727
.....................1738
...............1750
...............1761
..................1769
........................1778
........................1787
............1794 (shoulder of 1787 peak)
......1801
......1816
............1830
........................1837
.....................1848
..................1860
........................1870
.........1883
...............1893
.........1905
..................1917
...............1928
.....................1937
........................1947
...........................1957
..................1968
........................1979
........................1989
..................2001
.............2013
The entry for 1794 is not a recognized peak but I suspect it may represent a separate cycle that was superimposed on a long-lived peak around 1787.
There may be one or two missing peaks that Schove failed to detect using his methods, where intervals are as long as 17 years in one part of the earlier records. I can't state with any confidence that every peak is shown here but it would only take one or two additional peaks to maintain the solar activity cycle average near 10.5 years (what it was from 1917 to 2001).
Going back in time, you'll see the late 19th century reduced activity period, then the Dalton (early 19th century), the Maunder (longer interval second half of 17th century), the Sporer minimum (another long one in 15th century), and before that, look at downturns around these weaker peaks ... 1337, 1353 ... 1160 ... 1038, 1052 ... 887 to 917 ... 689, 699 ... 597, 607 ... 410, 421 ... 330, 342. There are some other cases that appear to be just one weak cycle in duration. But the overall record is similar to the spread in modern (past 2-3 centuries) of data, and consists of similar lengths of active and inactive periods.
It is widely reported that researchers expect this to become a longer quiet Sun period than even the Dalton (if it goes to 2050). I don't know enough about that research to comment, as to how reliable those forecasts (by astronomers, not climate scientists) might be, but if they are reliable, it's going to have an impact perhaps totally offsetting the human warming signal of recent decades. As to process though, the solar quiet would be working on one set of drivers of climate while human activity works on a different set (boundary layer temperature related). So the net effect could be unpredictable to say the least.0 -
If you read the link in my previous post, this is a better version of the graph that I was having trouble sizing ...
YEAR 01..02..03.04..05..06.07..08..09.10..11..12.13..14..15.16..17..18.19..20
___J-S ______________________ J=S __________________
__same side _______________ opp sides ________________
.........................................................................290....
..................................................302......................311.
..............................................321......................330...
...................................................342..........................
......354........................................362..........................
...372.......................................................387.............
................396.....................................................410...
.............................................421........................430...
..............................................441...............................
.......452....................................................465...............
............................479.............................................490.
..............................................501.............................
......511..........................................522..........................
......531..........................................542..........................
......................557............................................567........
...................................578..........................585.............
..............................597.....................................607.......
...................................618.....................................628..
...............................................642............................
.................654.......................................665..................
....................................677.....................................689.
...........................................699.................................
................714........................................724..................
......................735......................................745..............
................754............................................765..............
.........................776............................................787.....
..............................798..............................................
....809............................................821..........................
....829.......................................840...............................
........850...........................................862.......................
..............872..........................................................887.
......................................898....................................907
................................917..................................926.......
..................................938..........................................
....950.................................................963....................
.....................974..............................................986.
...................994.................................1003....................
......................................1016.....................................
.....1027......................................1038............................
..................1052........................................................
.....1067......................................1078............................
.........1088 .................................1098............................
...............1110............................1118.......................
...............1129..............................1138..........................
........................1151..................................1160.............
................................1173.......................................1185
................................1193................................1202........
.............................................................1219.............
.........1228...............................................1239...............
..............1249..........................................1259...............
.............................................1276...............................
..............1288...........................1296...............................
..............1308..........................................1319..........1324.
.................................................1337...........................
....................................1353.............................1362......
................................1372.................................1382.......
............................1391...................................1402........
...................................1413.........................................
.......................1429....................................1439.............
........................1449..........................................1461.....
...................................1472...............................1480......
...............................................................1497............
.................1505............................................1519..........
.........................1528......................................1539.........
.........................1548..................................1558.............
..........................................1572.......................1581......
.......................................1591.....................................
........1604......................................1615.........................
..............................1629.........................1639................
.............................1649..................................1660........
.....................................................1675.....................
.............1685.............................1693.............................
.............1705..............................................1718............
.....................1727......................................1738............
.................................1750......................................1761.
..............................1769............................1778............
.....................1787.................................................1801.
..........................................................1816..................
................................1830...........................1837.............
.........................1848..............................................1860.
.................................1870..........................................
......1883................................1893.................................
.............1905...........................................1917...............
.........................1928................................1937...............
......................1947....................................1957..............
..........................1968............................................1979..
............................1989...............................................
.......2001....................(pres)................pred 2014.............
the last line should look like this now that it's no longer a pred(iction) ...
.......2001......................................2013...........................
(note, all mutual J-S oppositions fall into three groups that slowly advance through the earth year in terms of J and S locations, the 2000 set were in November EOD, the 2020 set will return to a July EOD location and the 1981 set have most recently been in March.
As one example of a longer 735 year cycle, the 2020 set (1961, 1901 etc) can be compared to a similar orientation in 1226, but that one slowly moved forward from July oppositions through August, September and October oppositions in the 59.6 year set 1286, 1345, 1405, 1464, 1524, 1584, 1643, 1703, 1763, 1822, 1881, 1941 then 2000.
If it's not the J-S cycle driving this regular solar activity, then it must be some other process at a similar time scale (every 10 years). But it's fascinating that it keeps resetting to a similar orientation 4-5 years ahead of these alignments, slowly moving towards years of alignment (as with the 1999-2001 peak) then fading out to weaker and longer-period interludes more correlated with Jupiter's sole orbital cycle and ignoring Saturn's period.
The stronger the activity (as with 1937 to 1989) the more pronounced a secondary around alignment becomes (1941, 1950-51, 1960-61, 1972, 1981-2, 1991, 2001 saw secondary maxima). This also happened with the 1837 to 1870 strong peaks.
Research will need to uncover any possible reasons why the J-S interaction fades out and returns, or if it remains a random fluctuation, to make any progress on long-term predictability.
The interesting thing about Schove's research is that he extended the period of record by approximately five times yet nothing in that five-times-longer interval falls outside the experience of the instrumental observation period broadly defined as Maunder to present. Some indications from other research suggest higher peaks of activity in the distant past. Longer or deeper shutdown periods than the Maunder are not documented. You have to wonder if the Maunder condition could be an alternate stable configuration for solar activity and if this happened for very long periods of time in the past (although from Milankovitch we already understand orbital causes of glacial maximum periods). A 100-year Maunder minimum would be a chilly time indeed.0 -
This graphic helps to illustrate how the Sun has been subject to roughly century-long cycles of active and weak cycles. Just as an arbitrary method of showing this, I divided the historical record in my first of two graphs above into columns of all apparent cycles of this kind, regardless of length. This may help give an idea of the variables involved in trying to project how long the current weaker phase will last.
The first of these strong-to-weak intervals may have been halfway or thereabouts finished when this record began so I arbitrarily assigned it four missing cycles. (roughly 250 to 280 A.D.) ... the numbers in brackets at the end of each group (usually a moderate peak on the way back up to the next stronger group) will represent the duration of each grouping from the end of the previous one. There is no duration shown for the first of these (342 A.D.) since we don't know the end date of the previous grouping.
250?
260?
270?
280?
..................290
........................302
...............311
...............321
.........330
.........342
.....................354
.....................362
........................372
...............387
...............396
.........410
.........421 ( dur 77 yrs)
..................430
..................441
.....................452
.........465
..................479
...............490
........................501
.....................511
.........522 (dur 101 yrs)
.....................531
...............542
...............557
........................567
...............578
.....................585
............597
.........607 (dur 85 yrs)
...............618
............628
...............642
..................654
...............665
.....................677
.........689
.........699 (dur 92 yrs)
.....................714
.....................724
.........735
........................745
...............754
........................765
..................776
.........787 (dur 88 yrs)
..................798
.....................809
.........821
.....................829
........................840
..................850
...............862
.....................872
...............887
.........898
.........907 (dur 120 yrs)
...............917
........................926
..................938
............950
........................963
........................974
...............986
.........994 (dur 87 yrs)
.....................1003
...............1016
...............1027
.........1038
......1052 (dur 58 yrs)
...............1067
...............1078
...............1088
........................1098
............1110
........................1118
.....................1129
........................1138
.....................1151
............1160 (dur 108 yrs)
..................1173
..................1185
...............1193
........................1202
...............1219
...............1228
...............1239
............1249 (dur 89 yrs)
...............1259
...............1276
...............1288
.........1296
...............1308
...............1319
...............1324
.........1337
............1353 (dur 104 yrs)
........................1362
...........................1372
..................1382
...............1391
...............1402
......1413 (dur 60 yrs)
............1429
............1439
............1449
............1461
......1472
......1480
............1497
.........1505 (dur 92 yrs)
...............1519
........................1528
.....................1539
.....................1548
........................1558
........................1572
.....................1581
............1591
............1604 (dur 99 yrs)
...............1615
..................1629
............1639
......1649
......1660
.........1675
......1685
...1693
......1705 (dur 101 yrs)
.....................1718
........................1727
.....................1738
...............1750
...............1761
..................1769
........................1778
........................1787
......1801
......1816
............1830 (dur 125 yrs)
........................1837
.....................1848
..................1860
........................1870
.........1883
...............1893
.........1905 (dur 65 yrs)
..................1917
...............1928
.....................1937
........................1947
...........................1957
..................1968
........................1979
........................1989
..................2001
.............2013 (thus far 108 yrs)
...... ..... 2026 (hypothetical weak future peak would then be 121 yrs)
____________________________________________________________________
note: the 1794 shoulder peak is not used in this analysis
From this, we have the following durations not including the first or last groups (since we don't know if the 2013 peak might be the end date of this group, or whether another weak enough peak will follow to justify including it).
In order, the durations were 77, 101, 85, 92, 88, 120, 87, 58, 108, 89, 104, 60, 92, 99, 101, 125, 65, (108 or longer)
The average of those numbers (using the 108 this time) is 94 years. Each time this current grouping goes one more long cycle adds about one year to that average, so let's say 95 is the actual value. This could represent 8 cycles when there is no missing cycle and could be "normalized" as 6 eleven-year cycles followed by 2 fourteen-year cycles. However, no individual group would match this too precisely. It should also be noted that some of the earlier (pre-11th century mostly) groups have one weak cycle in among the arbitrarily defined strong period, so they tend to look a bit more like two 40-50 year groups than one 80 to 100 year group.
The actual clusters of strong and weak (including any weak that are among the strong so to speak) work out like this -- with overall averages from first to last strong as defined, and from last strong through the weak segment to next of the strong segment (for example, 290 to 321 over three, and 321 to 354 over three).
290 to 342 -- 4 and possibly more earlier strong, 2 weak (10.3, 11.0)
354 to 421 -- 5, 2 (10.5, 11.3)
430 to 522 -- 8, 1 (the 8 incl one weak in position 4) (11.6, 10.0)
... the weak cycle embedded in position 4 was 13 years after a strong cycle and 14 years before another, so this interval is distorted.
531 to 607 -- 6, 2 (10.8, 11.0)
618 to 699 -- 6, 2 (11.8, 12.3)
714 to 787 -- 7, 1 (the 7 incl one weak in position 3) (10.3, 11.0)
... in this case the weak embedded cycle stayed "on pulse" and did not distort the timing. perhaps it wasn't as weak as Schove found.
798 to 907 -- 8, 3 (the 8 incl one weak in position 3) (11.1, 11.0)
... also in this case the weak embedded cycle stayed "on pulse" but the average lengthened mostly towards the end of the strong period
917 to 994 -- 6, 2 (11.4, 10.7)
1008 to 1052 -- 3, 2 (12.0, 13.3)
1067 to 1160 -- 8, 1 (12.0, 11.0)
1173 to 1249 -- 7, 1 (11.0, 10.0)
1259 to 1353 -- 7, 2 (10.8, 12.7)
1362 to 1415 -- 5, 1 (10.0, 13.5)
1429 to 1505 -- 4, 4 (10.7, 11.6) -- Sporer minimum at end
1519 to 1604 -- 7, 2 (10.3, 11.3)
1615 to 1705 -- 3, 6 (12.0, 11.3) -- Maunder minimum mid to end
1718 to 1830 -- 8, 3 (9.9, 12.5) -- Dalton minimum at end
1837 to 1905 -- 4, 3 (11.0, 11.8)
1917 to 2013 -- 9, 1 (10.5, 12.0)
or if counted as 8, 2 (10.4, 12.0)
The long-term averages for strong and weak segments are 10.9 years and 11.5 years. Not every grouping has the same relationship, a few have either equal or reversed periods. In fact from 290 to 1249 A.D., the averages were exactly the same so it has only been in the past eight centuries that the difference has been established. This may be negated however if Schove missed as few as two cycles over the first 960 years (and both were strong peaks). So the evidence there is rather inconclusive. In the verifiable period from 1705 to 2013, the averages are 10.5 and 12.1 years. Because there are more strong peaks than weak, the overall period is 11.0 years.
While this is fairly regular cyclical activity for the Sun, the average number of weak cycles (consecutive, ignoring the few stranded solo cases among the strong cycles) appears to be 2.2, meaning that a third one is unusual and a fourth one is rare. In the analysis, I treated 2001 as a strong peak although it was weaker than 1979 or 1989 but when compared with other groups, it would have been included as last of the "strong" set rather than first of the "weak" group at the end. Thus we are just beyond the first peak of this weak interval and could reasonably expect a second weak cycle, likely weaker than 2013.
I have done some analysis indicating some possibility that there is a double cycle at play, of about 190 years. However, this adds little to the definition of variability achieved by the single 95 year cycle.
If there is any external cause and effect, and this is not just some function of the Sun's inner dynamics working through energy balances, then it is not so precise as to be easily attributable to any one set of planetary positions.0 -
This is the best fit I can produce for a postulated 180 to 200-year cycle in which there are usually two runs of active solar cycles followed by two runs of weaker cycles. The horizontal axis in each column gives the intensity (stronger to the right), and the vertical axis drops proportionately for intervals, although in a rather schematic fashion. The first interval arbitrarily starts forty years or four cycles before the actual records from Schove to account for the likelihood that an active period was underway with the 290 peak as shown (the 250 to 280 peaks are set at a moderate intensity).
...............250.?......... []..................430.........[]...............618..........[]..................798.......[].....................1003......[]
...............260.?......... []..................441.........[]............628.............[].....................809....[]...............1016............[]
...............270.?......... [].....................452......[]...............642..........[].........821................[]...............1027............[]
...............280.? .........[].........465..................[]..................654.......[].....................829....[].........1038..................[]
.................290..........[]................................ []...............665..........[]........................840.[]......1052.....................[]
........................302...[]..................479.........[].....................677.....[]..................850.......[]................................. []
...............311............[]...............490............[].........689.................[]...............862..........[]...............1067............[]
...............321............[]........................501...[].........699.................[].....................872....[]...............1078............[]
.........330..................[].....................511......[]...............................[]...............887..........[]...............1088............[]
.........342..................[].........522..................[].....................714.....[]..............................[]........................1098...[]
.....................354......[].....................531......[].....................724.....[].........898................[]............1110...............[]
.....................362......[]...............542............[].........735.................[].........907................[]........................1118...[]
........................372...[]...............557............[]........................745...[]...............917.........[].....................1129......[]
................................[]........................567...[]...............754...........[]........................926.[]........................1138...[]
...............387............[]...............578............[]........................765..[]..................938.......[].....................1151......[]
...............396............[].....................585......[]..................776........[]............950.............[]............1160...............[]
.........410..................[]............597...............[].........787.................[]........................963..[]..................1173........[]
.........421..................[].........607..................[]...............................[]........................974..[]..................1185........[]
................................[]................................[]...............................[]...............986...........[]...............1193...........[]
................................[]................................[]...............................[].........994.................[]
........................1202..[]............1429.............[]...............1615.........[]........1830....................[]
...............1219...........[]............1439.............[]..................1629......[]........................1837....[]
...............1228...........[]............1449.............[]............1639............[].....................1848.......[]
...............1239...........[]............1461.............[]......1649..................[]..................1860..........[]
............1249..............[]......1472...................[]......1660..................[]........................1870....[]
...............1259...........[]......1480...................[]...............................[].........1883...................[]
.....possible missing?....[]...possible missing?.....[].........1675...............[]...............1893.............[]
...............1276...........[]............1497.............[]......1685..................[].........1905...................[]
...............1288...........[].........1505................[]...1693.....................[]..................1917..........[]
.........1296.................[]...............1519..........[]......1705..................[]...............1928.............[]
...............1308...........[]........................1528.[].....................1718...[].....................1937.......[]
...............1319...........[].....................1539....[]........................1727[]........................1947....[]
...............1324...........[].....................1548....[].....................1738...[]...........................1957.[]
.........1337.................[]........................1558.[]...............1750.........[]..................1968..........[]
............1353..............[]........................1572.[]...............1761.........[]........................1979....[]
........................1362..[].....................1581....[]......................1769..[]........................1989....[]
...........................1372[]............1591............[]..........................1778[]..................2001........[]
..................1382.........[]............1604............[]........................1787.[].............2013..............[]
...............1391............[]...............................[]......1801...................[]
...............1402............[]...............................[]................................[]
......1413.....................[]...............................[]......1816...................[]
Intervals between similar features (best fit not always extreme peak or trough)
Peak of First strong cycle _____ 302, 479, 677, 840, 1003, 1202, 1461, 1629, 1837 ___ 177, 198, 163, 163, 199, 259, 168, 208 (mean 192)
Trough of First weakest cycle ____ 330, 522, 689, 898, 1110, 1296, 1480, 1693, 1893 ___ 192, 167, 209, 212, 186, 184, 213, 200 (mean 195)
Peak of Second strong cycle ___ 372, 567, 724, 974, 1138, 1372, 1572, 1778, 1957 __ 195, 157, 250, 164, 234, 200, 206, 179 (mean 198)
Trough of Second weakest cycle __ 410, 607, 787, 994, 1160, 1413, 1604, 1816, 2013 so far __ 197, 180, 207, 166, 253, 191, 212, 197 (mean 200).
This gives a mean of 196 years for the double cycle. The interval from peak of first to peak of second sub-cycle has been 70, 88, 147, 134, 135, 170, 111, 149 and 120 years, mean 125 years. The interval from trough of first weak interval to second trough has been 80, 87, 98, 106, 50, 117, 124, 123 and 120 (or more if weaker cycle than 2013 follows). The mean of those intervals is 101 years. This makes the cadence of the 196 year double cycle
peak + 40 yrs to trough + 85 yrs to peak + 35 yrs to trough + 36 yrs to restart
This establishes that the second peak (often a stronger one like 1778, 1957) builds up slower over a longer number of relatievly strong cycles.
The mean number of cycles involved then appears to be on this order:
5 strong, 3 weak, 8 strong, 3 weak
The Maunder minimum violated this substantially by starting a 200-year group with 3 moderate and 5 weak to missing. The 19th century and 20th century both followed the general rhythm.
There is some evidence that the nearly-200-year pulse has lengthened. It was an average of 175 years from 3rd to 11th centuries, then began a longer beat that has averaged closer to 210 years. During this longer pulse interval there have been generally higher amplitudes since 1300 than would be deduced from Schove's data from 290 to about 1300. The two strongest and weakest 50-year intervals all occur since 1300. (14th and 20th centuries very strong, 15th and 17th centuries producing Sporer and Maunder long-duration weak intervals).
This leads to some speculation (from me at least) that the Sun is slowly ramping up to some even more extreme amplitudes of activity and that it was in a more stable mode before 1300 than after 1300. You have to wonder what variations the Sun can produce although we are always told it's a relatively stable star unlikely to transition to something unexpected in the near term.0 -
Advertisement
-
My brain is melted after reading that0
-
This is the thing about solar variations, they are semi-regular in certain ways and therefore semi-predictable. But we don't quite have the theory to issue perfect forecasts for them. If we did, we might also have better long-range weather forecasting although it's not a given that one advance would lead to the other. This is why I'm interested, otherwise like who cares how many sunspots there are?0
-
The New Year begins with a spotless sun; in a run of 16 spotless days.
Wonder if we'll beat 2018's tally of 221 total spotless days?
Heading to an "MT Minimum" maybe?")
Happy New Year to all the weather & climate fan folks.0 -
Came accross the following listing of weather experienced in the Maunder Minimum.
http://wiki.iceagefarmer.com/wiki/History:_Extreme_Weather_during_the_Maunder_Minimum0 -
Today we have a spotless sun - in a 7-day stretch.
Will 2019 see a Solar Minimum? ...or a Grand Solar Minimum?0 -
Today we have a spotless sun - in a 7-day stretch.
Will 2019 see a Solar Minimum? ...or a Grand Solar Minimum?
It seems to have peaked, albiet based on a very small sample size
2019 total: 7 days (50%)
2018 total: 221 days (61%)
2017 total: 104 days (28%)
2016 total: 32 days (9%)
2015 total: 0 days (0%)
2014 total: 1 day (<1%)
2013 total: 0 days (0%)
2012 total: 0 days (0%)
2011 total: 2 days (<1%)
2010 total: 51 days (14%)
2009 total: 260 days (71%)
2008 total: 268 days (73%)
Edit: never mind, I'm not making sense") 0
0 -
Now 12 consecutive spotless days on the sun and 12 spotless days in total for 2019 so far.
Photography site - https://www.sryanbruenphoto.com/
Weather photo portfolio - https://sryanbruen.myportfolio.com/weather-1
0 -
I find the way spaceweather.com records the spotless days stats a bit misleading, what they really should be doing is having a couple of rolling trends.
For example "number of spotless days in the previous 60 days, 120 days & 240 days" or similar, then the downward or upward trend will show up clearly.0 -
-
Advertisement
-
12 days spotless in a row, running at similar levels to last year so far...
Current Stretch: 12 days
2019 total: 26 days (60%)
2018 total: 221 days (61%)0 -
Using spaceweather's rather unrealistic recording method, 2019 has already exceeded 2018 spotless days record.
Spotless Days
Current Stretch: 15 days
2019 total: 29 days (63%)
2018 total: 221 days (61%)
2017 total: 104 days (28%)
2016 total: 32 days (9%)
2015 total: 0 days (0%)
2014 total: 1 day (<1%)
2013 total: 0 days (0%)
2012 total: 0 days (0%)
2011 total: 2 days (<1%)
2010 total: 51 days (14%)
2009 total: 260 days (71%)
2008 total: 268 days (73%)
2007 total: 152 days (42%)
2006 total: 70 days (19%)
Updated 15 Feb 20190 -
It's funny that the extreme weather the last number of years is always related, ( as far as the IPCC and media are concerned ) to Anthropocentric Climate change, the Sun is not added to the equation and never will because the corrupt IPCC can not now accept any other forms of science because they feel that it's no longer up for debate and Co2 is the cause and won't even peer review anything that contradicts this theory because it's unlikely you could disprove the Co2 argument because you can't no more than you can actually prove it.
The IPCC relate rising Co2 to weather extremes and relay that as proof, "see we told you" Co2 goes up weather extremes = we were correct but you could also argue weather extremes = caused by low solar activity.
There is evidence to suggest that in the 1700's that low solar activity caused a lot of extreme weather events too.
The media won't comment much on the cold experienced this year in the Northern Hemisphere but are only too delighted to comment about heatwaves in Australia.0 -
A belief in gender identity involves a level of faith as there is nothing tangible to prove its existence which, as something divorced from the physical body, is similar to the idea of a soul. - Colette Colfer
0 -
silverharp wrote: »
Could indeed be true but the media will never buy it because the IPCC will claim it's junk science and that it does not come from climate scientists.
Or if they did acknowledge it, perhaps when half the planet is frozen they will say it's temporary and we'll roast in hell when temps come back up because of that O'l Devil, Co2.
Here's the real killer, because they said the science is solid about Co2 they won't allow any other evidence contract their theory that Co2 is causing the planet to warm at an alarming rate, to them it is not a theory.......0 -
I laughed when I read this quote.
“I hope global warning will be overridden by this effect, giving humankind and the Earth 30 years to sort out our pollution,” Zharkova told Sky News, adding that any possible downward impact on global warming will last until 2050s when the Sun's two magnetic waves become active again. “We have to be sorted by that time and prepare everything on Earth for the next big solar
It's as if Sky News told her " now remember what I told you, you have to mention Global Warming or we won't run the story"0 -
Advertisement
-
Deleted User wrote: »Could indeed be true but the media will never buy it because the IPCC will claim it's junk science and that it does not come from climate scientists.
Or if they did acknowledge it, perhaps when half the planet is frozen they will say it's temporary and we'll roast in hell when temps come back up because of that O'l Devil, Co2.
Here's the real killer, because they said the science is solid about Co2 they won't allow any other evidence contract their theory that Co2 is causing the planet to warm at an alarming rate, to them it is not a theory.......Deleted User wrote: »I laughed when I read this quote.
“I hope global warning will be overridden by this effect, giving humankind and the Earth 30 years to sort out our pollution,” Zharkova told Sky News, adding that any possible downward impact on global warming will last until 2050s when the Sun's two magnetic waves become active again. “We have to be sorted by that time and prepare everything on Earth for the next big solar
It's as if Sky News told her " now remember what I told you, you have to mention Global Warming or we won't run the story"
So the scientist is correct when she says that the change in solar radiation could lead to a mini-Ice Age, but she is wrong when she says that this only gives us a short window to deal with the global warming caused by carbon dioxide?0 -
So the scientist is correct when she says that the change in solar radiation could lead to a mini-Ice Age, but she is wrong when she says that this only gives us a short window to deal with the global warming caused by carbon dioxide?
Yeah probably because it was a BBC interview they probably insisted she acknowledge Global warming and to say that it's real etc etc.
Or she said it to gain respect/credibility with the climate alarmists, Corrupt IPCC etc.
If she came out and said global warming was BS the BBC would have ridiculed her and IPCC call her a lunatic and that her science was junk science.0 -
The thing I find most intriguing about all of the "global cooling" talk it that it was only a couple of years ago that anyone who even tried to discuss the possibilities of solar induced cooling would have been dismissed as a crank or a "denier".0
-
Deleted User wrote: »The thing I find most intriguing about all of the "global cooling" talk it that it was only a couple of years ago that anyone who even tried to discuss the possibilities of solar induced cooling would have been dismissed as a crank or a "denier".
Yes but she didn't deny global warming and this is a quote from the article.
“I hope global warning will be overridden by this effect, giving humankind and the Earth 30 years to sort out our pollution,” Zharkova told Sky News, adding that any possible downward impact on global warming will last until 2050s when the Sun's two magnetic waves become active again. “We have to be sorted by that time and prepare everything on Earth for the next big solar"
So she fully admitted global warming is real where as previous scientists may not have and were ridiculed, remember the IPCC no longer accept any views or so called scientific evidence to contradict the global warming because in their warped minds whether they believe it or not the establishment says it's real and that's the only thing that matters.
In other words , the IPCC can not now say maybe they were wrong because that would discredit them but they are already discredited after the climate gate scandal when even their own internal emails between colleagues admitted they didn't think it was real but it was all down played and the media bought it.
Look at all the rubbish the media come out with , every couple of months you hear " climate scientists bla bla bla" no matter how ludicrous it sounds the media go with it because it's a story and the media always love sensationalist headlines.
Remember the article in the British times was it that said something like , " by the year 2000 Children won't know what snow is" ?0 -
Deleted User wrote: »Yeah probably because it was a BBC interview they probably insisted she acknowledge Global warming and to say that it's real etc etc.
Or she said it to gain respect/credibility with the climate alarmists, Corrupt IPCC etc.
If she came out and said global warming was BS the BBC would have ridiculed her and IPCC call her a lunatic and that her science was junk science.
I find this difficult to believe.
The simple answer is that she is telling it all as she sees it, both the cooling effect in the short term and the short term interruption to global warming that it brings.0 -
Advertisement
-
It's the very concept of solar cooling that was considered "unthinkable" only a few years ago, it is now being openly discussed on mainstream media, unlike being dismissed as crank talk as it used to be.Deleted User wrote: »Yes but she didn't deny global warming and this is a quote from the article.
“I hope global warning will be overridden by this effect, giving humankind and the Earth 30 years to sort out our pollution,” Zharkova told Sky News, adding that any possible downward impact on global warming will last until 2050s when the Sun's two magnetic waves become active again. “We have to be sorted by that time and prepare everything on Earth for the next big solar"
So she fully admitted global warming is real where as previous scientists may not have and were ridiculed, remember the IPCC no longer accept any views or so called scientific evidence to contradict the global warming because in their warped minds whether they believe it or not the establishment says it's real and that's the only thing that matters.
In other words , the IPCC can not now say maybe they were wrong because that would discredit them but they are already discredited after the climate gate scandal when even their own internal emails between colleagues admitted they didn't think it was real but it was all down played and the media bought it.
Look at all the rubbish the media come out with , every couple of months you hear " climate scientists bla bla bla" no matter how ludicrous it sounds the media go with it because it's a story and the media always love sensationalist headlines.
Remember the article in the British times was it that said something like , " by the year 2000 Children won't know what snow is" ?
This is the point I am making, people are now thinking differently. And yes, it is only temporary.0 -
The point being the climate heats and cools has done for millions of years our influence if any would be negligible at worst.
We didn't cause the melting of the last ice age and that was a lot of ice.0 -
Deleted User wrote: »The point being the climate heats and cools has done for millions of years our influence if any would be negligible at worst.
We didn't cause the melting of the last ice age and that was a lot of ice.
That is not incompatible with us causing climate change.
Why did the climate heat and cool in the past? Sometimes it was caused by external factors, sometimes it was caused by tectonic plate movement, but sometimes it was caused by life on earth.
https://www.bgs.ac.uk/discoveringGeology/climateChange/general/causes.html
I fully accept that the climate has changed in the past, and that it will change in the future. Man-made greenhouse gases are pushing the climate in one direction. This research has shown that solar magnetic activity may be pushing the climate in another direction and they will cancel each other out over the very short term - a couple of decades - but that we will return to the global warming scenario then.
There is nothing in that research that disproves man-made climate change.0 -
Unless your talking about climate change on the sun your in the wrong thread.0
-
Fast approaching 08/09 levels at the moment with 20 days in a row blank -
Current Stretch: 20 days
2019 total: 34 days (67%)
2018 total: 221 days (61%)
2017 total: 104 days (28%)
2016 total: 32 days (9%)
2015 total: 0 days (0%)
2014 total: 1 day (<1%)
2013 total: 0 days (0%)
2012 total: 0 days (0%)
2011 total: 2 days (<1%)
2010 total: 51 days (14%)
2009 total: 260 days (71%)
2008 total: 268 days (73%)
2007 total: 152 days (42%)
2006 total: 70 days (19%)
Updated 20 Feb 20190 -
-
25 consecutive days on the blink now - A blank February thus far. 7 more days to match the longest blank streak from the last solar minimum I believe (32 days) - Certainly a possibility at this stage...
Current Stretch: 25 days
2019 total: 39 days (70%)
2018 total: 221 days (61%)
2017 total: 104 days (28%)
2016 total: 32 days (9%)
2015 total: 0 days (0%)
2014 total: 1 day (<1%)
2013 total: 0 days (0%)
2012 total: 0 days (0%)
2011 total: 2 days (<1%)
2010 total: 51 days (14%)
2009 total: 260 days (71%)
2008 total: 268 days (73%)
2007 total: 152 days (42%)
2006 total: 70 days (19%)0 -
A whole calendar month without Sunspots now, on par with 08' levels currently!
Spotless Days
Current Stretch: 28 days
2019 total: 43 days (73%)
2018 total: 221 days (61%)
2017 total: 104 days (28%)
2016 total: 32 days (9%)
2015 total: 0 days (0%)
2014 total: 1 day (<1%)
2013 total: 0 days (0%)
2012 total: 0 days (0%)
2011 total: 2 days (<1%)
2010 total: 51 days (14%)
2009 total: 260 days (71%)
2008 total: 268 days (73%)
2007 total: 152 days (42%)
2006 total: 70 days (19%)0 -
Any more news about that big flare ?0
-
We have a bit to run to come close to the longest blank streak from 08-09, I think it was actually 52 consecutive blank days, not 32 as mentioned above.0
-
Advertisement
-
BLIZZARD7 wrote:Spotless Days Current Stretch: 28 days 2019 total: 43 days (73%) 2018 total: 221 days (61%) 2017 total: 104 days (28%) 2016 total: 32 days (9%) 2015 total: 0 days (0%) 2014 total: 1 day (BLIZZARD7 wrote:A whole calendar month without Sunspots now, on par with 08' levels currently!
Is there an archive on spaceweather where you could pull up a similar list to the above for say the last 50+ years?0 -
List of years with most consecutive spotless days.0
-
-
Photography site - https://www.sryanbruenphoto.com/
Weather photo portfolio - https://sryanbruen.myportfolio.com/weather-1
0 -
This solar minimum looks like it's going to be really deep as predicted.http://spaceweather.com/
A MONTH WITHOUT SUNSPOTS: There are 28 days in February. This year, all 28 of them were spotless. The sun had no sunspots for the entire month of Feb. 2019. This is how the solar disk looked every day: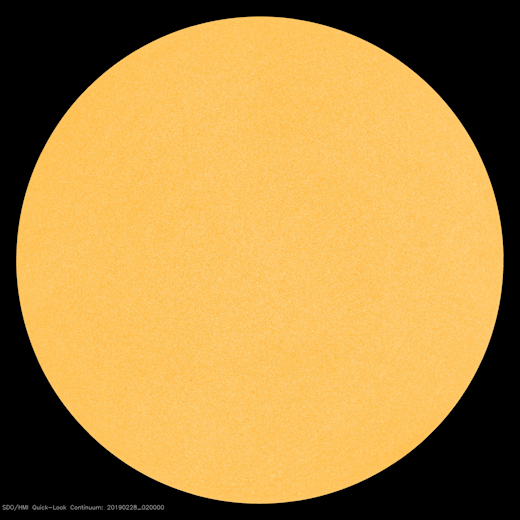
The last time a full calendar month passed without a sunspot was August 2008. At the time, the sun was in the deepest Solar Minimum of the Space Age. Now a new Solar Minimum is in progress and it is shaping up to be similarly deep. So far this year, the sun has been blank 73% of the time--the same as 2008.
Edit:
just to add this 0
0 -
Definitely looking like a deep one - Running at 75% blank so far for 2019, Day 32 in a row. Radio Sun: SFU @ 70
Current Stretch: 32 days
2019 total: 47 days (75%)
2018 total: 221 days (61%)
2017 total: 104 days (28%)
2016 total: 32 days (9%)
2015 total: 0 days (0%)
2014 total: 1 day (<1%)
2013 total: 0 days (0%)
2012 total: 0 days (0%)
2011 total: 2 days (<1%)
2010 total: 51 days (14%)
2009 total: 260 days (71%)
2008 total: 268 days (73%)
2007 total: 152 days (42%)
2006 total: 70 days (19%)0 -
List of years with most consecutive spotless days.
Well we've matched the last solar cycle's consecutive blank run going off this, only problem with this stat is there hasn't been a consistent method of recording sunspots historically and so theres some argument over these counts.
There's no doubt this is a deep minimum though and the next 6-12 months should be quite telling in just how sharp a decline we are looking at this time.0 -
I take it then Blizzard your interest in the sunspot numbers is because you believe it will effect our future weather?
Percentage wise how big an influence do you believe this to be if we are indeed heading into a deep solar minumum, and what years do you believe it will be most felt?0 -
I am hoping there is a lag effect which means the winter of 2019/20 will be a cold one.0
-
Advertisement
-
I take it then Blizzard your interest in the sunspot numbers is because you believe it will effect our future weather?
Percentage wise how big an influence do you believe this to be if we are indeed heading into a deep solar minumum, and what years do you believe it will be most felt?
I'm interested in the potential link yes, The evidence is strongest for the deepest minimums and so I would like to see as quiet a minimum as possible to see any potential effect on our weather.
If this is the long and very deep minimum some believe we are just slipping into then I would expect a notable impact on our climate into the early 2020's. Winter 19/20 as the kick-off point. This would fit fairly well timing wise with the last minimum in 08/09- as Nacho Hope's above, there does seem to be a slight lag.
Next winter can hardly be anything but colder than this just gone though, I'd be taking note of anything exceptional. It won't be apparent for a few years if this is actually what is going on or if there are other factors at play. A big volcanic eruption in the next few years would make it hard to draw conclusions for example.
So yeah I'm interested to see A) are we slipping into a grand minimum? And") What affect will this have on our climate? if any.
What affect will this have on our climate? if any.
Hard to put a percentage on it but I would absolutely expect our climate to be notably cooler soon if we are indeed heading into a grand solar minimum. (Also interested to see how this might play out against the fact the earth is currently warming)0


![[Deleted User]](/applications/dashboard/design/images/defaulticon.png)


Advertisement