Advertisement
If you have a new account but are having problems posting or verifying your account, please email us on hello@boards.ie for help. Thanks :)
Hello all! Please ensure that you are posting a new thread or question in the appropriate forum. The Feedback forum is overwhelmed with questions that are having to be moved elsewhere. If you need help to verify your account contact hello@boards.ie
Hi all! We have been experiencing an issue on site where threads have been missing the latest postings. The platform host Vanilla are working on this issue. A workaround that has been used by some is to navigate back from 1 to 10+ pages to re-sync the thread and this will then show the latest posts. Thanks, Mike.
Hi there,
There is an issue with role permissions that is being worked on at the moment.
If you are having trouble with access or permissions on regional forums please post here to get access: https://www.boards.ie/discussion/2058365403/you-do-not-have-permission-for-that#latest

2020 officially saw a record number of $1 billion weather and climate disasters.

1222325272851

Comments

  • Registered Users, Registered Users 2 Posts: 2,855 ✭✭✭Nabber


    If past historical records have uncertainty about them, wouldn’t it also be expected to see them be broken, would it not also be irrelevant in reporting ‘record’ breaking weather?


    The real hypocrisy in the thread is those who pledge allegiance to AGW theory but do nothing about it or worse still live an ignorant self indulgent life style thinking that their 30% less emissions transport is some how superior. Separating their glass by colour only for it to be shipped off the island, or was their jam jars before recycling… the list goes on.

    The arrogance is unbearable. RTE fly a crew over to a Forrest fire in Greece to tell their audience it’s caused by carbon emissions. The irony of the whole thing.


    Our very own Eamon Ryan is surely an” plant by some petroleum company. That guy is as green as oil.


    The complete lack of investment into nuclear is downright criminal. The move away from carbon is to further disproportionately tax low to middle income.

    The mismanagement by individuals, scientists, business and Governments is crippling.


    For folks like Akrasia, 297,000 children under five die every year from diarrhoea alone. But hey let’s ignore that and focus on the modelled predictions. Let’s not invest a fraction of the wealth of green energy into fixing that issue. At least the AGW Messiah Attenborough can take some comfort in population reduction 😂😂


  • Registered Users Posts: 3,328 ✭✭✭Banana Republic 1


    You’ve just said that whatever record was set 150 years ago. The whole point about climate change is that these records that once where broken every century are now being broken or are approaching the old record every single day/year now and that is because there’s more energy in the system due to GHG.


  • Registered Users, Registered Users 2 Posts: 8,219 ✭✭✭Gaoth Laidir


    I'm still no wiser as to whether you think there's an anomaly with that station's data or not.

    Your point in the shifting bell curve may be valid, but it is still separate to the fundamental issue of attribution of individual events. You freely admit that you no longer need the attribution process as "everyone knows it [insert weather event here] is due to agw. You're using the shifting bell curve theory to blanket-bomb every event with the agw stamp, putting all your faith in model projections that you know admit are so bad that they're underestimating the problem. If that's the case it just proves what I say, the science is far from settled.


  • Registered Users, Registered Users 2 Posts: 8,219 ✭✭✭Gaoth Laidir


    Something that must be considered when comparing historical records is the effect of differences in radiation shields compared to conventional Stevenson Screens. Smaller multi-layer shields can show differences of several degrees in times of high solar radiation and light winds. I know I'll get attacked for stating the above so let me show the data.

    Compare Wednesday's max temperatures of the agrimet stations (small shield, first map) to those of the standard synoptic stations (Stevenson Screens, second map). The synoptic network is less dense but all stations are several degrees below the agrimet ones.

    This study investigated the difference between a the two types of shield and found a large spike (2 - 2.5 degrees) in the smaller shield (Type A below) during early afternoon, when solar radiation was at its peak.

    Between 1300 and 1500, when global solar radiation averaged 935 W m2 and wind speed 2 m/s, both the standard deviation and the range of temperature in the Stevenson screen were smaller than comparable values for the two commercial screens: 0.39 and 1.72 °C, respectively, compared with 0.51 and 2.42 °C for screen ‘type B’, and 0.65 and 3.16 °C for screen ‘type A’. The time lag is illustrated in Figure 10: following sunrise, temperature in the lightweight commercial screen increases more rapidly than in the Stevenson screen, resulting in a temperature difference of up to 2 °C.

    For most of the day, temperatures from the Stevenson screen remain about 1.5 °C lower. As solar flux decreases in the afternoon, the lightweight screen cools more rapidly, and the temperature difference is eroded.

    Statistical analysis may not always reveal the full extent of differences between the Stevenson screen and modern gill-type screens. Table II shows typical statistical values for temperatures recorded in the Stevenson screen, in the two commercial screens and in a mechanically aspirated double-barrelled shield used as a reference on a sunny day. with light but fairly constant winds of about 1–2 m/s. As in the previous experiment, there is no ‘absolute’ reference temperature. However, it was considered that an air speed of about 6m/s over both surfaces of the interior shell of the mechanically aspirated shield was sufficient to ensure that the temperature of this shell would be very close to that of the air, resulting in negligible radiant heat transfer from the environment.

    Differences between the temperatures recorded in the different screens appear to be quite small – maximum, minimum and mean daily temperatures were about 0.3–0.5 °C higher in the naturally ventilated screens than in the mechanically aspirated one. Yet, as Figure 10 shows, the temperature error in screen ‘type A’ (defined as the difference relative to the aspirated, double-walled screen) was in fact not negligible for most of the day: it was greater than 1 °C for most of the sunshine hour, and exceeded 2 °C for part of the time.


    With the proliferation of these newer automated weather stations and their use in setting records, it would stand to reason that an increasing trend in records being broken may result. Now Akrasia will no doubt fob this off as me "furiously backpeddalling", but for most of the year and in most places, these difference may not amount to much. But in extreme cases, that is where these differences will be highlighted.

    But again, I'm sure the WMO know this and consider it in their records...


  • Registered Users, Registered Users 2 Posts: 8,219 ✭✭✭Gaoth Laidir


    Every single day? So if a record is old we should just look to break it as the agw theory says it should no longer be standing?


  • Advertisement
  • Registered Users, Registered Users 2 Posts: 2,930 ✭✭✭Spudmonkey


    I'm just curious GL what exactly your position is. Are you not convinced human-induced climate change is a thing? Or you do but you're not convinced of the effects?


  • Registered Users, Registered Users 2 Posts: 8,219 ✭✭✭Gaoth Laidir


    Human-induced warming is a thing, no doubt, but it's the automatic attribution of every piece of weather, never mind severe event, to agw that I have a problem with. It seems that weather now only happens due to ghc and the normal storms, warm days, cold days, droughts and floods are all now the nasty results of extra CO2. Unlike how Akrasia can question the current 150-year old Ireland record, I am somehow a villain for pointing out observations.


  • Registered Users, Registered Users 2 Posts: 2,855 ✭✭✭Nabber


    Also the attribution of AGW impact is sorely disappointing.


    Take the Greece fires as example, it’s portrayed in the media that AGW is the only contributor to the fires. Without AGW Greece would be fire free, which is simply not true. There is no concerted effort from the scientific community to admonish the media and fanatical groups/politicians for misrepresentation and fear mongering.

    Almost everyone in this thread wants change, some just don’t buy into the hyperbole.

    Myself, I don’t think Carbon is the sole driver, nor do I believe net emissions is a panacea to our problems.


  • Registered Users, Registered Users 2 Posts: 6,238 ✭✭✭Oneiric 3


    "There is no concerted effort from the scientific community to admonish the media and fanatical groups/politicians for misrepresentation and fear mongering". - Nabber.

    When you have big science, big media and big corps all on the same side as the right-wing neoliberal establishment, I become concerned.

    In other news, climate hero Joe Biden, when he isn't busy slaughtering and bombing the crap out of innocent Arab peoples, is now running bowl in hand to them for more oil... all this as he shuts down pipelines in his own country.

    U.S. calls on OPEC and its allies to pump more oil | Reuters

    But wait, I thought fossil fuels were evil Joe? Didn't you, in your presidential campaign, want to jail those who promoted fossil fuels?

    New Moon


  • Registered Users, Registered Users 2 Posts: 14,477 ✭✭✭✭Thelonious Monk


    July 2021 hottest month worldwide on record, beating September 2020. Yikes.


  • Advertisement
  • Registered Users Posts: 3,328 ✭✭✭Banana Republic 1


    At what point will you pull your kitchen sink out and post it up.


  • Registered Users, Registered Users 2 Posts: 4,665 ✭✭✭jackboy


  • Registered Users, Registered Users 2 Posts: 6,238 ✭✭✭Oneiric 3


    Terrifying!

    "It was 0.02 of a degree F (0.01 of a degree C) higher than the previous record set in July 2016, which was then tied in 2019 and 2020" - NOAA

    New Moon


  • Registered Users, Registered Users 2 Posts: 3,633 ✭✭✭Pa ElGrande


    Net Zero means we are paying for the destruction of our economy and society in pursuit of an unachievable and pointless policy.


  • Registered Users Posts: 3,328 ✭✭✭Banana Republic 1


  • Registered Users, Registered Users 2 Posts: 22,597 ✭✭✭✭Akrasia


    If you really accept AGW can you tell me which weather events that you believe were caused by climate change

    cause all I ever see from you is you challenging every single attribution


  • Registered Users, Registered Users 2 Posts: 22,597 ✭✭✭✭Akrasia


    Joe Biden is not a strong leader. And I don’t believe he has fully grasped the enormity of the climate change crisis


  • Registered Users, Registered Users 2 Posts: 6,238 ✭✭✭Oneiric 3


  • Registered Users, Registered Users 2 Posts: 22,597 ✭✭✭✭Akrasia


    Of course they did, his opponent was Donald Trump.


  • Advertisement
  • Registered Users, Registered Users 2 Posts: 6,238 ✭✭✭Oneiric 3


    And the difference between Biden and Trump is...?

    A: None. Here is VP Harris, under full approval of science hero Biden, regurgitating Trump's message almost word for word:

    'Because he's not Trump' is as lame and shallow as excuse as I have ever heard. Do better.

    New Moon


  • Registered Users, Registered Users 2 Posts: 17,964 ✭✭✭✭Thargor


    Looks like your political analysis is on a par with your ability to analyse what the evil scientists are up to this week...

    Everything you come out with is just so off the wall and twisted, have you ever thought about speaking to a professional? You genuinely sound like you need to.


  • Registered Users, Registered Users 2 Posts: 2,855 ✭✭✭Nabber


    On July 30, 1876 and August 4, 1881, temperatures of 51 °C (124 °F) and 50 °C (122 °F)[1] were both reported for Seville: these readings are unreliable, since they were measured under a standard exposure and in poor technical conditions.[2] A temperature of 48.8 °C (119.8 °F) was also recorded at Cazalla de la Sierra on August 30, 1926, but is generally not considered valid by international standards,

    More drunk people operating weather stations! Guess you got to do something to pass the time.


    Fair play to Joe.ie "UNVERIFIED" "possibly" https://www.joe.ie/news/unverified-temperatures-48-8c-reported-sicily-possibly-highest-ever-recorded-europe-728377

    Unverified temperatures of 48.8C reported in Sicily, possibly the highest ever recorded in Europe


    Compared to RTE

    New heat record in Italy as anticyclone 'Lucifer' sweeps in


    State funded media showing no bias at all there. 🤑


  • Registered Users, Registered Users 2 Posts: 6,238 ✭✭✭Oneiric 3


    I'm not sure records, past or present, prove anything either way though. We had a 10 day heatwave here in this country recently and no max temp records were broken, but the sheer duration of the heatwave was historically noteworthy.

    Edit:

    Compared to RTE

    New heat record in Italy as anticyclone 'Lucifer' sweeps in


    State funded media showing no bias at all there. 🤑 - Nabber.

    Southern Italy was under a slack trough, not a luciferin Anticyclone when that temp was reached:

    Media, eh?

    New Moon


  • Registered Users Posts: 3,328 ✭✭✭Banana Republic 1


    So what else is driving climate change is there like a Bond villain with a weather machine or something.


  • Registered Users, Registered Users 2 Posts: 4,665 ✭✭✭jackboy


    Industrial scale destruction of habitats may also be having an impact.


  • Registered Users, Registered Users 2 Posts: 2,855 ✭✭✭Nabber


    They do show the manifestation on potential weather. The energy and technology required to arcuately model and predict global weather patterns at local and global scales don't exist. We can look at past weather as an example of possibilities.

    Current record in Greece, there is no reason to believe that it wouldn't be beaten with or without AGW. Arkasia's bell curve moving is a the most likely outcome of a warming planet, but we lack the understanding and technology to determine what weather is natural and what is not.

    We know that 50 year events are an estimation and not approximation, so if ten events happen in a 50 year span, do we determine 9 are irregular and 1 is regular, if so how do we identify the naturally occurring event? Which is a concern raised in here somewhere (Currently all weather disasters are attributed to AGW) Record heat isn't 100% validation of a models accuracy, particularly when the model is only inferring more heat means more extreme. The heat in Europe could be natural, then again it might not.

    Disproving one or the other seems to be the premise of this thread.

    Poster 1: The earth is warming and these weather events prove it

    Poster 2: I agree the earth is warming, but prove this weather is not just natural

    Poster 1: 1 in XX year events are happening with more frequency

    Poster 2: That is not proof it's not natural


  • Registered Users, Registered Users 2 Posts: 8,219 ✭✭✭Gaoth Laidir


    I don't challenge every single attribution. I challenge every single automatic knee-jerk attribution by all and sundry with column inches to fill or funding to secure. Then there's the recent express attribution method, where the middle man is cut out and everything of note is now assumed agw because of the balance of probabilities. Sound familiar?

    Yesterday I outlined why some of the trends we see may be due to other reasons unrelated to atmospheric composition. It took a lot of energy to do all that backpedalling but it seems to have evaded the usual wrath. I wonder if that might mean there's something to it.


  • Registered Users, Registered Users 2 Posts: 2,855 ✭✭✭Nabber


    Are you trolling?


    I can never tell with your contributions.


  • Advertisement
  • Registered Users Posts: 3,328 ✭✭✭Banana Republic 1


  • Registered Users, Registered Users 2 Posts: 6,238 ✭✭✭Oneiric 3


    Tip: It is when you do invoke the wrath of those on here that is proof that you are onto something. The same, automated responses from different named bots that never offer any evidence of what they accuse, but instead just play the man. I'll give Akrasia one thing, (whom I don't include in the above) in that he at least tries to get it.

    But with the others, I'm only getting started...

    New Moon


  • Registered Users Posts: 3,328 ✭✭✭Banana Republic 1


    As per my question to nabber what are these other things. Was that the post stating the housings for the weather stations were better in the old days, come on seriously….


  • Registered Users, Registered Users 2 Posts: 6,238 ✭✭✭Oneiric 3


    Thinking about records lately, I get what you are saying Nabber, but do single point records at one station really prove anything? Surely what would be more significant is if a number of records, even in the same general region went at the same time, would prove to be more substantial in the case for AGW? Single point records, as GL indirectly referred to above, may be just as likely to be down to local factors as they would be something more nefarious. And not just in terms of heat records either, but cold ones to.

    New Moon


  • Registered Users, Registered Users 2 Posts: 2,855 ✭✭✭Nabber


    Keeping with form your contributions was neither funny nor valuable.


    To answer both your questions one with logic you can comprehend another that you’ll likely ignore.


    Is it a bond villian?

    Surely OPEC is the Bond villain?


    What else is it?

    CO2 is considered the largest factor. Others include CH4, N2O, PFC, HFC, SF6

    There are also other factors we don’t fully understand the impact human activities have had. Deforestation impact on local climates, vegetation loss, largely paved cities, Aqua mining, swamp/bog drainage. Also pollutants destroying coral and stimulating harmful algae blooms, damaging eco systems.

    Current weather/climate models account for ground and soil moisture poorly and struggle with cloud influences. Which is fine, technology starts somewhere trial and error.


  • Registered Users, Registered Users 2 Posts: 6,238 ✭✭✭Oneiric 3


    I asked you a question a few days back before you disappeared for a few days that you probably didn't see. But I'll ask it now since you are back with us:

    What are you doing to help negate the 'climate emergency'? We need some inspiration and motivation, so it seems logical to ask you, as you are one who preaches the loudest, to what your personal 'to dos' are in this regard.

    New Moon


  • Advertisement
  • Registered Users, Registered Users 2 Posts: 22,597 ✭✭✭✭Akrasia


    You ignored my question so here it is again. You say you accept climate change is real. Which weather events do you accept have been caused by climate change


  • Registered Users, Registered Users 2 Posts: 22,597 ✭✭✭✭Akrasia


    All of our current weather is caused by climate change

    just Like how my great grandparents choice of partner affects all of the future generations, adding enormous amounts of energy to the biosphere/oceans/cryosphere affects all weather everywhere


    but not to let Gaoth Laidir off the hook, he accepts the planet is warming, but what weather events does he accept would have been much less likely to occur on a colder planet?


  • Registered Users, Registered Users 2 Posts: 22,597 ✭✭✭✭Akrasia


    Ok so which notable events do you think were directly linked to climate change?

    if the answer is all of them, then you agree with me, if the answer is none of them, then your claim that you do accept climate change is a lie, so I expect specific examples


  • Registered Users, Registered Users 2 Posts: 22,597 ✭✭✭✭Akrasia


    BR asked a reasonable question. You could try answering his questions instead of deflecting with non answers.


  • Registered Users, Registered Users 2 Posts: 8,219 ✭✭✭Gaoth Laidir


    There is a signal of increased CO2 in most severe events, but it's the extent of this that I'm at odds with, the claim that it's 100%. I don't believe that it is that high as I believe that other much stronger factors, such as synoptics, local station attributes, increased station density, changes in land-use, etc. have by far the largest influence. I've yet to see hard detailed evidence of the how, for example, increased CO2 and nothing else actually caused the extra 6 degrees of heat in Canada, or how it caused that low to slow down over Germany. Stalling weather patterns are nothing new. The oldest textbooks detail the link between wavenumber and progressive and retrogressive patterns.

    Met Éireann tweeted that Ireland's rainfall has increased by 6% in 1989-2018 versus 1961-1990. I would argue that most of that is due to the positive AMO from the mid-90s. Is some due to anthro warming? Most likely, but a warmer world does not automatically mean higher rainfall in a place like Ireland.


  • Advertisement
  • Registered Users, Registered Users 2 Posts: 22,597 ✭✭✭✭Akrasia


    your answer indicates to me that you’re just playing lip service to a claim that you do not deny climate change is happening. Do you accept that the earth has warmed by about 1.1c relative to pre-industrial averages?

    If not, how much do you think it has warmed and what peer reviewed data can you point to to support this?

    You also fundamentally miss the point of AGW

    AGW doesn’t mean that the AMO or the Synoptics, or land use changes etc, do not affect the weather. All of the natural variability and other human factors still drive the weather. The human ghg emissions don’t account for all of the heat in a heatwave. There could have been a heatwave in British Colombia without AGW, it could even have been a record breaking one, but the CO2 signal added heat to that heatwave and also affected things like how long it persisted and where it occurred.

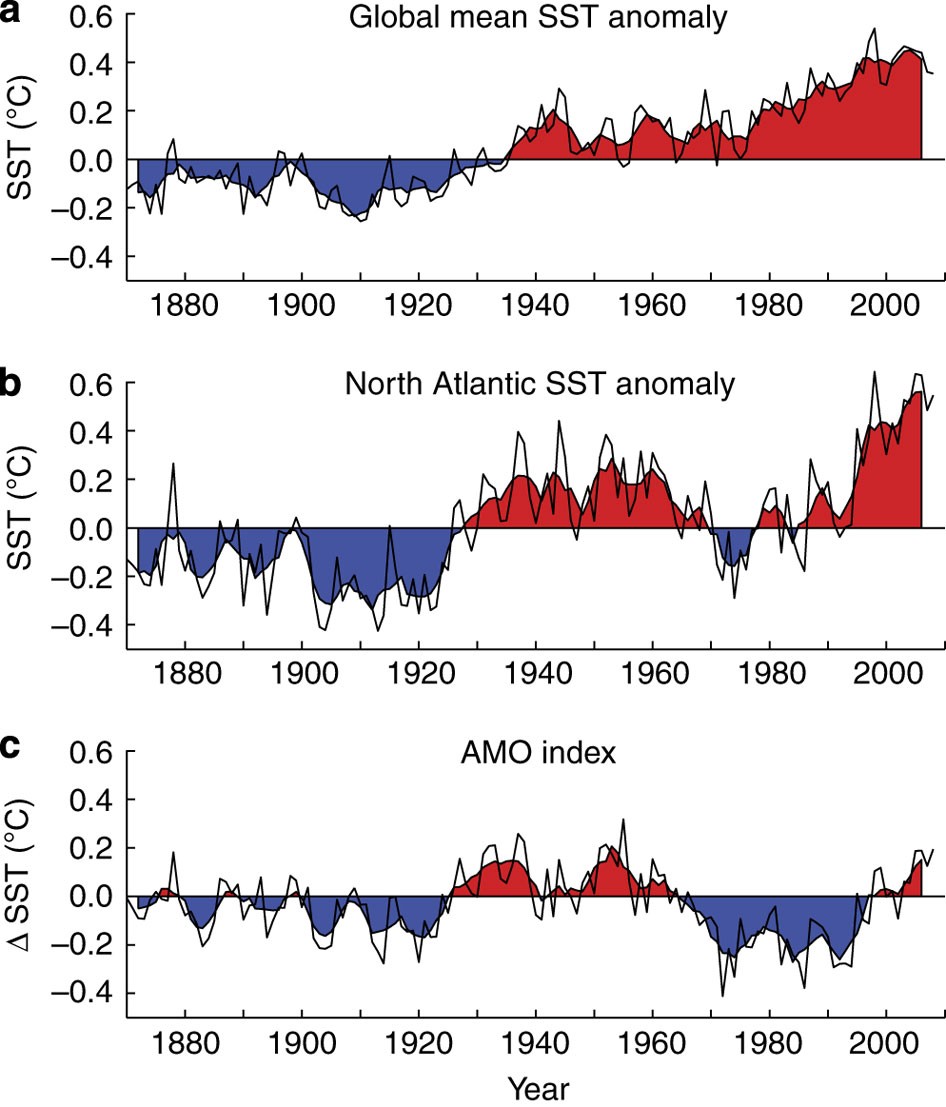
    you talk about the AMO as being a driver of weather, climate change has absolutely overwhelmed the AMO ‘signal’

    SSTs are so much warmer now that to see an AMO trend at all, you need to subtract the AGW related element from the observations to see where we would be in the AMO cycle without AGW

    https://www.nature.com/articles/ncomms1186/figures/1

    AGW now dwarfs the AMO, so if you believe the AMO is a significant driver of weather events and extremes, then surely AGW is an even bigger driver than the AMO was?

    no climate scientist thinks the C02 signal is the only factor in the weather, all the Synoptics still matter, but those Synoptics are affected by the enormous amounts of energy added to the planet because we have inadvertently geo-engineered our atmosphere


  • Registered Users, Registered Users 2 Posts: 2,855 ✭✭✭Nabber


    Should have been clearer in my post. My point was that with or without AGW we would expect to see all weather records exceeded or challenged eventually. Differing AGW from natural is not possible, only the probability that we have influenced extreme weather.


    I did answer. Also answered the Bond Villain question


    Yet the old day data is used to show the planet was cooler. Can't have your cake an eat it!

    When you say climate change are you referring to AGW?

    In the same instance are you saying pre industrial levels of CO2 will mean folks don't have to worry about flooding, heat waves, forest fires ect? Perhaps you could briefly outline your idea of what the planet would look like (weather-wise) if we could have a climate you feel reduced CO2 would bring. (assuming lasting effects and run away climate are negated)


  • Registered Users, Registered Users 2 Posts: 6,238 ✭✭✭Oneiric 3


    BR is quick to ask (demandingly) many question, but very slow to answer them himself.

    I have to ask: Why?

    New Moon


  • Registered Users, Registered Users 2 Posts: 8,219 ✭✭✭Gaoth Laidir


    I seriously question some of the data that are included in making that 1.1 degrees figure, for reasons such as outlined in my post from the other day. You have still not commented on that, good or bad, but if increasing numbers of different types of stations are increasingly being included in land temperature records then it stands to reason that this figure will be falsely inflated.

    You said (re. the Canadian heatwave)

    the CO2 signal added heat to that heatwave and also affected things like how long it persisted and where it occurred.

    Exactly how much extra heat did 140 ppm of extra CO2 add, given that we don't really know what ECS is? What's the formula for calculating it?

    Regarding SST, let's take a look at the chart in the recently published State of Ireland's Climate 2020, in which they showed data for Malin Head up to 2018 (not sure why not include 2019 and 2020). In any case, given my extensive skills at inserting datapoints on charts 😉, I've added the 2020 data in orange (11.25, from here, not yet quality controlled). I can't find 2019 data anywhere, but from the second graph on that met.ie page it looks slightly higher than 2020, with 2021 so far coming in below 2020).

    Your charts only goes up to 2008. The Met Éireann report chose to quote the anomaly for period from 2009, with no word on the most recent trend, which would appear to be flat. The AMO increased during the mid-1990s and the SST followed. The AMO has remained flat positive since, as has the SST. Only one station, but I didn't choose it. They also didn't show data for the previous positive AMO phase pre-1960, which is a pity, as it would probably have shown a positive SST anomaly too. That wouldn't suit the narrative, though. I think it's pretty clear that the AMO is the dominant factor in our SST, which in turn will have an effect on temperature and rainfall.

    But let's talk about sea level, which they also reference in the report. They strangely show no timeseries for that but say that

    "Satellite observations indicate that the sea level around Ireland has risen by approximately 2-3mm/year since the early 1990s"

    and that

    "Analysis of sea level data from Dublin Bay suggests a rise of approximately 1.7mm/year since 1938 which is consistent with global average rates."

    There is no mention of the shorter-term trends within this data series, which show high variability, especially since 2016 in Dublin. Further afield, Malin Head doesn't have an up-to-date dataset available here (unless someone knows of another source), but there's not much of a longterm upward trend up to 2002 anyway.

    Nearby Portrush has a better series. It shows a trend of ~0.9 mm/yr from 1995-2020, which is significantly less than the 2-3 mm quoted. I know different places have different rates, but the data would suggest it's a lot more complicated than is being expressed in that climate report.


  • Registered Users Posts: 3,328 ✭✭✭Banana Republic 1


    All of those can be placed under the banner of human activities or to put it another way, there anthropogenic, so in actual fact you are in full agreement with me Akrasia and the IPCC and indeed most of the world. 😏

    Anthropogenic means caused by or produced by humans!


  • Registered Users, Registered Users 2 Posts: 6,238 ✭✭✭Oneiric 3


    If 'most of the world' is in full agreement with you, then why are you on a small Irish weather forum defending what most of the world already agrees with you on?

    New Moon


  • Registered Users, Registered Users 2 Posts: 8,219 ✭✭✭Gaoth Laidir


    Just to whinge a bit more about local station effects. This is the actual Siracusa station that reported 48.8 C last week.

    The temperature sensor shield is highlighted. It's sitting a few cm directly above a horizontal metal pole, which itself is attached to a vertical pole containing the large datalogger unit.

    In most cases the effects of these nearby artificial surfaces would be negligible, However, when you get to talking about those extreme cases, these effects must become significant. The horizontal metal pole is likely to be a significant source of heat, especially as it's right below the sensor. Similarly the nearby datalogger, which is a box of electronics which itself will heat up inside, however the outer housing, despite being white, will still be a source of heat. I can't touch my balcony railings, coated with white PVC, in Sardinia during the middle of the day. There is also a dark green railing immediately surrounding the sensors.

    Zooming out a little, this is the immediate local site. A small road and thick concrete wall are just a few metres away. Again, I know from experience how hot those types of walls get during the afternoon.

    Even the ground gets extremely hot in this setup at this time of the year. The Google Map image above is from July 2019 and shows fairly bare and scorched ground. There is still come green in that image, but it is more likely to be completely devoid of any green grass at this time of the year, as is currently the case in Sardinia. My nearest station there was reporting maximum surface temperatures (T-Superficiale) of up to 48 C last week while air temperatures (T-aria) were up to 40 C. We would not see such high surface temperatures if covered in green grass.

    The other stations in the Siracusa region, while still high, didn't reach the same highs. The hottest, Lentini, was around 2 degrees lower (46.9 C) It's still almost 40 km away from the Siracusa station, but is only 5 km from Catania Sigonella airport to its north and a similar distance inland. It reached a max of "only" 44.4 C on the same day. That's a significant difference of 2.5 degrees.

    The point of all this is that extreme temperatures are the focus of much of the talk about climate change, however little consideration is given to the points above.


  • Registered Users, Registered Users 2 Posts: 8,219 ✭✭✭Gaoth Laidir


    I believe I was accused of "shifting the goalposts" a few days ago. I think if you and I both made it to the Olympics I'd stand no chance of a medal after this post of yours.


  • Registered Users, Registered Users 2 Posts: 6,238 ✭✭✭Oneiric 3


    Just from a southern Italian perspective, how did this recent heatwave, in terms of both overall intensity and duration, compare with other heatwaves in the (recorded) past in the region? As it is well known that Italy is prone to some of the most extreme weather in Europe, and not just regarding heat.

    New Moon


  • Registered Users Posts: 3,328 ✭✭✭Banana Republic 1


  • Advertisement
Advertisement