Advertisement
If you have a new account but are having problems posting or verifying your account, please email us on hello@boards.ie for help. Thanks :)
Hello all! Please ensure that you are posting a new thread or question in the appropriate forum. The Feedback forum is overwhelmed with questions that are having to be moved elsewhere. If you need help to verify your account contact hello@boards.ie
Hi all! We have been experiencing an issue on site where threads have been missing the latest postings. The platform host Vanilla are working on this issue. A workaround that has been used by some is to navigate back from 1 to 10+ pages to re-sync the thread and this will then show the latest posts. Thanks, Mike.
Hi there,
There is an issue with role permissions that is being worked on at the moment.
If you are having trouble with access or permissions on regional forums please post here to get access: https://www.boards.ie/discussion/2058365403/you-do-not-have-permission-for-that#latest

The sun is dead!! Mini iceage???

11314161819

Comments

  • Registered Users Posts: 700 ✭✭✭bazlers


    BLIZZARD7 wrote: »
    I'm interested in the potential link yes, The evidence is strongest for the deepest minimums and so I would like to see as quiet a minimum as possible to see any potential effect on our weather.

    If this is the long and very deep minimum some believe we are just slipping into then I would expect a notable impact on our climate into the early 2020's. Winter 19/20 as the kick-off point. This would fit fairly well timing wise with the last minimum in 08/09- as Nacho Hope's above, there does seem to be a slight lag.

    Next winter can hardly be anything but colder than this just gone though, I'd be taking note of anything exceptional. It won't be apparent for a few years if this is actually what is going on or if there are other factors at play. A big volcanic eruption in the next few years would make it hard to draw conclusions for example.

    So yeah I'm interested to see A) are we slipping into a grand minimum? And B) What affect will this have on our climate? if any.

    Hard to put a percentage on it but I would absolutely expect our climate to be notably cooler soon if we are indeed heading into a grand solar minimum. (Also interested to see how this might play out against the fact the earth is currently warming)

    Thanks for reply.
    It will be interesting. Is there a threshold where it is considered a grand solar minimum from a typical solar minimum. Ie. What during of time required with no sunspots or how or who classifies it?


  • Posts: 31,118 ✭✭✭✭ [Deleted User]


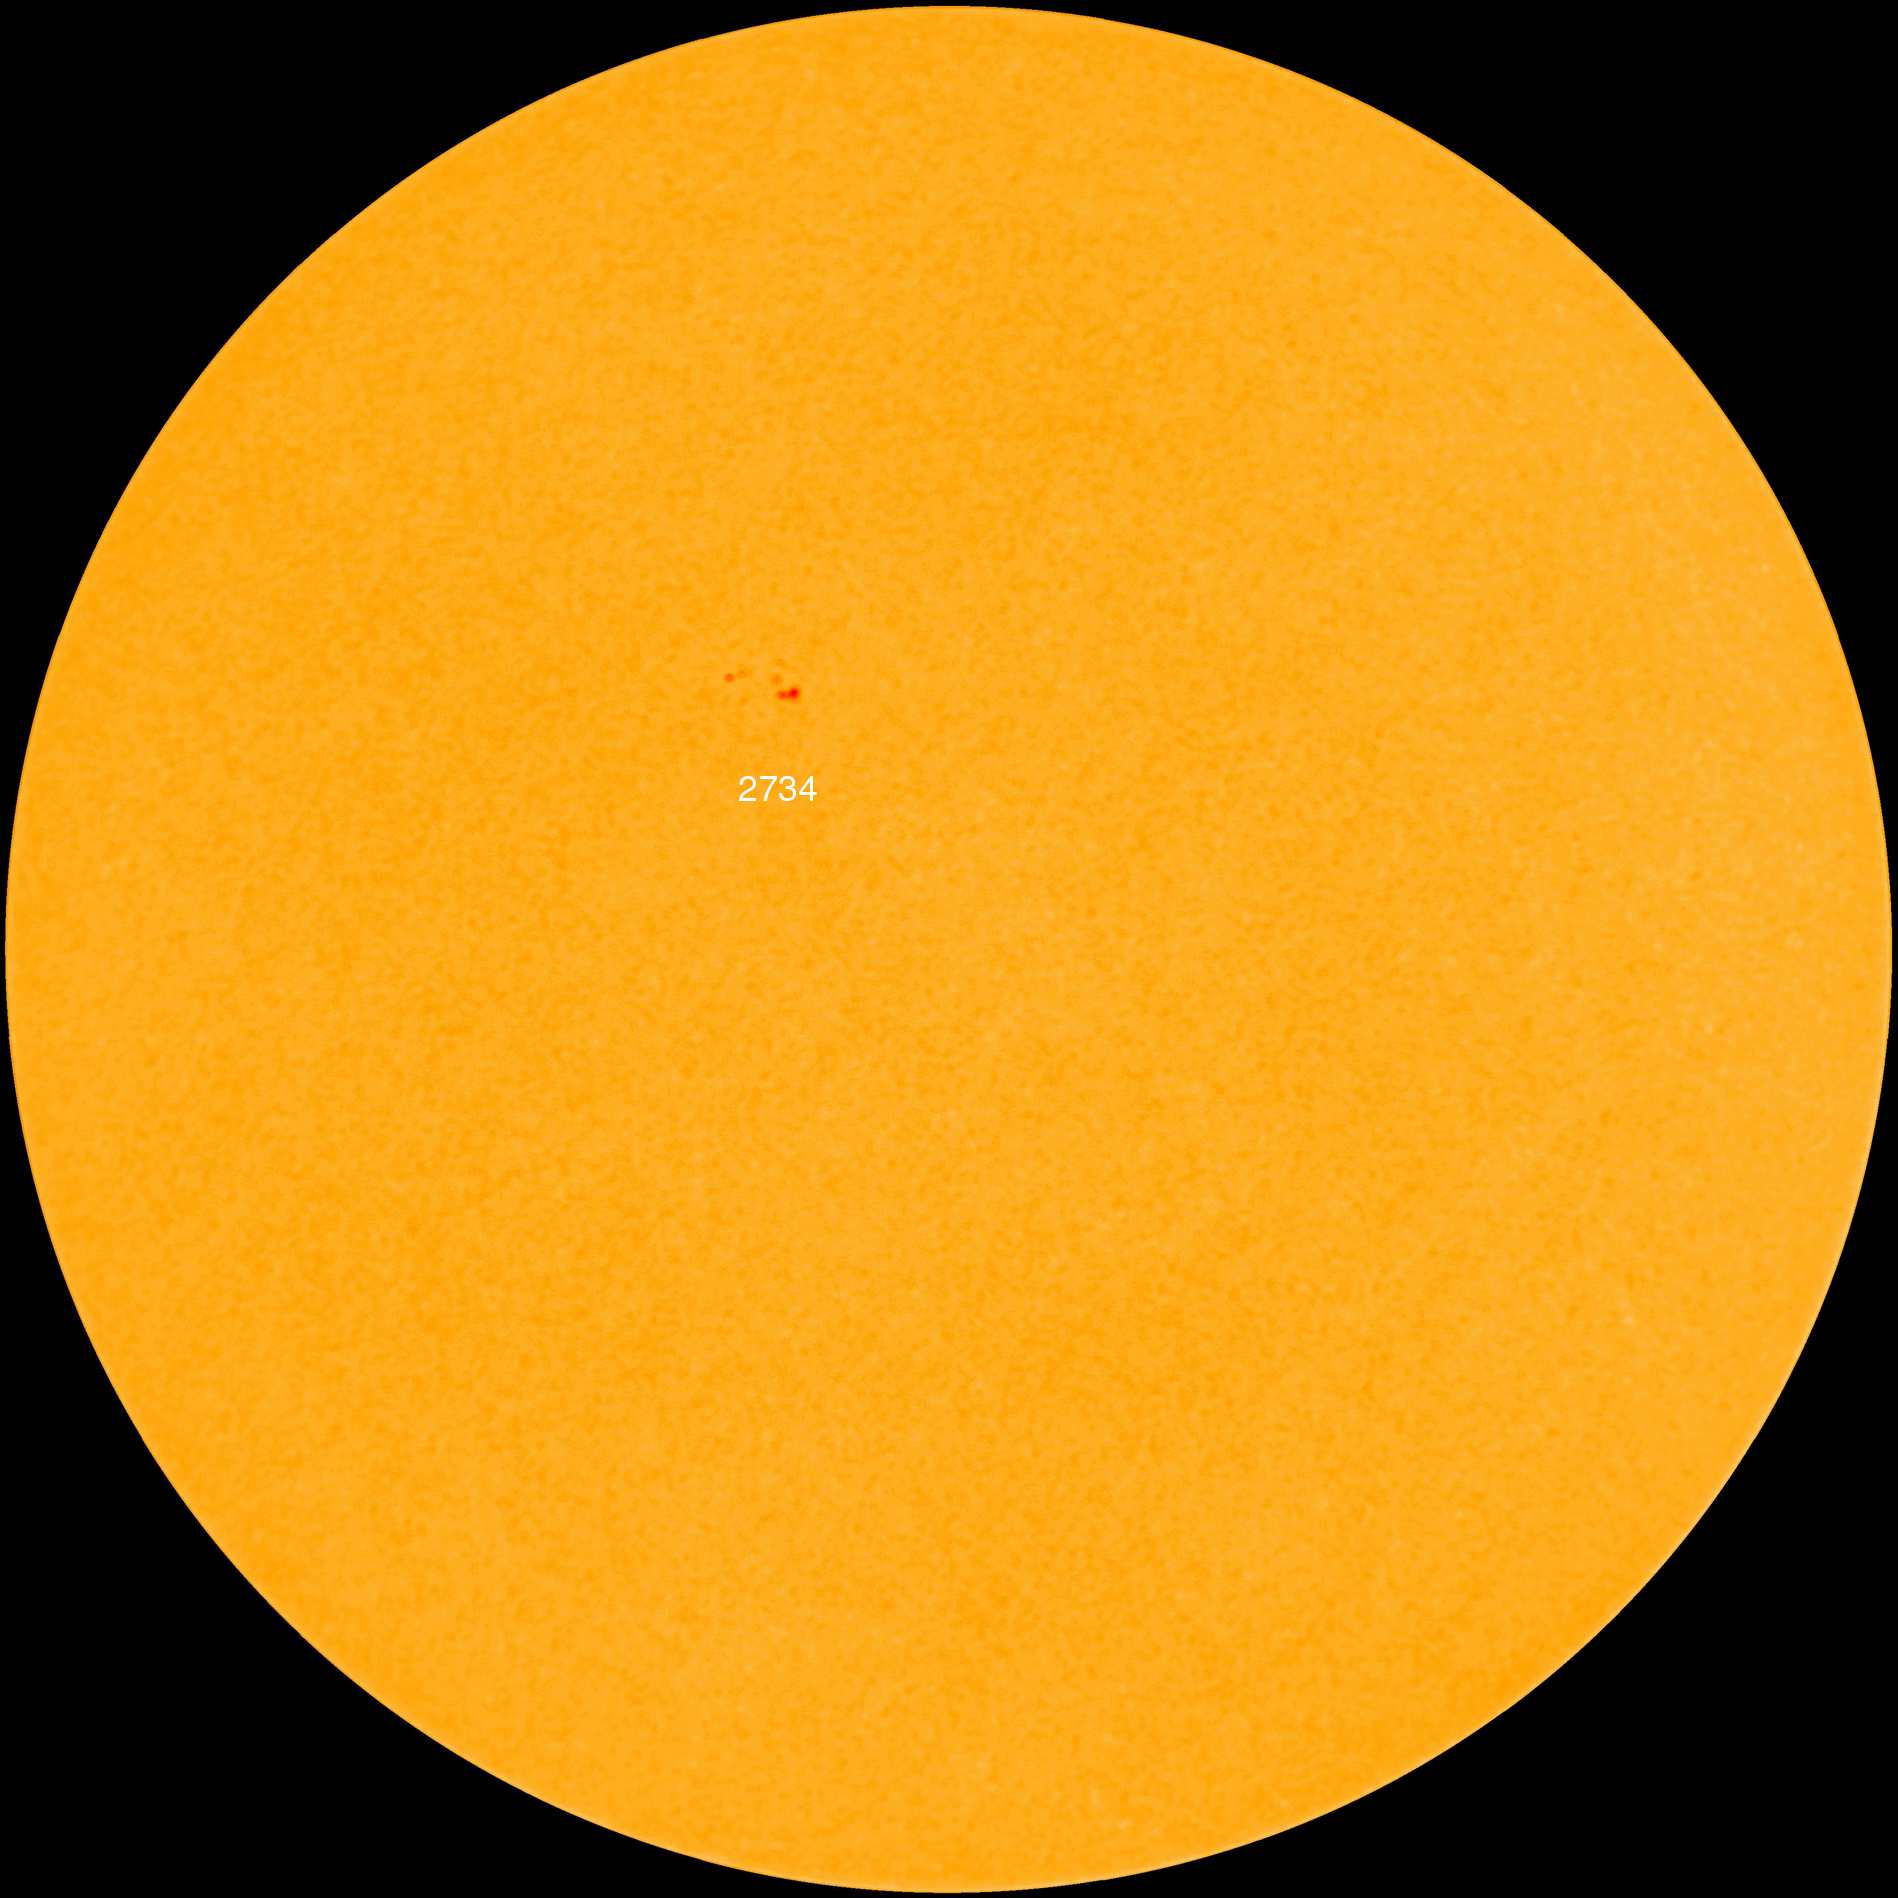
    A little spot just popped up and broke the long spotless trend.
    hmi1898.gif


  • Registered Users, Registered Users 2 Posts: 3,633 ✭✭✭Pa ElGrande


    After a quiet start to the year there has been some activity in the last few days.

    Earth-Directed Solar Flare
    March 20, 2019: Northern spring began with a bang. On March 20th at 1118 UT, new sunspot AR2736 exploded, producing a C4-class solar flare that lasted more than an hour.

    The explosion sent minor waves of ionization rippling through Earth’s upper atmosphere and caused a shortwave radio “brownout” over southern parts of Europe and all of Africa. Anomalies in radio propagation at frequencies below 20 MHz might have been noticed by, e.g., mariners and ham radio operators.


    video here of the sunspot.

    Net Zero means we are paying for the destruction of our economy and society in pursuit of an unachievable and pointless policy.


  • Registered Users Posts: 1,717 ✭✭✭firemansam4


    Recently released from NOAA/NASA: https://www.swpc.noaa.gov/news/solar-cycle-25-preliminary-forecast
    SOLAR CYCLE 25 PRELIMINARY FORECAST

    published: Friday, April 05, 2019 19:45 UTC
    The NOAA/NASA co-chaired international panel to forecast Solar Cycle 25 released a preliminary forecast for Solar Cycle 25 on April 5, 2019. The consensus: Cycle 25 will be similar in size to cycle 24. It is expected that sunspot maximum will occur no earlier than the year 2023 and no later than 2026 with a minimum peak sunspot number of 95 and a maximum of 130. In addition, the panel expects the end of Cycle 24 and start of Cycle 25 to occur no earlier than July, 2019, and no later than September, 2020. The panel hopes to release a final, detailed forecast for Cycle 25 by the end of 2019. Please read the official NOAA press release describing the international panel's forecast at https://www.weather.gov/news/190504-sun-activity-in-solar-cycle

    From what I can make out in this forecast there does not seem to be any imminent grand solar minimum predicted, and maybe just a slightly smaller cycle predicted for cycle 25.
    From my own personal perspective I am hoping these predictions come true.
    I like to photograph the aurora when I get the chance, and these last couple of years have been very bad for any activity. The last thing I would like to see is any grand solar minimum approaching.


  • Registered Users, Registered Users 2 Posts: 16,956 ✭✭✭✭nacho libre


    Does the lack of updates indicate sunspot activity has increased in recent times? I am just hoping there is a lag effect around low sunspot activity which means winter 2019/20 will be a cold one. I suppose it's a bit early to be thinking about next winter at this stage


  • Advertisement
  • Registered Users, Registered Users 2 Posts: 13,666 ✭✭✭✭sryanbruen


    Does the lack of updates indicate sunspot activity has increased in recent times? I am just hoping there is a lag effect around low sunspot activity which means winter 2019/20 will be a cold one. I suppose it's a bit early to be thinking about next winter at this stage

    There has been an increase in sunspot activity and the trend has flatlined now up to April 2019 than declining.

    Daily total sunspot numbers for May 2018 to April 2019 and the red line is a 13-day running average:

    lToadL4.png

    Monthly sunspot numbers for Solar Cycle 24 and back to Jan 2006 plus a 13-month running average:

    jr9s45K.png

    Gav's Solar Sunday makes for an excellent watch as always.


  • Registered Users, Registered Users 2 Posts: 13,666 ✭✭✭✭sryanbruen


    Currently running at 16 consecutive spotless days on the sun.

    Current Stretch: 16 days
    2019 total: 90 days (58%)
    2018 total: 221 days (61%)
    2017 total: 104 days (28%)
    2016 total: 32 days (9%)
    2015 total: 0 days (0%)
    2014 total: 1 day (<1%)
    2013 total: 0 days (0%)
    2012 total: 0 days (0%)
    2011 total: 2 days (<1%)
    2010 total: 51 days (14%)
    2009 total: 260 days (71%)
    2008 total: 268 days (73%)
    2007 total: 152 days (42%)
    2006 total: 70 days (19%)


  • Registered Users Posts: 1,525 ✭✭✭SeaBreezes


    I liked how this man puts everything together. Sound is a bit off but improves. No idea of validity of science behind it but interesting.
    https://m.youtube.com/watch?v=wqGVJWC-l-E&amp;t=1484s


  • Posts: 31,118 ✭✭✭✭ [Deleted User]


    Well, we have now matched 2018 for the percentage of spotless days, will be interesting to see how long we'll need to wait to see another one.
    Sunspot number: 0
    What is the sunspot number?
    Updated 14 Jun 2019

    Spotless Days
    Current Stretch: 26 days
    2019 total: 100 days (61%)
    2018 total: 221 days (61%)
    2017 total: 104 days (28%)
    2016 total: 32 days (9%)
    2015 total: 0 days (0%)
    2014 total: 1 day (<1%)
    2013 total: 0 days (0%)
    2012 total: 0 days (0%)
    2011 total: 2 days (<1%)
    2010 total: 51 days (14%)
    2009 total: 260 days (71%)
    2008 total: 268 days (73%)
    2007 total: 152 days (42%)
    2006 total: 70 days (19%)
    Updated 14 Jun 2019


  • Registered Users Posts: 1,985 ✭✭✭BLIZZARD7


    Sun gone very quiet, Solar flux down to 66... not often that low.

    29 days blank, 103 for 2019 / 61%


  • Advertisement
  • Registered Users, Registered Users 2 Posts: 13,666 ✭✭✭✭sryanbruen


    A full month of consecutive spotless days now, 31.

    Current stretch: 31 days
    2019 total: 104 days (62%)
    2018 total: 221 days (61%)
    2017 total: 104 days (28%)
    2016 total: 32 days (9%)
    2015 total: 0 days (0%)
    2014 total: 1 day (<1%)
    2013 total: 0 days (0%)
    2012 total: 0 days (0%)
    2011 total: 2 days (<1%)
    2010 total: 51 days (14%)
    2009 total: 260 days (71%)
    2008 total: 268 days (73%)
    2007 total: 152 days (42%)
    2006 total: 70 days (19%)

    http://spaceweather.com/


  • Registered Users Posts: 1,985 ✭✭✭BLIZZARD7


    35 days on the blink now...

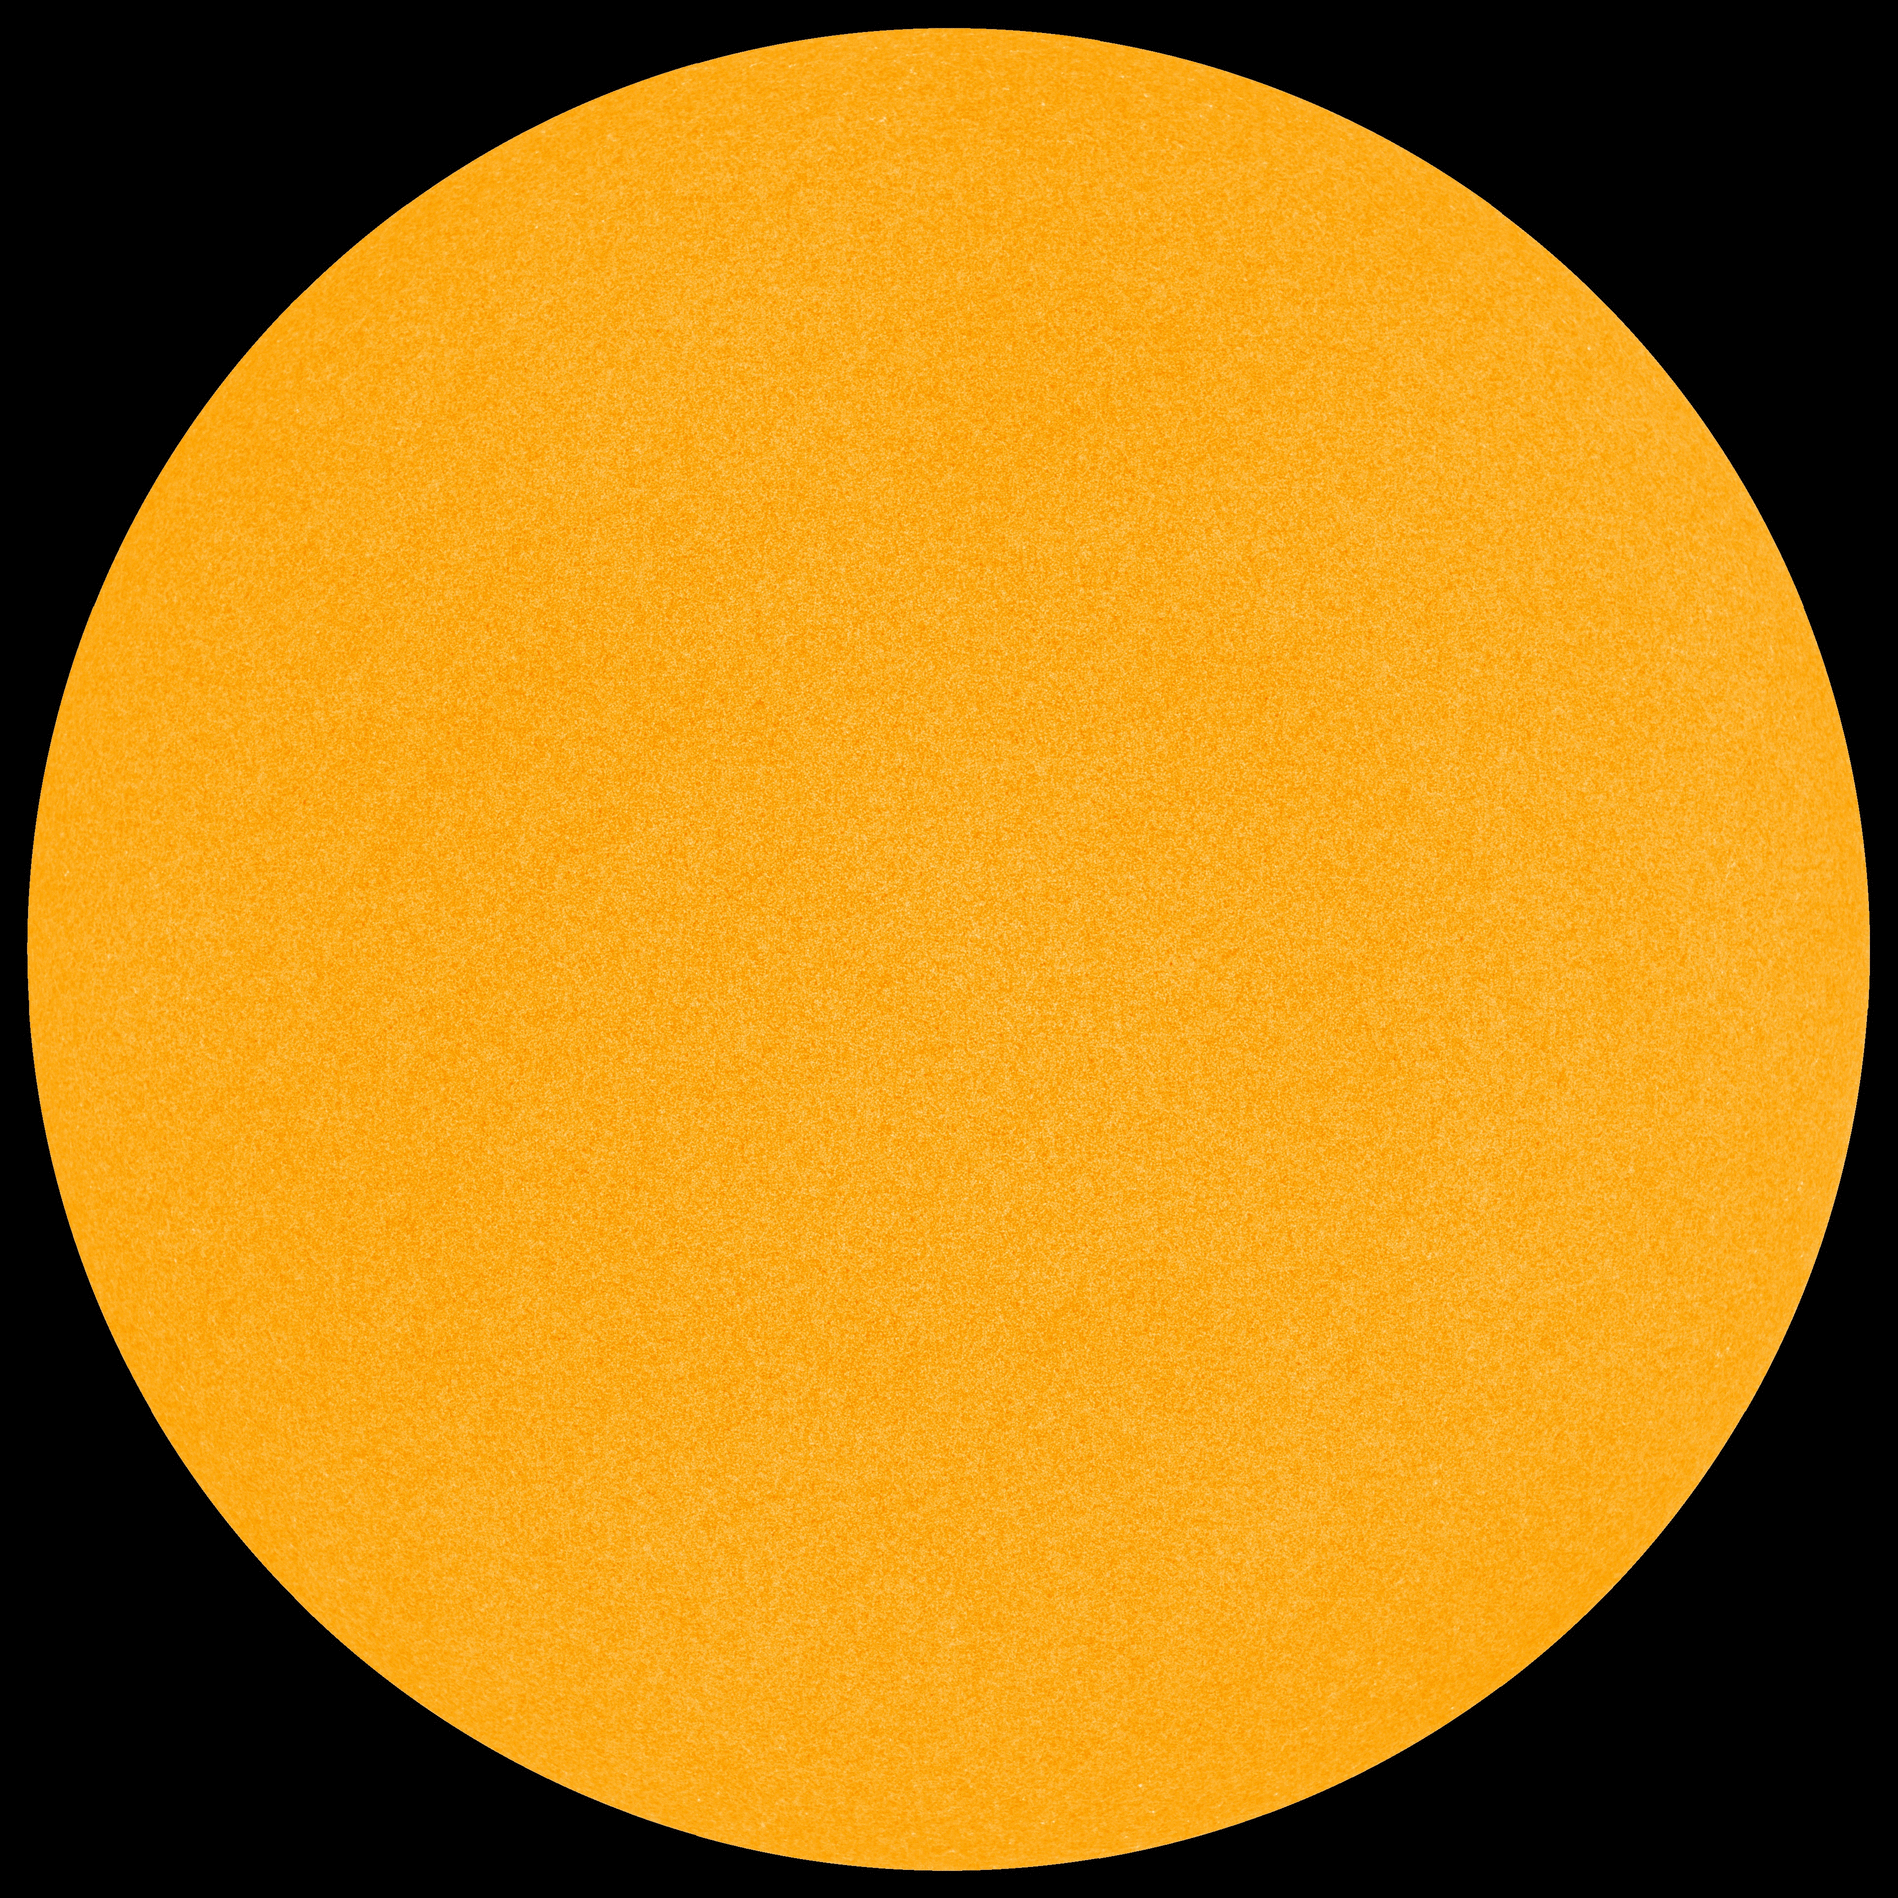
    'THE SUN IS SO BLANK, IT LOOKS LIKE A BILLIARD BALL: The sun has just crossed 34 days without a sunspot, marking the longest stretch of blank suns in the current solar cycle'

    hmi1898.gif?PHPSESSID=kufjhiharlu594s5t82uq06lj2

    35 days blank, 108 for 2019 62%

    Solar flux 66


  • Registered Users Posts: 1,985 ✭✭✭BLIZZARD7


    After 36 days blank we have some action -

    hmi1898.gif

    Solar flux @ 68


  • Posts: 31,118 ✭✭✭✭ [Deleted User]


    Soon to go over the horizon, so only a few days worth.


  • Posts: 31,118 ✭✭✭✭ [Deleted User]


    Spaceweather.com have also recently launched a "hot flight" monitoring section.

    It will be interesting to see how much more the radiation levels rise over the next few months as the solar activity continues to fall, or are we already at the bottom.


    SOMETHING NEW! We have developed a new predictive model of aviation radiation. It's called E-RAD--short for Empirical RADiation model. We are constantly flying radiation sensors onboard airplanes over the US and and around the world, so far collecting more than 22,000 gps-tagged radiation measurements. Using this unique dataset, we can predict the dosage on any flight over the USA with an error no worse than 15%.

    E-RAD lets us do something new: Every day we monitor approximately 1400 flights criss-crossing the 10 busiest routes in the continental USA. Typically, this includes more than 80,000 passengers per day. E-RAD calculates the radiation exposure for every single flight.

    The Hot Flights Table is a daily summary of these calculations. It shows the 5 charter flights with the highest dose rates; the 5 commercial flights with the highest dose rates; 5 commercial flights with near-average dose rates; and the 5 commercial flights with the lowest dose rates. Passengers typically experience dose rates that are 20 to 70 times higher than natural radiation at sea level.

    Previous chart of cosmic ray activity, levels were higher in 2009 than today, so we could see even higher values in the near future.

    monitor.gif


  • Registered Users, Registered Users 2 Posts: 3,633 ✭✭✭Pa ElGrande


    Here is something interesting that happened during solar cycle 16 (1923-1933). The Raikoke volcano in the Kuril Islands exploded February 15 1924 and there may be a link between solar minimums and volcanic activity.

    At the time the country was emerging from the civil war and was primarily an agriculture based economy.
    The harvest in 1923 and, in particular, 1924 was nothing short of disastrous. The weather, while not particularly cold, was unusually wet. Crop yields collapsed.

    The worst affected areas were in the west of Ireland and particularly the Atlantic Islands [ASF: that is, of course, the predominantly Irish-speaking communities].

    As early as the 20th of August 1924 the Meath Chronicle reported “a famine condition is imminent as bad as 1847”. Through the early autumn, local and national newspapers were littered with similar predictions of mass starvation.

    By October, people in Connemara were reported to be surviving on seaweed and shell fish.

    On New Year’s Eve 1924, a doctor was called to the home of Michael Kane who lived on Omey Island. Arriving at the house, the physician found “Kane was lying on the stone floor near a small turf fire. His emaciated face showed only too plainly the cause of his illness. The man was starving and too far-gone to benefit from medical attention. Two children, of three years and two years, respectively were lying by the fire trying to keep warm. They too were weak for want of nourishment.” Kane died two days later in Galway hospital…

    source


    The same volcano Raikoke has exploded again.


    Volcano Just Shot Out a Mushroom-Shaped Cloud So Big It Could Be Seen from Orbit
    Raikoke is a stratovolcano, which means its slopes are built up from numerous layers of hardened lava and ash. It reaches 1,808 feet (551 m) above sea level, and prior to Raikoke's 1924 explosion, the volcano's last recorded activity was in 1778, according to the National Museum of Natural History's Global Volcanism Program.

    Another image captured by satellite on June 22 shows dense concentrations of ash on the western half of the plume, while circulating storm winds over the Pacific tug at the plume and draw it eastward. Along with the ash, Raikoke's eruption also discharged a plume of sulfur dioxide that winds stirred into the stratosphere, Carn said.

    source

    The volcano Raikoke destroyed all life on the Kuril island.


    There are quite a few volcanoes in that region and even though they are on the other side of the planet they have had an impact historically, 1740 being the most significant.


    The main impact of such activity is an increase in Stratospheric sulphur aerosols.
    Stratospheric sulfur aerosols are sulfur-rich particles which exist in the stratosphere region of the Earth's atmosphere. The layer of the atmosphere in which they exist is known as the Junge layer, or simply the stratospheric aerosol layer. These particles consist of a mixture of sulfuric acid and water. They are created naturally, such as by photochemical decomposition of sulfur-containing gases, e.g. carbonyl sulfide. When present in high levels, e.g. after a strong volcanic eruption such as Mount Pinatubo, they produce a cooling effect, by reflecting sunlight, and by modifying clouds as they fall out of the stratosphere.[1] This cooling may persist for a few years before the particles fall out

    source

    Net Zero means we are paying for the destruction of our economy and society in pursuit of an unachievable and pointless policy.


  • Registered Users, Registered Users 2 Posts: 18,666 ✭✭✭✭silverharp


    A belief in gender identity involves a level of faith as there is nothing tangible to prove its existence which, as something divorced from the physical body, is similar to the idea of a soul. - Colette Colfer


  • Posts: 31,118 ✭✭✭✭ [Deleted User]


    Perfect storm perhaps, a few major volcanic eruptions combined with the lowest period of solar activity for 200 years, will be very interesting to see if this reverses the "global warming" caused by human activity.
    It could cause such a cooling that climate scientists lose all credibility, despite the fact that there is an element of truth in human activity causing some warming.


  • Banned (with Prison Access) Posts: 3,964 ✭✭✭Blueshoe


    Perfect storm perhaps, a few major volcanic eruptions combined with the lowest period of solar activity for 200 years, will be very interesting to see if this reverses the "global warming" caused by human activity.
    It could cause such a cooling that climate scientists lose all credibility, despite the fact that there is an element of truth in human activity causing some warming.

    I would like to be a fly on the wall at Crusty HQ when that announcement is made


  • Registered Users, Registered Users 2 Posts: 18,666 ✭✭✭✭silverharp


    Perfect storm perhaps, a few major volcanic eruptions combined with the lowest period of solar activity for 200 years, will be very interesting to see if this reverses the "global warming" caused by human activity.
    It could cause such a cooling that climate scientists lose all credibility, despite the fact that there is an element of truth in human activity causing some warming.

    there is so much hysteria over this that it might re balance the debate.

    A belief in gender identity involves a level of faith as there is nothing tangible to prove its existence which, as something divorced from the physical body, is similar to the idea of a soul. - Colette Colfer


  • Advertisement
  • Closed Accounts Posts: 2,398 ✭✭✭Franz Von Peppercorn II


    Perfect storm perhaps, a few major volcanic eruptions combined with the lowest period of solar activity for 200 years, will be very interesting to see if this reverses the "global warming" caused by human activity.
    It could cause such a cooling that climate scientists lose all credibility, despite the fact that there is an element of truth in human activity causing some warming.

    If volcanic eruptions reversed global warming because of particulate emissions it wouldn’t disprove anything about human caused global warming. It would merely mask it for a while.

    And isn’t the premise of this thread that a mini ice age is or was on the way. Where is it?


  • Posts: 31,118 ✭✭✭✭ [Deleted User]


    If volcanic eruptions reversed global warming because of particulate emissions it wouldn’t disprove anything about human caused global warming. It would merely mask it for a while.

    And isn’t the premise of this thread that a mini ice age is or was on the way. Where is it?
    Patience grasshopper! If there is going to be a prolonged cooling period, expect it to start in a couple of years time. A mini ice age is not expected, it will be more like a reversion to climatic conditions of the early 1970s rather than the 1650s (when the Thames and other major rivers of the British Isles froze in winter).


  • Closed Accounts Posts: 2,398 ✭✭✭Franz Von Peppercorn II


    Patience grasshopper! If there is going to be a prolonged cooling period, expect it to start in a couple of years time. A mini ice age is not expected, it will be more like a reversion to climatic conditions of the early 1970s rather than the 1650s (when the Thames and other major rivers of the British Isles froze in winter).

    Hang on. This thread is ten years old. How much patience is needed.


  • Posts: 21,179 ✭✭✭✭ [Deleted User]


    Lol nothing will change the minds of the climate alarmists.......


  • Posts: 31,118 ✭✭✭✭ [Deleted User]


    Hang on. This thread is ten years old. How much patience is needed.
    The prediction was made a decade ago, it was expected that the cooling would start around now. As things stand, apart from the heatwave that hit Western Europe this week, temperatures so far this year have been slightly below average, but not enough to be considered a sign of a cooling trend, yet.


  • Closed Accounts Posts: 2,398 ✭✭✭Franz Von Peppercorn II


    Lol nothing will change the minds of the climate alarmists.......

    Whoever they are.

    Whatever was predicted in this thread about a “new ice age” has clearly not materialised. The earth continues to warm.


  • Registered Users Posts: 1,525 ✭✭✭SeaBreezes


    Well no, it's been cooling the last three years. Zharkova predicts the next solar cycle to be roughly the same as the last then a very min/no cycle warming again 2055. Solar influence on temp/climate and man influence are not mutually exclusive. Her latest paper in regards solar influence and our climate is: https://www.nature.com/articles/s41598-019-45584-3


  • Posts: 21,179 ✭✭✭✭ [Deleted User]


    Whoever they are.

    Whatever was predicted in this thread about a “new ice age” has clearly not materialised. The earth continues to warm.

    Climate cycles can last tens, 100's and 1000's years possibly more, anything is possible. Current warm phase might naturally end in a decade , 100 years, who knows.

    Climatologists are convinced Co2 will be the end of us but we won't be alive to find out, 1000 years from now the planet could be half covered in ICe or burned to a crisp, doubt there'll be much we can do either way.


  • Posts: 21,179 ✭✭✭✭ [Deleted User]


  • Advertisement
  • Posts: 21,179 ✭✭✭✭ [Deleted User]


    During the Maunder Minimum , extreme weather events were recorded all over the world.

    Who knows the effects deep space radiation/cosmic rays etc may also have on the earth, it's a fragile place for sure.

    A sphere spinning around the sun , spinning around in the milky way galaxy which is also spinning around etc, it's all really remarkable when you think about it and here we are !

    No doubt this type of weather event will become more and more common as solar minimum continues.


  • Posts: 31,118 ✭✭✭✭ [Deleted User]


    Wow! Now that's what I call freak weather!


    Whether events like this are really more frequent, or simply down to the global access to the information is debatable(before the internet and phones with video cameras, much of these events would have gone unreported, or the news if it wouldn't have been so far reacting).
    An interesting test of the solar minimum weather theory will come this winter, 2010 was an extreme year with a cold January and a cold November, will 2020 exhibit a similar pattern?


  • Registered Users, Registered Users 2 Posts: 18,666 ✭✭✭✭silverharp


    what ways are used to track solar "output" apart from sunspots?

    A belief in gender identity involves a level of faith as there is nothing tangible to prove its existence which, as something divorced from the physical body, is similar to the idea of a soul. - Colette Colfer


  • Posts: 31,118 ✭✭✭✭ [Deleted User]


    silverharp wrote: »
    what ways are used to track solar "output" apart from sunspots?
    There are several other measurements that take place,
    TSI ( total solar irradiance) the amount of energy emitted by the sun
    Radio waves at various frequencies (seems to closely follow sunspot activity)

    Magnetic field strength, also follows sunspot activity and has a direct affect on the Earth's magnetic fields, and many other forms of radiation.
    this website has an up to date summary of the most common ones.
    https://wattsupwiththat.com/solar/
    or there is spaceweather.com


  • Posts: 21,179 ✭✭✭✭ [Deleted User]


    Wow! Now that's what I call freak weather!


    Whether events like this are really more frequent, or simply down to the global access to the information is debatable(before the internet and phones with video cameras, much of these events would have gone unreported, or the news if it wouldn't have been so far reacting).
    An interesting test of the solar minimum weather theory will come this winter, 2010 was an extreme year with a cold January and a cold November, will 2020 exhibit a similar pattern?

    Yes, but to anyone who doesn't know , this has happened before, maybe not to the same extent, I don't know but Mexico has seen some mad hailstorms.

    So it's easy to see how People can react and say "climate change is real" or " I never saw anything like this before so climate change must be happening" and this is partly due to social media and the media, they report the event not mentioning this has happened before etc.

    Yes, cameras are everywhere today, can't do anything any more but someone feels they have to video it and put it on youtube, can't even drive on the road but you know someone has a dash cam and cyclists with helmet cams cycling around looking for trouble so they can upload it to prove motorists are D1cks......


  • Moderators, Technology & Internet Moderators Posts: 17,135 Mod ✭✭✭✭cherryghost


    During the Maunder Minimum , extreme weather events were recorded all over the world.

    Who knows the effects deep space radiation/cosmic rays etc may also have on the earth, it's a fragile place for sure.

    A sphere spinning around the sun , spinning around in the milky way galaxy which is also spinning around etc, it's all really remarkable when you think about it and here we are !

    No doubt this type of weather event will become more and more common as solar minimum continues.

    Just remember that you're standing on a planet that's evolving
    And revolving at 900 miles an hour.
    It's orbiting at 19 miles a second, so it's reckoned,
    The sun that is the source of all our power.
    Now the sun, and you and me, and all the stars that we can see,
    Are moving at a million miles a day,
    In the outer spiral arm, at 40, 000 miles an hour,
    Of a galaxy we call the Milky Way.


  • Advertisement
  • Registered Users, Registered Users 2 Posts: 3,633 ✭✭✭Pa ElGrande


    Here is another consequence.


    Cosmic Rays Increasing for the 4th Year in a Row
    Why are cosmic rays increasing? The short answer is “Solar Minimum.” Right now, the 11-year solar cycle is plunging into one of the deepest minima of the Space Age. The sun’s weakening magnetic field and flagging solar wind are not protecting us as usual from deep-space radiation. Earth to Sky balloon launches in multiple countries and US states show that this is a widespread phenomenon.

    source


    Solar Activity and the 11-Year Modulation of Cosmic Rays


    Prof Henrik Svensmark & Jacob Svensmark discuss the connection between cosmic rays, clouds and climate with the GWPF's Benny Peiser and Jonny Bairstow from Energy Live News.


    FORCE MAJEURE - The Sun’s Role in Climate Change - Henrik Svensmark
    Three main theories have been put forward to explain the solar–climate link, which are:
    • solar ultraviolet changes
    • the atmospheric-electric-field effect on cloud cover
    • cloud changes produced by solar-modulated galactic cosmic rays (energetic particles originating from inter stellar space and ending in our atmosphere).


    Significant efforts has gone into understanding possible mechanisms, and at the moment cosmic ray modulation of Earth’s cloud cover seems rather promising in explaining thesize of solar impact. This theory suggests that solar activity has had a significant impact on climate during the Holocene period. This understanding is in contrast to the official consensus from the Intergovernmental Panel on Climate Change, where it is estimated that the change in solar radiative forcing between 1750 and 2011 was around 0.05 W/m2,a value which is entirely negligible relative to the effect of greenhouse gases, estimated at around 2.3 W/m2.However, the existence of an atmospheric solar-amplification mechanism would have implications for the estimated climate sensitivity to carbon dioxide, suggesting that it is much lower than currently thought.

    In summary, the impact of solar activity on climate is much larger than the official consensus suggests. This is therefore an important scientific question that needs to be addressed by the scientific community.

    source

    Net Zero means we are paying for the destruction of our economy and society in pursuit of an unachievable and pointless policy.


  • Registered Users, Registered Users 2 Posts: 1,320 ✭✭✭snowstreams


    I read his Book the chilling stars back 15 years ago. https://en.wikipedia.org/wiki/The_Chilling_Stars

    At the time I thought humanity was fully in the clear for global warming after reading it.
    But it still looks like it could have a sizable affect for slowing down climate change.


  • Registered Users, Registered Users 2 Posts: 3,633 ✭✭✭Pa ElGrande


    Winter monsoons became stronger during geomagnetic reversal
    New evidence suggests that high-energy particles from space known as galactic cosmic rays affect the Earth’s climate by increasing cloud cover, causing an “umbrella effect”.

    When galactic cosmic rays increased during the Earth’s last geomagnetic reversal transition 780,000 years ago, the umbrella effect of low-cloud cover led to high atmospheric pressure in Siberia, causing the East Asian winter monsoon to become stronger. This is evidence that galactic cosmic rays influence changes in the Earth’s climate. The findings were made by a research team led by Professor Masayuki Hyodo (Research Center for Inland Seas, Kobe University) and published on June 28 in the online edition of Scientific Reports.

    The Svensmark Effect is a hypothesis that galactic cosmic rays induce low cloud formation and influence the Earth’s climate. Tests based on recent meteorological observation data only show minute changes in the amounts of galactic cosmic rays and cloud cover, making it hard to prove this theory. However, during the last geomagnetic reversal transition, when the amount of galactic cosmic rays increased dramatically, there was also a large increase in cloud cover, so it should be possible to detect the impact of cosmic rays on climate at a higher sensitivity.

    source

    Net Zero means we are paying for the destruction of our economy and society in pursuit of an unachievable and pointless policy.


  • Posts: 21,179 ✭✭✭✭ [Deleted User]


    I read his Book the chilling stars back 15 years ago. https://en.wikipedia.org/wiki/The_Chilling_Stars

    At the time I thought humanity was fully in the clear for global warming after reading it.
    But it still looks like it could have a sizable affect for slowing down climate change.

    All a natural process gets warm it cools etc.


  • Posts: 31,118 ✭✭✭✭ [Deleted User]


    spaceweather.com

    ANOTHER SUNSPOT FROM THE NEXT SOLAR CYCLE: Solar Cycle 25 is coming to life. For the second time this month, a sunspot from the next solar cycle has emerged in the sun's southern hemisphere. Numbered "AR2744", it is inset in this magnetic map of the sun's surface from NASA's Solar Dynamics Observatory:


    How do we know this sunspot belongs to Solar Cycle 25? Its magnetic polarity tells us so. Southern sunspots from old Solar Cycle 24 have a -/+ polarity. This sunspot is the opposite: +/-. According to Hale's Law, sunspots switch polarities from one solar cycle to the next. AR2744 is therefore a member of Solar Cycle 25.

    Solar cycles always mix together at their boundaries. Right now we are experiencing the tail end of decaying Solar Cycle 24. AR2744 shows that we are simultaneously experiencing the first stirrings of Solar Cycle 25. The transition between Solar Cycle 24 and Solar Cycle 25 is underway.

    Shortlived "ephemeral sunspots" belonging to Solar Cycle 25 have already been reported on Dec. 20, 2016; April 8, 2018; Nov. 17, 2018; May 28, 2019 and July 1, 2019. Today's sunspot is more important than those earlier examples because it has lasted long enough to receive a numberical designation: AR2744. Solar physicists will likely mark this as the first official sunspot of Solar Cycle 25.

    This development does not mean Solar Minimum is finished. On the contrary, low solar activity will probably continue for at least another year as Solar Cycle 24 decays and Solar Cycle 25 sputters to life.


  • Advertisement
  • Registered Users Posts: 27 Ckit1


    Great recent image of the ISS crossing the spotless sun:

    https://apod.nasa.gov/apod/ap190715.html

    ppHdnU4


  • Posts: 21,179 ✭✭✭✭ [Deleted User]


    Ckit1 wrote: »
    Great recent image of the ISS crossing the spotless sun:

    https://apod.nasa.gov/apod/ap190715.html

    ppHdnU4

    Amazing, thanks for sharing !


  • Posts: 31,118 ✭✭✭✭ [Deleted User]


    Another day another (micro)sunspot, I'm not sure how they can count this one.
    Sunspot number: 11
    What is the sunspot number?
    Updated 23 Jul 2019

    Spotless Days
    Current Stretch: 0 days
    2019 total: 132 days (65%)
    2018 total: 221 days (61%)
    2017 total: 104 days (28%)
    2016 total: 32 days (9%)
    2015 total: 0 days (0%)
    2014 total: 1 day (<1%)
    2013 total: 0 days (0%)
    2012 total: 0 days (0%)
    2011 total: 2 days (<1%)
    2010 total: 51 days (14%)
    2009 total: 260 days (71%)
    2008 total: 268 days (73%)
    2007 total: 152 days (42%)
    2006 total: 70 days (19%)
    Updated 23 Jul 2019


    hmi1898.gif


  • Posts: 31,118 ✭✭✭✭ [Deleted User]


    That's the second time in recent days that a spot has surfaced and immediately sunk again.
    In the previous post, it appears to have blinked before the picture was taken.

    Sunspot number: 0
    What is the sunspot number?
    Updated 24 Jul 2019

    Spotless Days
    Current Stretch: 1 day
    2019 total: 133 days (65%)
    2018 total: 221 days (61%)
    2017 total: 104 days (28%)
    2016 total: 32 days (9%)
    2015 total: 0 days (0%)
    2014 total: 1 day (<1%)
    2013 total: 0 days (0%)
    2012 total: 0 days (0%)
    2011 total: 2 days (<1%)
    2010 total: 51 days (14%)
    2009 total: 260 days (71%)
    2008 total: 268 days (73%)
    2007 total: 152 days (42%)
    2006 total: 70 days (19%)
    Updated 24 Jul 2019


  • Registered Users Posts: 1,985 ✭✭✭BLIZZARD7


    On quite the blank stretch currently...


    Current Stretch: 20 days
    2019 total: 164 days (69%)
    2018 total: 221 days (61%)
    2017 total: 104 days (28%)
    2016 total: 32 days (9%)
    2015 total: 0 days (0%)
    2014 total: 1 day (<1%)
    2013 total: 0 days (0%)
    2012 total: 0 days (0%)
    2011 total: 2 days (<1%)
    2010 total: 51 days (14%)
    2009 total: 260 days (71%)
    2008 total: 268 days (73%)
    2007 total: 152 days (42%)
    2006 total: 70 days (19%)

    SFU @ 67


  • Registered Users, Registered Users 2 Posts: 13,666 ✭✭✭✭sryanbruen


    In terms of monthly mean sunspot numbers, solar activity is pretty much on the floor with February and July this year both seeing a mean SSN under 1.


    duyJ7l7.png


  • Posts: 0 [Deleted User]


    sryanbruen wrote: »
    In terms of monthly mean sunspot numbers, solar activity is pretty much on the floor with February and July this year both seeing a mean SSN under 1.


    mkzeMlS.png

    How's that graph trending, over a couple decades?
    (acknowledging how tiny a few decades is, to the sun)


  • Registered Users, Registered Users 2 Posts: 13,666 ✭✭✭✭sryanbruen


    How's that graph trending, over a couple decades?
    (acknowledging how tiny a few decades is, to the sun)
    Edited graph to include back to January 1960, see post above.


  • Registered Users Posts: 1,985 ✭✭✭BLIZZARD7


    Interesting update to this chart tracking SC24, only runs to Jan 2019 and is a 13 month smoothed mean so the past few quiet months are not represented. Our current progression (SC25) is shown on the green line.

    SC2425minimum.png

    http://users.telenet.be/j.janssens/SC24web/SC24.html


  • Advertisement
Advertisement