Advertisement
If you have a new account but are having problems posting or verifying your account, please email us on hello@boards.ie for help. Thanks :)
Hello all! Please ensure that you are posting a new thread or question in the appropriate forum. The Feedback forum is overwhelmed with questions that are having to be moved elsewhere. If you need help to verify your account contact hello@boards.ie

'Bundle Up, It's Global Warming'

Options
1234579

Comments

  • Registered Users Posts: 921 ✭✭✭MiNdGaM3


    Min wrote: »
    O3 is a minor greenhouse gas, it is a pollutant at lower levels and affects agricultural production, while increased CO2 should help increase food production.

    Is that not kinda missing the point?
    Just because there are extremely low levels of something in the atmosphere, doesn't mean it's effects can be discounted.

    Also, Arctic sea ice is very important with regards to maintaining a relatively balanced temperature regime across the globe. When you have ~10 million km2 of a reflective surface changed to one that absorbs light, you're really going to notice a huge increase in temperature, especially in the northern hemispheres mid-high latitudes. With that comes melting of the Greenland ice sheet and a rise in sea levels, melting of the permafrost and release of methane. You get the idea I'm sure!?


  • Closed Accounts Posts: 5,550 ✭✭✭Min


    MiNdGaM3 wrote: »
    Is that not kinda missing the point?
    Just because there are extremely low levels of something in the atmosphere, doesn't mean it's effects can be discounted.

    Also, Arctic sea ice is very important with regards to maintaining a relatively balanced temperature regime across the globe. When you have ~10 million km2 of a reflective surface changed to one that absorbs light, you're really going to notice a huge increase in temperature, especially in the northern hemispheres mid-high latitudes. With that comes melting of the Greenland ice sheet and a rise in sea levels, melting of the permafrost and release of methane. You get the idea I'm sure!?

    Yeah, I get the point, Arctic sea ice is only 3 million years old, we had the Antarctic ice for about 10 times that length of time, why did we have all that ice in Antarctica if we go by what you say?
    Shouldn't it all have melted?


  • Closed Accounts Posts: 1,460 ✭✭✭4gun


    This threads gone sillier!

    Wrong again, when there was a baking summer last year did you hear any people who know the evidence about GW say oh thats because of global warming----no! But when we get a freeze, people who read the tabloids(i saw some of your links!) claim whoa its all a scam/ you are all mistaken despite the data despite the reasoned evidence. If any new evidence comes up that claims the climate is warming not by mans pumping co2 into the atmosphere etc but by some natural unknown means then i will accept that because that will be the evidence. Yet you and the likes of you will not accept the current view when the evidence is overwhelming, nuff said.

    What do you mean ruin the planet? Oxygen is a poison to most life on earth especially when the reptiles came out of the sea, what are you saying?


    Thats a massive fail, you've been told over and over its global warming not back garden localised warming.:confused:

    you might have some bit of credibility with me if you didn't act like such a snob ..phrases like "low brow" and stating that people that read tabloids have no idea what going on ...according to you man made Global warming must be true because .."Yaw I believe it loike, so it must be true"...

    We had a heat wave in the summer but for most parts where I live it was counteracted by a northerly wind and if yearly averages are taken into account it will have to go as a average year as we had two months with near artic conditions...

    If the whole world is warming up do you not think my "back yard" would be warmer ..my "back yard" being a large sector of the south west ..your the guys that tried to localise it to the area at the back of my house. or maybe we are totally exempt down here :rolleyes:...loike


  • Registered Users Posts: 210 ✭✭eamo12


    Yea that theory of gravity or evolution is only a theory, theres a bunch of crackpots left against global warming at this stage, theres some great minds, neutrally motivated great minds coming up with the data.

    Global warming deniers = theory of gravity deniers! Unfortunately, your warming theory has yet to be proved and your sounding more and more desperate as your big scam is revealed. Remember the articles in 2000 telling us that the next generation will never see snow? Shameful scaremongering.


  • Registered Users Posts: 921 ✭✭✭MiNdGaM3


    Min wrote: »
    Yeah, I get the point, Arctic sea ice is only 3 million years old, we had the Antarctic ice for about 10 times that length of time, why did we have all that ice in Antarctica if we go by what you say?
    Shouldn't it all have melted?

    The sea ice in Antarctica grows to around 15 million km2 but reduces down to just 2 million km2 during the southern hemisphere summer, so that melts away practically every year.
    The ice sheet on the other hand is on land and is around 1.5km thick on average. That height creates an extremely cold self sustaining climate that would require global temperatures of probably 20C warmer to melt it all.


  • Advertisement
  • Closed Accounts Posts: 5,550 ✭✭✭Min


    MiNdGaM3 wrote: »
    The sea ice in Antarctica grows to around 15 million km2 but reduces down to just 2 million km2 during the southern hemisphere summer, so that melts away practically every year.
    The ice sheet on the other hand is on land and is around 1.5km thick on average. That height creates an extremely cold self sustaining climate that would require global temperatures of probably 20C warmer to melt it all.

    I don't think the Arctic sea ice will melt away, but in history of the world it is just a recent feature.
    I think your post is good by the way, in my opinion the scientists who keep telling us the Arctic will be ice free in summer and who keep postponing the date are doing a disservice to their profession.
    Going to school in the early 80's we were being told we were heading for an ice age, now it is too much warming, that will change too...just like the climate changes.

    I was watching a program on the science channels on Sky, how the Earth was made, they were talking about the Alps, there they claimed it was natural for the glaciers to recede , then grow, then recede.
    I think we have been in a natural warmer period and it is nothing out of the ordinary


  • Closed Accounts Posts: 1,460 ✭✭✭4gun


    Here is a link That I took from real science


    http://hadobs.metoffice.com/hadcet/mly_cet_mean_sort.txt

    according 2010 is down on line 280 with ave temp of 15.2 which is a long way off the top
    this is for monthly individual figures


  • Closed Accounts Posts: 1,460 ✭✭✭4gun


    this one is for Sharper as he 's very fond of graphs ;)
    as know as much about the author webpage in the link as I do about the authors of webpages touting Global warming by manmade CO2 emmissions, I cannot vouch for their research

    http://stevengoddard.wordpress.com/2010/11/06/most-us-states-had-their-hottest-year-prior-to-1970/


  • Closed Accounts Posts: 5,234 ✭✭✭thetonynator


    trend

    I've been looking at this graph posted a few pages back, and it makes no sense.

    Ignore the straightened line for a minute, and you can see that for the first to cycles, there is no rise or fall, i.e. the cycles are identical. But then activity drops significantly .So why is it that this graph is shown as being proof of falling solar activity over the last 30 years, when what it actually shows is even solar activity up until a few years ago, when it suddenly dropped., and the drop is incoporated into the whole graph on the even line.

    I'm not making myself very clear, but what i'm trying to say is that the graph has been manipulated to support dropping solar activity over 30 years, not 5 years.


  • Registered Users Posts: 1,216 ✭✭✭sharper


    Ignore the straightened line for a minute, and you can see that for the first to cycles, there is no rise or fall, i.e. the cycles are identical. But then activity drops significantly .So why is it that this graph is shown as being proof of falling solar activity over the last 30 years, when what it actually shows is even solar activity up until a few years ago, when it suddenly dropped., and the drop is incoporated into the whole graph on the even line.
    The 30 trend right this minute is going to be quite low because solar activity is quite low. An 11 year mean would eliminate the cyclical highs and lows but it's still be down because we're low even for the current part of the cycle.

    Even if you stop at 2002 the trend is still down

    trend
    I'm not making myself very clear, but what i'm trying to say is that the graph has been manipulated to support dropping solar activity over 30 years, not 5 years.
    The graph hasn't been manipulated at all, it's the entire record with the trend line for the entire record. I've stated repeatedly that the TSI trend is either flat or down.

    What it most definitely is not is up. There's no evidence at all to support recent "rampant solar activity" and consequently there's simply no way to make solar activity explain the last 30 years fo warming.


  • Advertisement
  • Registered Users Posts: 1,216 ✭✭✭sharper


    4gun wrote: »
    this one is for Sharper as he 's very fond of graphs ;)
    as know as much about the author webpage in the link as I do about the authors of webpages touting Global warming by manmade CO2 emmissions, I cannot vouch for their research
    "Steve Goddard" (it's not his real name) produces some of the worst garbage out there. He looks at datasets and tries to figure out which metrics will produce the answer he wants and the answer is always that nothing is happening. When annual snowfall rates start dropping he switches to particular months of the year and claims AGW is falsified because snow levels are higher in spring than usual. When arctic ice is declining he switches to old versions of models to try and prove the opposite. He was also the source for that non-baseline adjusted temperature dataset comparison which tried to prove GISS was showing unusual temperatures.

    In this case he's picking a particular metric - when was the highest temperature recorded anywhere in any state. In the United States 1934 was approximately as hot as 1998 so it's therefore unsurprising that many of the records were set around the 1930s and 1990s

    Pretty much anyone would have a hard time explaining why this is a better way to measure temperature changes than trends in daily averages. According to this if one station in one state recording a high temperature 30 years ago then you ignore the increasing daily average for all other stations in that state over that time period and say "It was hotter 30 years ago".


  • Closed Accounts Posts: 5,234 ✭✭✭thetonynator


    sharper wrote: »


    What it most definitely is not is up. There's no evidence at all to support recent "rampant solar activity" and consequently there's simply no way to make solar activity explain the last 30 years fo warming.

    But showing 30 years on a graph and saying its not up, only means that its not up compared to 30 years ago. I dont have the necessary data and have no idea where to find it, but any information can be manipulated into showing what the person wants it to show.


  • Registered Users Posts: 1,216 ✭✭✭sharper


    But showing 30 years on a graph and saying its not up, only means that its not up compared to 30 years ago.
    That's why I also included the trend over the time period so as to not simply compare the start and end points but to evaluate the direction over the entire time period. Solar activity is down, there's no way to make it be up.
    I dont have the necessary data and have no idea where to find it, but any information can be manipulated into showing what the person wants it to show.
    Well firstly I linked you to the woodfortrees page which built the graph so you could easily have played around with the parameters there. The credits section contains links to where all the data is obtained, the PMOD TSI data comes from here ftp://ftp.pmodwrc.ch/pub/data/irradiance/composite/

    Secondly you're now simply dismissing data you don't like with no basis whatsoever. It's an uncontroversial fact that solar activity is either flat or declining over the last 30 years. Sure information can be manipulated bit simply asserting that in the face of contrary data is unreasonable.


  • Closed Accounts Posts: 5,150 ✭✭✭Deep Easterly


    4gun wrote: »

    We had a heat wave in the summer

    I can't seem to recall...


  • Closed Accounts Posts: 5,234 ✭✭✭thetonynator


    sharper wrote: »
    That's why I also included the trend over the time period so as to not simply compare the start and end points but to evaluate the direction over the entire time period. Solar activity is down, there's no way to make it be up.


    .

    Are you deliberately being this dense? Any fool can see on your graph that the trend does not change at all until the year 2000, then someone drew a downward trend on it averaging the drop from the last few years over 30 years to make it look like solar activity is dropping. Also, my point was that the graph isn't showing what the activity was prior to this graph, so we cant tell if this is a high period of activity or a low one. We can only see that there has been a drop in the last 10 years, and that someone has averaged this drop over 30 years to cover up the facts.


    EDit:

    SUNSPOT.GIF

    Look at this graph of sunspots over a reasonable time frame ( projected until 1600) and it clearly shows that sunspot numbers and solar activity have been rising since the 1800's. Which coincidentally is not far off the time global temps have been rising. What it also shows is that the 20th century did not have falling sunspot numbers as you claimed.

    I rest my case . . :rolleyes:


  • Registered Users Posts: 1,216 ✭✭✭sharper


    Are you deliberately being this dense? Any fool can see on your graph that the trend does not change at all until the year 2000,
    Any fool can eyeball a graph and reach the wrong answer. I already plotted 2002 but sure here's 2000

    trend

    The same answer, solar activity declined.

    This is the original 1979-2010 graph but with annual means instead of a monthly plot

    trend

    You can clearly see the subsequent peaks are not as high as the previous ones
    then someone drew a downward trend on it averaging the drop from the last few years over 30 years to make it look like solar activity is dropping.
    I already eliminated the last few years by plotting upto the last peak in 2002. The direction remains the same.
    Also, my point was that the graph isn't showing what the activity was prior to this graph, so we cant tell if this is a high period of activity or a low one. We can only see that there has been a drop in the last 10 years, and that someone has averaged this drop over 30 years to cover up the facts.

    You've made numerous assertions about manipulations but you've been unable to show any of them. Instead you've simply declared it must be wrong because it doesn't match what you "know" is true.

    Where is your data? Where is your analysis? You apparently didn't even know how to go about accessing solar TSI data and you don't seem to know what a trend line is, exactly where are you getting the idea that solar activity has increased over the last 30 years? Because redsunset said so?


  • Closed Accounts Posts: 5,234 ✭✭✭thetonynator


    heres a few more graphs showing what i'm trying to say:

    11265_sunspot_numbers.png

    11266_Solar_Activity_Proxies.png

    be10-climate.png?w=510&h=272

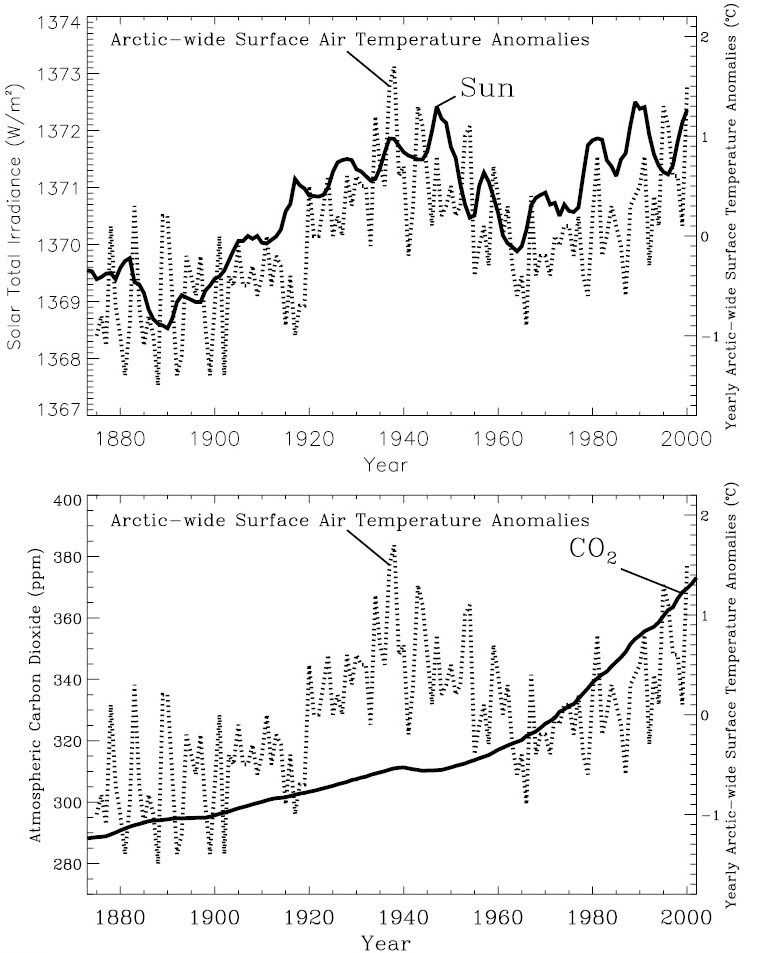
    Heres artic temp rise in against rising solar activity in the 20th Century.
    SolarIrradiance.jpg

    I re-rest my case . .:P


  • Closed Accounts Posts: 2,693 ✭✭✭Redsunset


    Ok let me jump in here and show that yes TSI has been dropping and Sharper you mistook me when i said recently.I was not talking TSI as such

    12-year low in solar "irradiance": Careful measurements by several NASA spacecraft show that the sun's brightness has dropped by 0.02% at visible wavelengths and 6% at extreme UV wavelengths since the solar minimum of 1996. The changes so far are not enough to reverse the course of global warming, but there are some other significant side-effects: Earth's upper atmosphere is heated less by the sun and it is therefore less "puffed up." Satellites in low Earth orbit experience less atmospheric drag, extending their operational lifetimes. Unfortunately, space junk also remains longer in Earth orbit, increasing hazards to spacecraft and satellites.

    irradiance.jpg


  • Registered Users Posts: 1,216 ✭✭✭sharper


    Look at this graph of sunspots over a reasonable time frame ( projected until 1600) and it clearly shows that sunspot numbers and solar activity have been rising since the 1800's

    We're talking about since 1979, not since the 1800s

    Which coincidentally is not far off the time global temps have been rising. What it also shows is that the 20th century did not have falling sunspot numbers as you claimed.
    You can't even see the late 20th century on that graph, what do you think it demonstrates?


  • Registered Users Posts: 1,216 ✭✭✭sharper


    heres a few more graphs showing what i'm trying to say:

    All of your graphs show stable or declining solar activity in the late 20th century.
    I re-rest my case . .:P
    I really wouldn't like you defending me in court, you'd bring in the murder weapon with my prints on it.


  • Advertisement
  • Registered Users Posts: 1,216 ✭✭✭sharper


    Since 1979 sunspots have declined as well

    trend


  • Closed Accounts Posts: 5,234 ✭✭✭thetonynator


    sharper wrote: »
    We're talking about since 1979, not since the 1800s


    You can't even see the late 20th century on that graph, what do you think it demonstrates?


    Actually you're talking about a very recent period as it is the only one you can manipulate into what you wan it to show, i'm talking about the wider scale, the 400 years of sunspot data that has been recorded.

    sharper wrote: »
    All of your graphs show stable or declining solar activity in the late 20th century.


    I really wouldn't like you defending me in court, you'd bring in the murder weapon with my prints on it.


    The graphs show that activity was increasing from the 1800's until the end of the 20th century.


  • Closed Accounts Posts: 5,234 ✭✭✭thetonynator


    sharper wrote: »
    Since 1979 sunspots have declined as well

    trend


    In this graph, we can see two solar maximums in the 20th century, and one in the 21st. The 2 in the 20th century are more or less equal, showing that activity did not change in those cycles (although the graph doesnt show that it was increasing up until this point.) The 3rd maximum is a big decline, which obviously brings the line down when averaged out.

    Your graphs are based on you starting it at a solar maximum and ending it at a solar minimum so that you can show a downwards trend.


  • Registered Users Posts: 1,216 ✭✭✭sharper


    Actually you're talking about a very recent period as it is the only one you can manipulate into what you wan it to show, i'm talking about the wider scale, the 400 years of sunspot data that has been recorded.
    You keep throwing about accusations of manipulation yet you're unable to show any manipulation. You simply want to dismiss data that doesn't say what you want it to say.

    The graphs show that activity was increasing from the 1800's until the end of the 20th century.
    I haven't claimed that solar activity has never increased. My point is that solar activity cannot explain temperature increases after 1980 and this is the same conclusions reached by scientists studying the link between climate and solar activity.

    You can try and obfuscate all you like and you can claim manipulation all you like however solar activity has declined and cannot explain the last 30 years of temperature increases. If you want to claim it's a result of previous solar increases then you also have to explain this

    Earth’s Energy Imbalance: Confirmation and Implications
    Our climate model, driven mainly by increasing human-made greenhouse
    gases and aerosols, among other forcings, calculates that Earth is now absorbing 0.85 T 0.15 watts per square meter more energy from the Sun than it
    is emitting to space. This imbalance is confirmed by precise measurements of
    increasing ocean heat content over the past 10 years. Implications include (i) the
    expectation of additional global warming of about 0.6-C without further change
    of atmospheric composition; (ii) the confirmation of the climate system’s lag
    in responding to forcings, implying the need for anticipatory actions to avoid
    any specified level of climate change; and (iii) the likelihood of acceleration of
    ice sheet disintegration and sea level rise

    i.e. the Earth is absorbing more energy than it's emitting, not something you'd expect after 30 years of stable solar activity.


  • Closed Accounts Posts: 399 ✭✭fizzycyst


    Hi Sharper, what I don't understand is your reluctance to hear other peoples point of view on the subject of Climate change. Although the connection between increased CO2 emissions and higher global temperatures is fairly solid, we have to be open to the 'global warming theory' evolving as new information comes to light. You seem to be very defensive about it, and in my opinion climatology is a relatively new science that needs to be critically analysed for many years before it is an exact science.


  • Registered Users Posts: 1,216 ✭✭✭sharper


    In this graph, we can see two solar maximums in the 20th century, and one in the 21st. The 2 in the 20th century are more or less equal, showing that activity did not change in those cycles
    i.e. solar activity is stable or declining which is what I've been saying!
    Your graphs are based on you starting it at a solar maximum and ending it at a solar minimum so that you can show a downwards trend.

    You are (yet again) throwing around accusations of manipulation without basis and without being able to demonstrate it

    Peak to peak, activity is down

    trend

    Annual means, you can clearly see activity is down

    trend

    There's simply no view of the data that puts solar activity up over the last 30 years.


  • Registered Users Posts: 1,216 ✭✭✭sharper


    fizzycyst wrote: »
    Hi Sharper, what I don't understand is your reluctance to hear other peoples point of view on the subject of Climate change.
    Everyone has a view, what interests me is the data supporting those views. People can theorize all day and all night about what could be happening but when your views rely on things which are outright contradicted by real world observations what good are they?
    Although the connection between increased CO2 emissions and higher global temperatures is fairly solid, we have to be open to the 'global warming theory' evolving as new information comes to light. You seem to be very defensive about it, and in my opinion climatology is a relatively new science that needs to be critically analysed for many years before it is an exact science.

    Most of the discussion so far hasn't even gotten to the point of theory, it's been about observations which are quite uncontroversially true such as whether the planet is warming (yes it is) whether solar activity is increasing (no it isn't) and whether arctic ice is declining (yes it is).

    If someone is starting from a viewpoint that the planet is cooling then they're not even in the realm of climatology or any discussion about what theory explains what, they're in their own completely made up world.

    You say I'm acting defensively but I'm constantly forced onto the defensive by people claiming I'm manipulating data or that I'm a "closed book" because I don't accept things as being true which run contrary to the data I can see.


  • Closed Accounts Posts: 5,234 ✭✭✭thetonynator


    sharper wrote: »
    You keep throwing about accusations of manipulation yet you're unable to show any manipulation. You simply want to dismiss data that doesn't say what you want it to say.

    What i'm saying is, if i want to, I can go on to wood for trees and plot a graph starting at a solar minimum and ending at a maximum and it will show solar activity increasing. It wouldn't be accurate as solar activity is decreasing though. What you are doing is using the drop in activity over the last 10-15 years and saying that it is a drop since 75, not 95-00.
    sharper wrote: »
    I haven't claimed that solar activity has never increased. My point is that solar activity cannot explain temperature increases after 1980 and this is the same conclusions reached by scientists studying the link between climate and solar activity.

    Yes it can, solar activity was very high until 1995, and was still at maximum even later than that, so warming would have continued up until last year or so.


  • Registered Users Posts: 1,216 ✭✭✭sharper


    What i'm saying is, if i want to, I can go on to wood for trees and plot a graph starting at a solar minimum and ending at a maximum and it will show solar activity increasing.
    And then it would likely be pointed out the trend changes suddenly with even a small change in start and end points.

    I've shown extensively that changing the start and end points has little effect on the trend. I've also shown that when you remove the monthly variation and go with annual means the trend is actually pretty obvious but you still insist on claiming it's a manipulation.
    It wouldn't be accurate as solar activity is decreasing though. What you are doing is using the drop in activity over the last 10-15 years and saying that it is a drop since 75, not 95-00.
    As I keep saying solar activity is stable or declining. If you go back 10-15 years then you have stable solar activity. At no point do you have increasing solar activity which is what's needed to explain warming over the same time period.
    Yes it can, solar activity was very high until 1995, and was still at maximum even later than that

    No again solar activity to 1995 is still stable or declining

    none

    The second peak is clearly not as high as the first.
    so warming would have continued up until last year or so.

    Sorry but you can't explain warming with data you have to wrestle with just to make it flat.


  • Advertisement
  • Closed Accounts Posts: 5,234 ✭✭✭thetonynator


    I agree with you that activity is stable up until 1995or a bit later on all of you graphs. However it is stable when you look at a tiny section, i.e. less than 20 years. And it is stable at a high level, which corresponds perfectly with the warming trend.


Advertisement