Advertisement
If you have a new account but are having problems posting or verifying your account, please email us on hello@boards.ie for help. Thanks :)
Hello all! Please ensure that you are posting a new thread or question in the appropriate forum. The Feedback forum is overwhelmed with questions that are having to be moved elsewhere. If you need help to verify your account contact hello@boards.ie

'Bundle Up, It's Global Warming'

Options
12345679»

Comments

  • Registered Users Posts: 921 ✭✭✭MiNdGaM3


    hotwhiskey wrote: »
    Interesting Stuff!

    Looks like there was climate change or Global warming whatever take's your fancy when the Roman Empire was alive and kicking.

    http://news.sciencemag.org/sciencenow/2011/01/fall-of-rome-recorded-in-trees.html?ref=hp

    Emissions must of been high back then.:rolleyes:

    Doesn't mention temps being as warm as now? Just said there was periods with mixtures of cool/warm and wet/dry weather.... as always!


  • Registered Users Posts: 1,789 ✭✭✭BEASTERLY


    MiNdGaM3 wrote: »
    Doesn't mention temps being as warm as now? Just said there was periods with mixtures of cool/warm and wet/dry weather.... as always!

    Hopefully this will answer your question:
    143591.jpg


  • Registered Users Posts: 921 ✭✭✭MiNdGaM3


    BEASTERLY wrote: »
    Hopefully this will answer your question:
    143591.jpg

    Ah yes, from Dr Roy Spencer.
    Well, to be fair, we can all post up graphs that show what we want, so it doesn't really answer my question (whatever that question was!).
    350px-2000_Year_Temperature_Comparison.png


  • Posts: 0 [Deleted User]


    BEASTERLY wrote: »
    Hopefully this will answer your question:
    143591.jpg

    go back 6,000 years and it was warmer again (from 12,000 until 6,000 yrs ago)
    so warm that the Sahara was green with the increased evaporation and subsequent increased rains & stronger monsoons

    http://en.wikipedia.org/wiki/Neolithic_Subpluvial

    http://ngm.nationalgeographic.com/2008/09/green-sahara/gwin-text.html


    Green Sahara era, 6,500 to 4,500 years ago.
    .............


    In a dry lake bed adjacent to the dunes, they found dozens of fishhooks and harpoons carved from animal bone. Apparently the Kiffian fishermen weren't just going after small fry: Scattered near the dunes were the remains of Nile perch, a beast of a fish that can weigh nearly 300 pounds, as well as crocodile and hippo bones.


    http://news.nationalgeographic.com/news/2009/07/090731-green-sahara.html

    rising temperatures could benefit millions of Africans in the driest parts of the continent.

    greening desert picture


    Scientists are now seeing signals that the Sahara desert and surrounding regions are greening due to increasing rainfall.

    If sustained, these rains could revitalize drought-ravaged regions, reclaiming them for farming communities.

    This desert-shrinking trend is supported by climate models, which predict a return to conditions that turned the Sahara into a lush savanna some 12,000 years ago.


    The green shoots of recovery are showing up on satellite images of regions including the Sahel, a semi-desert zone bordering the Sahara to the south that stretches some 2,400 miles (3,860 kilometers).

    Images taken between 1982 and 2002 revealed extensive regreening throughout the Sahel, according to a new study in the journal Biogeosciences.

    The study suggests huge increases in vegetation in areas including central Chad and western Sudan.

    The transition may be occurring because hotter air has more capacity to hold moisture, which in turn creates more rain, said Martin Claussen of the Max Planck Institute for Meteorology in Hamburg, Germany

    http://news.nationalgeographic.com/news/2009/07/090731-green-sahara.html


  • Posts: 0 [Deleted User]


    Graphs aside the proof is there that its not as warm today as it was when the Sahara was fully vegetated and had lakes in the middle where today stand sand dunes and wasteland, we are warming though and proof is there that its not all bad - the Sahara is getting a little bit greener.

    Why dont we ever hear about the positive effects of global warming? Longer growing seasons, stronger monsoons, increased CO2 fertilisation, larger crop yields, tundra becoming arable............all we hear is talk about floods, sea levels rising above our heads and droughts. Now its global warming causing our snow


    http://icarus.nuim.ie/news-events/global-warming-linked-harsh-winters

    Hopefully sunspots will increase again, if not maybe we can increase our CO2 output to stave off a mini ice age.


  • Advertisement
  • Registered Users Posts: 921 ✭✭✭MiNdGaM3


    Graphs aside the proof is there that its not as warm today as it was when the Sahara was fully vegetated and had lakes in the middle where today stand sand dunes and wasteland, we are warming though and proof is there that its not all bad - the Sahara is getting a little bit greener.

    Why dont we ever hear about the positive effects of global warming? Longer growing seasons, stronger monsoons, increased CO2 fertilisation, larger crop yields, tundra becoming arable............all we hear is talk about floods, sea levels rising above our heads and droughts. Now its global warming causing our snow


    http://icarus.nuim.ie/news-events/global-warming-linked-harsh-winters

    Hopefully sunspots will increase again, if not maybe we can increase our CO2 output to stave off a mini ice age.

    I agree with much of that. Especially with the rising sea levels due to glacial melt from a warmer world. Surely that would just make areas that we're once inhospitable or under ice availabe to live on?

    As for the snow, as I mentioned in an earlier post, we will have a huge pool of very cold air sitting over the Arctic during winter, and if it gets moved down over our shores, we will get cold and often snowy weather. The mechanism resulting in it shifting is certainly up for debate though. A warming world doesn't exclude cold months or even years in particular areas, it's all about the global trend
    Our cold was beaten hands down (anomaly-wise) by warmth elsewhere
    compday.149.6.4.174.15.5.17.45.gif


  • Posts: 0 [Deleted User]


    MiNdGaM3 wrote: »
    A warming world doesn't exclude cold months or even years in particular areas


    agree but there is published research that indicates shifts in the jet stream and the North Atlantic Oscillation are caused by solar activity.

    http://www.sciencemag.org/content/294/5549/2149.abstract

    We examine the climate response to solar irradiance changes between the late 17th-century Maunder Minimum and the late 18th century. Global average temperature changes are small (about 0.3° to 0.4°C) in both a climate model and empirical reconstructions. However, regional temperature changes are quite large. In the model, these occur primarily through a forced shift toward the low index state of the Arctic Oscillation/North Atlantic Oscillation as solar irradiance decreases. This leads to colder temperatures over the Northern Hemisphere continents, especially in winter (1° to 2°C), in agreement with historical records and proxy data for surface temperatures.


    http://science.nasa.gov/science-news/science-at-nasa/2009/01apr_deepsolarminimum/
    "For the first time in history, we're getting to see what a deep solar minimum is really like."

    "We're experiencing a very deep solar minimum," says solar physicist Dean Pesnell of the Goddard Space Flight Center.

    "This is the quietest sun we've seen in almost a century," agrees sunspot
    expert David Hathaway of the Marshall Space Flight Center.

    The current solar minimum is part of that pattern. In fact, it's right on time. "We're due for a bit of quiet—and here it is," says Pesnell.


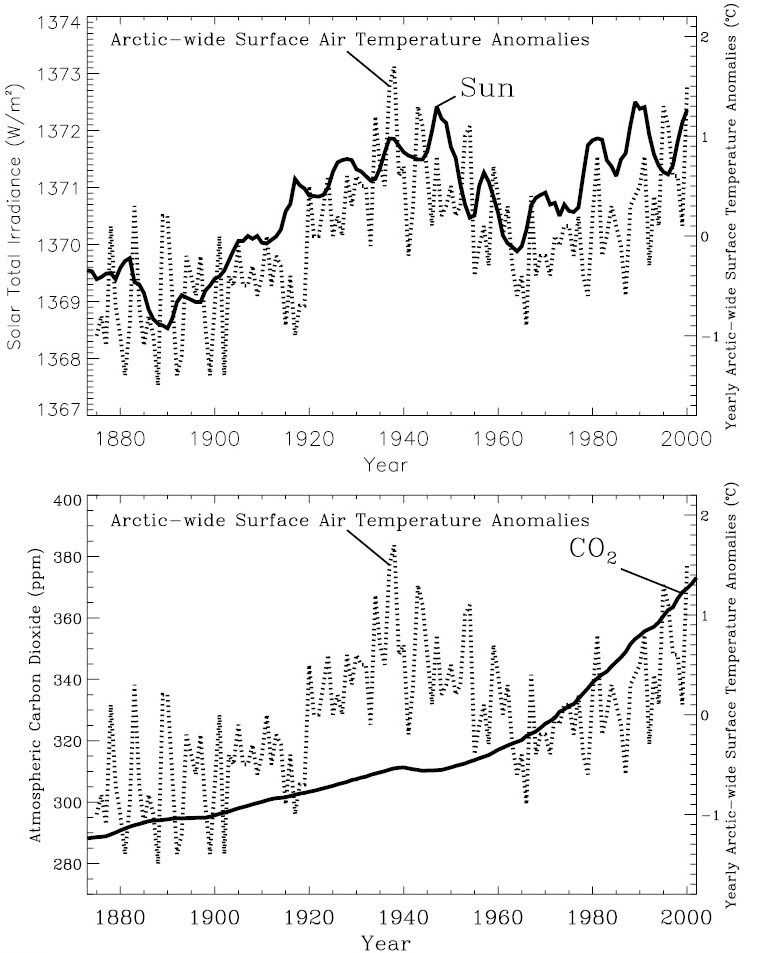
    And this again from Harvard

    SolarIrradiance.jpg

    https://www.cfa.harvard.edu/~wsoon/myownPapers-d/Soon05-SolarArcticTempGRLfinal.pdf

    Its all very fascinating but whats clear to me is that this isnt a one sided argument yet the media and governments seem to think it is all set in stone.


  • Banned (with Prison Access) Posts: 25,234 ✭✭✭✭Sponge Bob


    But was the Medieval warm period that much warmer than the Roman Warm Period across the globe ?? And why is the Dark Ages cold period of c. 450AD -700AD shown as starting in 200AD ?? The Dark Ages look like an upward excursion in this first graph :confused:
    BEASTERLY wrote: »
    Hopefully this will answer your question:
    143591.jpg


    This is a 2000 year plus record from a corner of NW Iceland around where the east Greenland Cold Current comes in contact with the Icelandic Coast. The graphic is taken from this 2010 scientific article published by the PNAS HERE

    F3.large.jpg


  • Posts: 0 [Deleted User]


    Spongebob - I find the differences in alot of the graphs showing the temp deviations from today are accounted for by the raw data sources. Some graphs are based on European and North Atlantic data - while others include sources to cover larger areas. There is debate about whether the little ice age was primarily a North Atlantic affair or more global.

    In fact the Arctic chart showing clear correlation between global warming and solar output is Arctic specific. Harvard do this purposely because most of the warming has been at the poles!! Now that today we have a solar minimum the NAO goes negative......


    The plot thickens.

    MiNdGaM3 wrote: »
    Our cold was beaten hands down (anomaly-wise) by warmth elsewhere
    compday.149.6.4.174.15.5.17.45.gif

    also agree its the global trend that is important.
    Thats why we shouldnt just focus on air temperatures....sea temperatures are also very important.
    http://www.osdpd.noaa.gov/data/sst/anomaly/anomnight.current.gif

    That picture shows cooling across the pacific Inter tropical convergence zones - where the sun shines directly. Meaning it would be felt here first if solar output dropped albeit with a delay due to the heat capacity of water


  • Registered Users Posts: 921 ✭✭✭MiNdGaM3


    agree but there is published research that indicates shifts in the jet stream and the North Atlantic Oscillation are caused by solar activity.

    http://www.sciencemag.org/content/294/5549/2149.abstract


    http://science.nasa.gov/science-news/science-at-nasa/2009/01apr_deepsolarminimum/


    And this again from Harvard

    https://www.cfa.harvard.edu/~wsoon/myownPapers-d/Soon05-SolarArcticTempGRLfinal.pdf

    Its all very fascinating but whats clear to me is that this isnt a one sided argument yet the media and governments seem to think it is all set in stone.

    There have also been published research on links between loss of ice in the Kara and Barents seas and colder winters over land in the Northern Hemisphere.
    http://www.agu.org/pubs/crossref/2010/2009JD013568.shtml

    The recent overall Northern Hemisphere warming was accompanied by several severe northern continental winters, as for example, extremely cold winter 2005–2006 in Europe and northern Asia. Here we show that anomalous decrease of wintertime sea ice concentration in the Barents-Kara (B-K) seas could bring about extreme cold events like winter 2005–2006.

    Odd how much higher the TSI is and how much more it varies on the Harvard graphs than others I've seen.
    2lnvbys.jpg
    In fact the Arctic chart showing clear correlation between global warming and solar output is Arctic specific. Harvard do this purposely because most of the warming has been at the poles!! Now that today we have a solar minimum the NAO goes negative......


    The plot thickens.

    also agree its the global trend that is important.
    Thats why we shouldnt just focus on air temperatures....sea temperatures are also very important.
    http://www.osdpd.noaa.gov/data/sst/anomaly/anomnight.current.gif

    That picture shows cooling across the pacific Inter tropical convergence zones - where the sun shines directly. Meaning it would be felt here first if solar output dropped albeit with a delay due to the heat capacity of water

    The cooling tropical Pacific is mainly down to the strong La Nina being experienced I would have thought? It would be very difficult to show that it the result of a lower TSI. Perhaps if other tropical seas were cooling, we could discount it being down to just La Nina, but recently they've been warming.
    SSTs.gif


  • Advertisement
  • Registered Users Posts: 1,216 ✭✭✭sharper


    BEASTERLY wrote: »
    Hopefully this will answer your question:
    143591.jpg
    The reconstruction you're displaying (Loehle) ends in 1930 with the dotted line representing instrumental temperatures upto 1990. Displaying something like that in reference to temperatures "now" is dishonest.

    This is a plot of a number of different reconstructions including Loehle's most recent work and temperatures which could actually be described as being "now"

    http://www.skepticalscience.com/news.php?p=4&t=168&&n=394

    recon_lj_with_others.png

    Doesn't give quite the same impression does it?


  • Registered Users Posts: 1,216 ✭✭✭sharper


    That picture shows cooling across the pacific Inter tropical convergence zones - where the sun shines directly. Meaning it would be felt here first if solar output dropped albeit with a delay due to the heat capacity of water
    We're currently in La Nina, cooling across the pacific is entirely expected.

    http://www.nasa.gov/topics/earth/features/strong-la-nina.html
    New NASA satellite data indicate the current La Niña event in the eastern Pacific has remained strong during November and December 2010.

    A new Ocean Surface Topography Mission (OSTM)/Jason-2 satellite image of the Pacific Ocean that averaged 10 days of data was just released from NASA. The image, centered on Dec. 26, 2010, was created at NASA's Jet Propulsion Laboratory (JPL), Pasadena, Calif.

    "The solid record of La Niña strength only goes back about 50 years and this latest event appears to be one of the strongest ones over this time period," said Climatologist Bill Patzert of JPL. "It is already impacting weather and climate all around the planet."

    Slight changes in solar activity is not a good explanation for natural variability.
    Cooling sea surface temperatures were expected without any change in forcings.


  • Posts: 0 [Deleted User]


    sharper wrote: »
    We're currently in La Nina, cooling across the pacific is entirely expected.

    http://www.nasa.gov/topics/earth/features/strong-la-nina.html


    Slight changes in solar activity is not a good explanation for natural variability.
    Cooling sea surface temperatures were expected without any change in forcings.


    it is expected - but the sea has been warming and cooling long before we have been pumpin Co2 out so there must be a reason for this variability.


  • Registered Users Posts: 1,216 ✭✭✭sharper


    it is expected - but the sea has been warming and cooling long before we have been pumpin Co2 out so there must be a reason for this variability.
    Er no. The oceans experience regular cycles of warming and cooling without any change in forcing whatsoever. Your attribution of "solar" to this is reflexive and makes no sense.

    Start here

    http://www.skepticalscience.com/Is-Pacific-Decadal-Oscillation-the-Smoking-Gun.html
    pdo_temp.gif

    Imposed on top of the normal cycles is a global trend of warming. This is also not explainable by solar activity. TSI varies by about 0.1% from minimum to maximum and has been stable or declining for decades.


Advertisement