Advertisement
If you have a new account but are having problems posting or verifying your account, please email us on hello@boards.ie for help. Thanks :)
Hello all! Please ensure that you are posting a new thread or question in the appropriate forum. The Feedback forum is overwhelmed with questions that are having to be moved elsewhere. If you need help to verify your account contact hello@boards.ie

Archive charts

Options
  • 20-11-2023 11:36pm
    #1
    Registered Users Posts: 294 ✭✭


    I just thought this might be interesting to see some eye candy charts from the past (especially as I don't know how to post them myself) .

    Maybe the more technical minded people on here might indulge,from winter wonderlands, heatwaves and storms from yesteryear. The one archive chart that evades me is the 1839 January 6 to 7th night of the big wind. The archive chart shows a flabby low pressure of 975 to the North of Ireland rather than a 918. Hurricane Debbie from 1961 does not show anything significant either, so even though it shows other storms and cold snaps etc, it makes you wonder is there a flaw in some of these archive charts. I'm using various charts from weathercharts.org.

    Thanks


«1

Comments

  • Registered Users Posts: 6,036 ✭✭✭Elmer Blooker


    I have noticed flaws in these archive charts before, for example 1052hpa (a record) recorded at Valentia on Jan 20 1905 but …

    … can these archive charts be taken seriously?


  • Registered Users Posts: 13,507 ✭✭✭✭sryanbruen


    It was on the 28th, not the 20th.

    Plus keep in mind those archive charts from ages ago are relying on very limited pressure data. We had no satellites, no weather balloons etc then. NCEP reanalysis charts have a pretty low resolution.


  • Registered Users Posts: 6,036 ✭✭✭Elmer Blooker


    I see, one of my old weather books gathering dust on the shelf (The Climate of Ireland by P K Rohan) from the pre internet era states incorrectly that it was on Jan 20th.

    Barometer readings would have been meticulously taken by ships, weather stations etc in those days, otherwise meteorology was obviously very primitive.


  • Registered Users Posts: 13,507 ✭✭✭✭sryanbruen


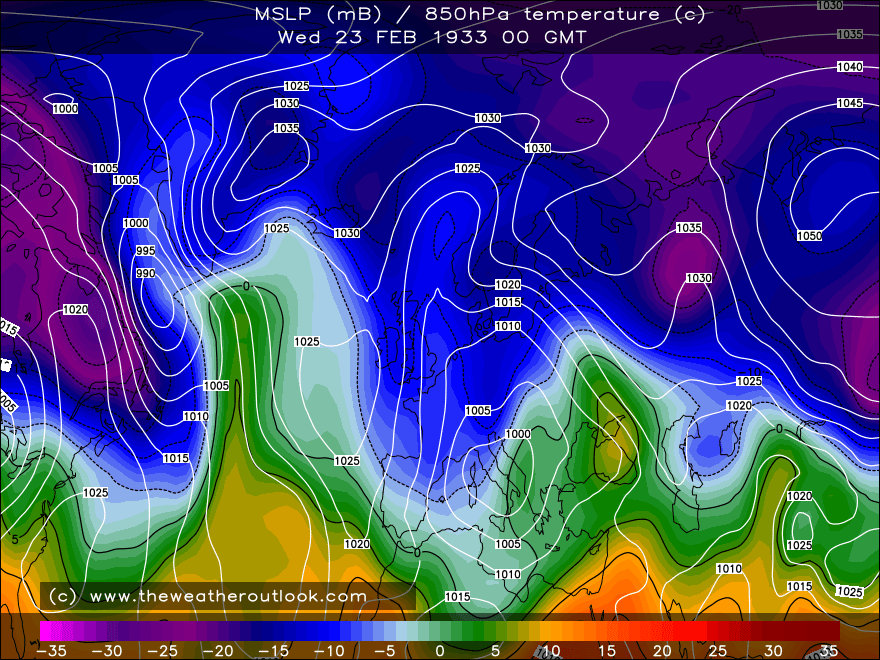
    The most "eye candy" chart in terms of high latitude blocking for me in Europe goes to February 1895.

    A total reversal of the normal flow with easterly winds from Russia all the way to North America with blocking from Canada to Russia. This resulting in one of the most intense cold spells Ireland has had since reliable records began.

    28 February 2018 gets some points too, somewhat similar but I'd argue not quite as extreme.

    January 1940 is a crazy one for Arctic blocking and see that black spot over northeast Europe, that's 850hPa temperatures as low as -43C!


  • Registered Users Posts: 6,036 ✭✭✭Elmer Blooker


    I love this one, day two of a three day snowstorm in 1917 and it doesn’t even look particularly cold!

    It looks like a southeasterly but in a ‘battle ground’ situation the isobars are aligned se-nw with the wind easterly. The big snowstorms of Feb 1947 and Jan 1982 also look like southeasterlies.


  • Advertisement
  • Registered Users Posts: 294 ✭✭Robwindstorm


    My god, talking about being in the freezer with some of those type winters. I suppose 2010 was something similar. It's amazing how far the jetstream sinks, into Africa. February 2018 definitely gets some exceptional points.


  • Registered Users Posts: 294 ✭✭Robwindstorm


    Just a note. On Wikipedia under the title 'legacy ' from the night of the big wind 6/7 January 1839, there is a photo of a building in Cheshire with a plaque on it stating 'this building was damaged in the great gale of January 1st 1839'. Just thought the dates don't collaborate?


  • Registered Users Posts: 1,506 ✭✭✭Billcarson


    Doesn't looking like anything stormy Jan 1st 1839.


  • Registered Users Posts: 16,637 ✭✭✭✭nacho libre


    That 1895 chart is crazy. How long did it take for the normal flow to resume? Let's hope we see a repeat of 1895 , 1963, 1947 or 2010 this year- I am not picky any of those years will do.


  • Registered Users Posts: 16,637 ✭✭✭✭nacho libre


    This must have been due to our good friend the Polar low.

    http://www.irishidentity.com/extras/weather/stories/bigsnow.htm


  • Advertisement
  • Registered Users Posts: 294 ✭✭Robwindstorm


    I was just looking at the weather set up for hurricane debbie in Ireland 1961 and again the archive charts are very poor in their depiction of the storm. They just show an average autumnal windy day with a depression of 980 at it's deepest. As syran pointed out about the 1839 storm, there was no accurate information at that time, but surely in 1961 there was better available. As MT pointed out in a thread I just found a couple of years back about the 1839 storm, there is enough information available today to draw up a more accurate synoptic chart of such events. It definitely does not give much confidence in archive charts over 50 years ago.


  • Registered Users Posts: 294 ✭✭Robwindstorm


    Thanks very much for that, interesting reading and the best maps I have seen to show what probably happened.


  • Registered Users Posts: 13,507 ✭✭✭✭sryanbruen


    The whole month was virtually easterly though high pressure did collapse over us by mid-month which only led to more severe frosts. It became a mid-Atlantic ridge feature by the end into early March. Mind that the cold had been ongoing since mid-January 1895 too. Here's a link to my old 1895 historic post as a reminder though all the charts are gone because of the Boards "makeover" 🙄 https://www.boards.ie/discussion/comment/112343684#Comment_112343684

    Here's some more "eye candy" charts.

    18th January 1881, a deep Channel low bumping into entrenched cold air (Ireland's most severe cold spell on reliable records) and a bitterly cold strong easterly wind. Not much is known about the exact numbers of snow depths in Ireland during this month but given the severity of the frosts regularly in the minus double digits widely, you would think there was a lot. Markree set the Irish national record low this month 2 days prior with -19.1C and had 13 days with mins of -10C or lower, almost half the month. This low would deliver one of southern England's biggest snow events on record.

    A proper Scandi and beast from the east on 1st February 1956. An extremely cold month for Europe. Marseilles, France had a monthly mean temperature of -1.2C, this was over 3.2C colder than its second coldest month showing how extreme it was. Ireland often being on the periphery but it was a cold month here too and it began severe.

    And for the northern folk, a polar low within an entrenched cold airmass just after Christmas 2000 😏 Knock Airport 17cm and Aldergrove 19cm from this. Over 7cm fell in one hour at Knock Airport on the afternoon of the 27th December, very heavy snow.


  • Registered Users Posts: 294 ✭✭Robwindstorm


    Wow, that 1881 chart looks serious cold.

    What was the setup for February 1986. I remember it being mostly dry but harsh frosts. I remember as a young lad trying to constantly defrost water for cattle on my dad's farm.


  • Registered Users Posts: 16,637 ✭✭✭✭nacho libre


    I remember the heavy snow from that event in 2000. It looks like the uppers during that in the north were colder than in 2010 . I still prefer 2010 though. I wonder will we ever see another cold spell like it. I'd have given the 2010 spell full marks if we had falling snow on Christmas eve into Christmas Day.


  • Registered Users Posts: 6,036 ✭✭✭Elmer Blooker


    You really would wonder how two bitterly cold and snowy Jans started like this, there must have been a ssw to cause such a dramatic turnabout as a pattern such as these generally persists?


  • Registered Users Posts: 6,036 ✭✭✭Elmer Blooker


    how the polar low northerly blast of January 1958 began, a big high in its usual place quickly moved towards Greenland and the flood gates opened!

    this is what we want to happen now but not a snowballs chance in hell of this happening in a 21st century winter, maybe late March or April?


  • Registered Users Posts: 6,036 ✭✭✭Elmer Blooker


    another one … an intense high right on top of us .. and hey presto .. a big Greenland high and in only two days!

    We just don’t get northerly blasts like this anymore.

    Snow lay for a week at Dublin Airport in Feb 1960.


  • Registered Users Posts: 294 ✭✭Robwindstorm


    Great charts Elmer. I suppose 2018 was the closest we got recently even though that 1958 chart was a northerly. I might get to master posting charts myself someday 🤔


  • Advertisement
  • Registered Users Posts: 6,036 ✭✭✭Elmer Blooker


    The very cold February 1969 begins.

    a northerly (with a Polar low down down eastern England) develops in only two days … compare that with now when trying to get a northerly/Greenland block is like getting wisdom teeth extracted!


  • Registered Users Posts: 1,506 ✭✭✭Billcarson


    It's mad how things could change so quickly looking at the charts posted in this thread . Take early Jan 1977. 4th Jan a poor chart for cold weather but a few days later by the 9th all change. These days we keep getting stuck in ruts that can go on for weeks.


  • Registered Users Posts: 13,507 ✭✭✭✭sryanbruen


    This 1960 one was likely aided by a major SSW through early to mid-January 1960. Effects from it were being felt as far out as mid-March at least in terms of the AO.

    The infamous 1947 freeze was also probably caused by a major SSW PV split as recent ERA-5 reanalysis has come out to reveal a significant warming of the stratosphere through January 1947. Not sure where they get the data from to be able to reanalyse that as stratospheric records began in the 1950s I'd have thought but there we are. Doesn't surprise me if true though as we were pretty much in easterly winds all the way from the third week of January to the first week of March which is unprecedented, at least in reliable records, for longevity for this part of the world.


    Post edited by sryanbruen on


  • Registered Users Posts: 294 ✭✭Robwindstorm


    Check out the whole month of February 1986. Mainly dry but very frosty.


  • Registered Users Posts: 16,637 ✭✭✭✭nacho libre


    So the common theme looking at all these charts seems to be no significant cold outbreaks happen without some kind of major stratospheric warming, there maybe rare times when it happens, but they seem to be very much the exception. Sryan over to you on that one:)


  • Registered Users Posts: 6,036 ✭✭✭Elmer Blooker


    another dramatic two day turnabout, the rise in pressure between Scotland and Iceland is phenomenal !

    you can get cold spells with a big Azores but very rare I would think?


  • Registered Users Posts: 13,507 ✭✭✭✭sryanbruen


    I find with the strongest Azores Highs (and simultaneously, a very very positive NAO), they tend to be more "distorted" rather than flat so we get more of a NW'ly influence which can bring wintry weather but of course rarely anything too significant and any snow is very wet in nature, difficult to accumulate. That's not a confirmed fact though, it's just an anecdote of mine. Delves mainly from the fact that the most +NAO winter on record was 2014-15 and 1983-84 was also up there, both were very NW'ly driven. One other occasion that had a massive 1050mb+ Azores High similar to what is expected on some model runs for December 2023 is January 2003 which had exceptionally mild conditions followed by a northerly blast that affected the UK more but was noteworthy in that era which was very lacklustre for winter weather too.

    February 1986 didn't have any stratospheric feedback as far as I'm aware @nacho libre. Zonal winds were persistently strong throughout that 1985-86 season until mid-March (at least in the upper strat, there was a significant deceleration in the bottom strat during November 1985) when the final warming occurred and it was quite a dynamic one which likely played a part in how April 1986 was so cold. More often than not, I find the significant blocking periods tend to have some kind of stratospheric feedback with the MJO also playing a role.

    Here's a "forgotten" beast from the east. Yes it's 1894, I know 😂 but forgotten I mean by even historians. It came within an otherwise mostly mild winter, at least for the era.

    Birr Castle had a max of -7.3C on 6th January 1894 with a minimum temp of -15.6C. It was quite short-lived as shown by its daily temp returns.

    1st 4.8C, -2.3C

    2nd 2.0C, -2.1C

    3rd 1.9C, -1.7C

    4th 1.2C, -3.7C

    5th -2.5C, -8.1C

    6th -7.3C, -15.6C

    7th -0.1C, -8.4C

    8th 5.4C, -3.4C

    9th 8.2C, 2.1C

    10th 11.6C, 7.4C

    Its mean monthly temp was -3.0C after the first 7 days. That had risen to -0.5C in just 3 days to the 10th.


  • Registered Users Posts: 16,637 ✭✭✭✭nacho libre


    That's incredible to see -14 and -15 upper air temperature over Ireland! Its also a surprise that it was so brief, so much for deep cold being hard to shift. I guess we'll never know if -20 upper air ever got this far. Maybe it happened during the so called mini ice age period.


  • Registered Users Posts: 6,036 ✭✭✭Elmer Blooker


    what would I do to see charts for the winter of 1739-40! January 1814 too - “the snow was so heavy in Dublin people couldn’t leave their houses” according to one report.


  • Advertisement
  • Registered Users Posts: 294 ✭✭Robwindstorm


    Just remembering back to more recent white Christmases, 2004 had a good blanket of snow. Checking the charts it appears to have come down from the northwest originally


Advertisement