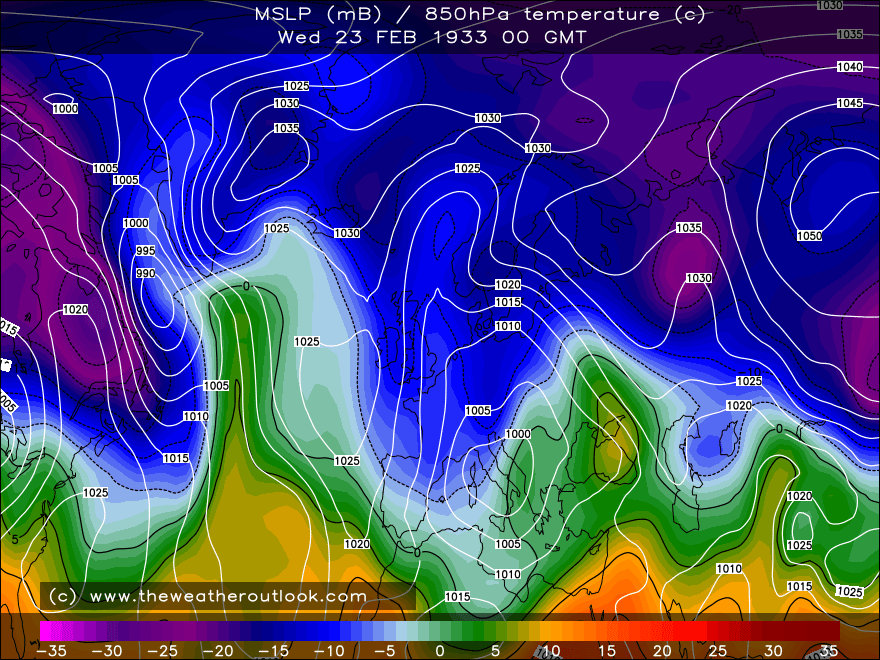
I just thought this might be interesting to see some eye candy charts from the past (especially as I don't know how to post them myself) .
Maybe the more technical minded people on here might indulge,from winter wonderlands, heatwaves and storms from yesteryear. The one archive chart that evades me is the 1839 January 6 to 7th night of the big wind. The archive chart shows a flabby low pressure of 975 to the North of Ireland rather than a 918. Hurricane Debbie from 1961 does not show anything significant either, so even though it shows other storms and cold snaps etc, it makes you wonder is there a flaw in some of these archive charts. I'm using various charts from weathercharts.org.
Thanks