Advertisement
If you have a new account but are having problems posting or verifying your account, please email us on hello@boards.ie for help. Thanks :)
Hello all! Please ensure that you are posting a new thread or question in the appropriate forum. The Feedback forum is overwhelmed with questions that are having to be moved elsewhere. If you need help to verify your account contact hello@boards.ie

Interesting Maps

Options
199100102104105235

Comments

  • Registered Users Posts: 4,597 ✭✭✭dan1895


    https://twitter.com/KPD_1895/status/1395699174788710403?s=19

    Every country Shelbourne FC have played a European tie in.


  • Moderators, Sports Moderators Posts: 7,153 Mod ✭✭✭✭cdeb


    Probably technically they've played the odd one or two in Ireland as well?

    (Except that one against Rangers of course)


  • Registered Users Posts: 5,378 ✭✭✭Duffy the Vampire Slayer


    Putain is considered stronger than merde, combining them is putain de merde, which is saved for the worst case scenarios :D

    The kid friendly versions of these you often hear are puree (=mashed potatoes) or mercedi (=wedensday).

    Similarly, Spanish speakers say "miercoles" (Wednesday) in place of "mierda" (****).


  • Registered Users Posts: 4,597 ✭✭✭dan1895


    cdeb wrote: »
    Probably technically they've played the odd one or two in Ireland as well?

    (Except that one against Rangers of course)

    Everywhere but Ireland. England is red because the game against Rangers was in Birkenhead.


  • Closed Accounts Posts: 168 ✭✭Fake Scores


    E19-Hqtt-Xs-AEEqao-jpeg.jpg


  • Advertisement
  • Registered Users Posts: 4,393 ✭✭✭KevRossi


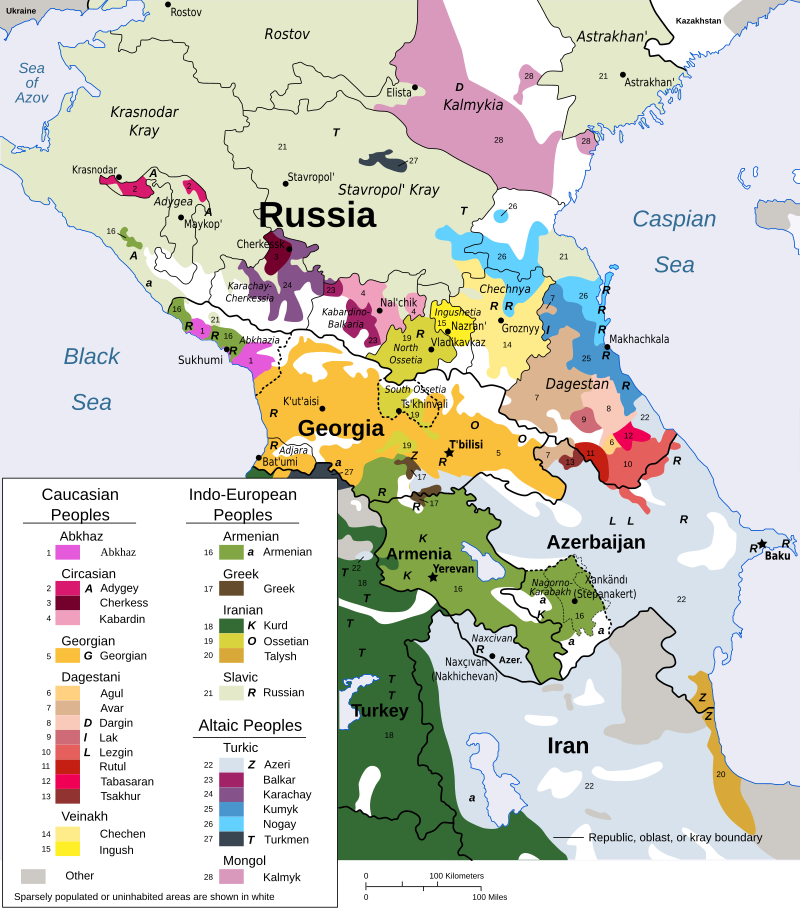
    A map of ethnic groups in the Caucas region. One of the most incredibly diverse places on earth.

    For reference, the map measures about 1,200 km (N-S) x 900 km (E-W).


    800px-Caucasus-ethnic_en.svg.png


  • Registered Users Posts: 4,685 ✭✭✭ablelocks


  • Moderators, Social & Fun Moderators Posts: 12,587 Mod ✭✭✭✭JupiterKid


    Map of Eurovision Song Contest winning countries, 1956-2021

    11417_zcmiuzjqoc5vfpow.jpeg


  • Registered Users Posts: 18,923 ✭✭✭✭BonnieSituation


    JupiterKid wrote: »
    Map of Eurovision Song Contest winning countries, 1956-2020

    11417_zcmiuzjqoc5vfpow.jpeg

    Every year since we've been in the doldrums and Sweden got to 6 I've been fiercely anti-Sweden during the contest.

    The early 90s were frankly insane with us. 94 being the obvious peak.


  • Registered Users Posts: 8,324 ✭✭✭Gloomtastic!


    ^ I thought Iceland won once. :confused: Why is Croatia shaded differently?


  • Advertisement
  • Registered Users Posts: 78,262 ✭✭✭✭Victor


    ^ I thought Iceland won once. :confused: Why is Croatia shaded differently?
    I think the act won when they represented Yugoslavia, not Croatia.


  • Registered Users Posts: 18,923 ✭✭✭✭BonnieSituation


    ^ I thought Iceland won once. :confused: Why is Croatia shaded differently?

    Yugoslavia won it in 1989.

    In 1990 it was hosted in Zagreb, so it's a logical place to put the Yugoslav win I guess.

    Iceland have never won it.


  • Registered Users Posts: 8,175 ✭✭✭Quantum Erasure


    ^ I thought Iceland won once. :confused: Why is Croatia shaded differently?

    The Yugoslav winner in 1989 was from Croatia


  • Registered Users Posts: 3,736 ✭✭✭silliussoddius


    KevRossi wrote: »
    A map of ethnic groups in the Caucas region. One of the most incredibly diverse places on earth.

    For reference, the map measures about 1,200 km (N-S) x 900 km (E-W).


    800px-Caucasus-ethnic_en.svg.png


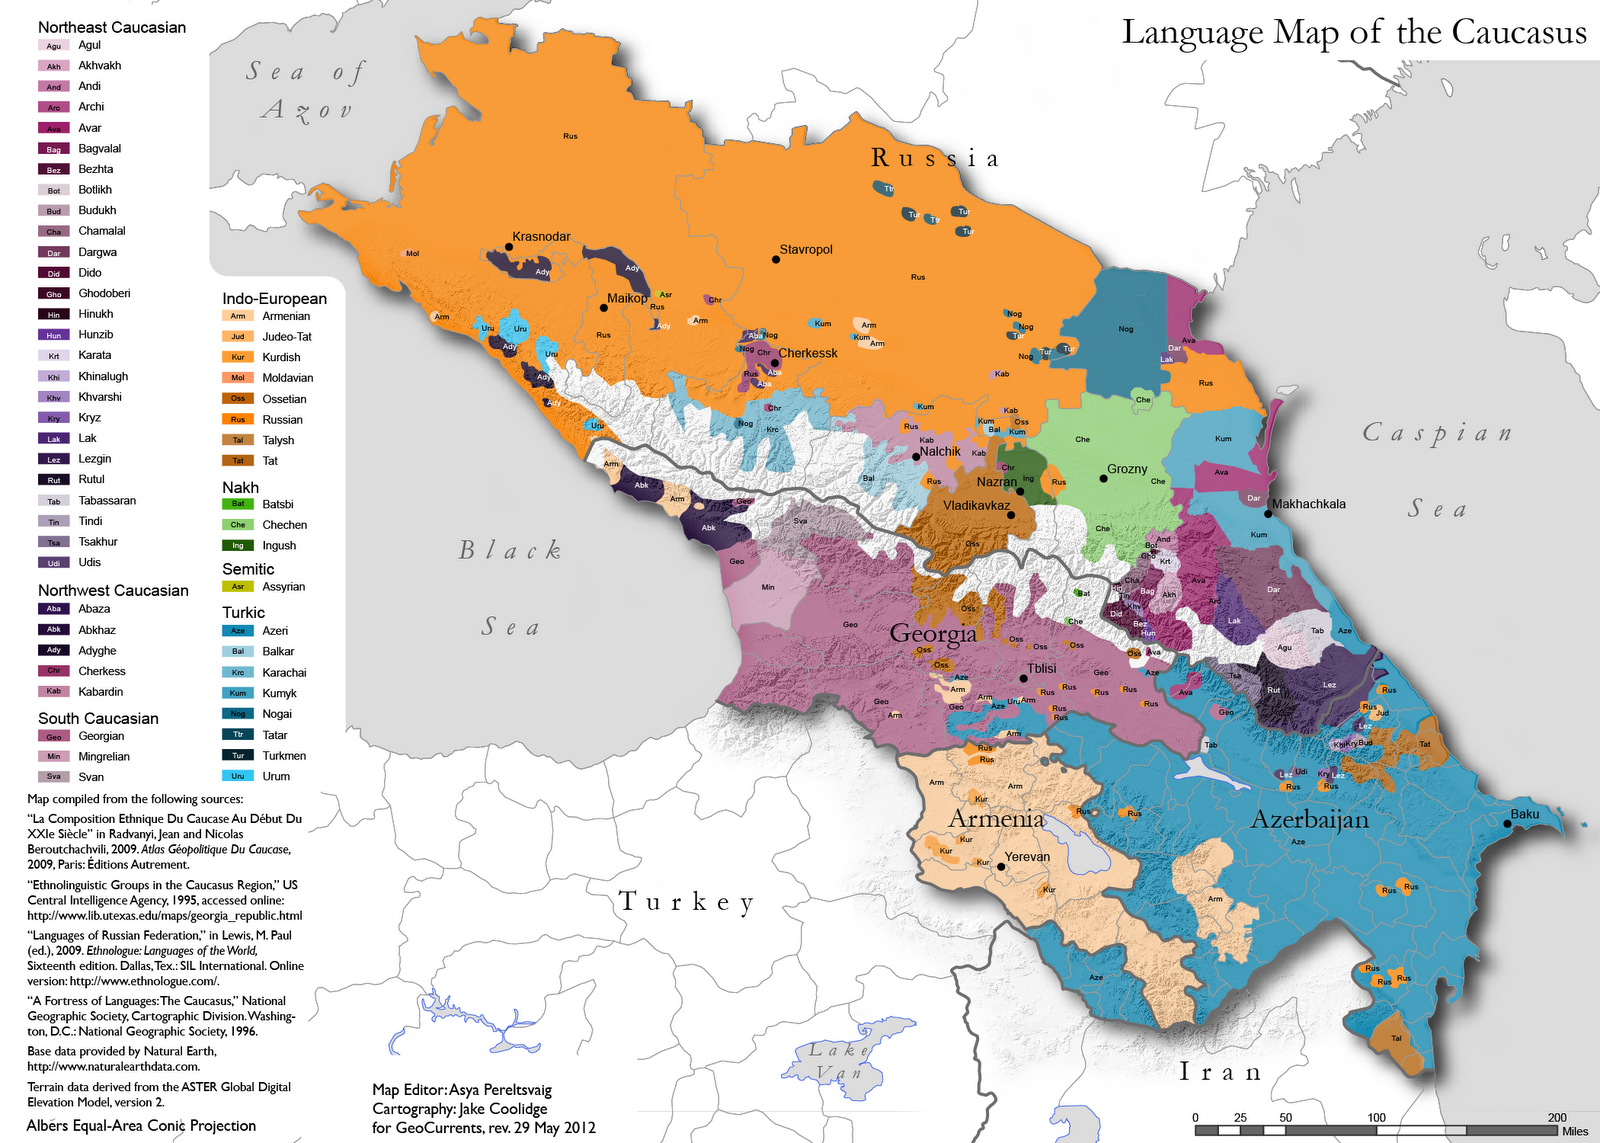
    Similar, with more detail. I think the term Altaic is no longer used and Turkic is considered more accurate.

    CaucasusLayout_rev.png


  • Registered Users Posts: 8,507 ✭✭✭blackwhite


    Iceland have never won it.

    Not even with Ja Ja Ding Dong?


  • Registered Users Posts: 4,393 ✭✭✭KevRossi


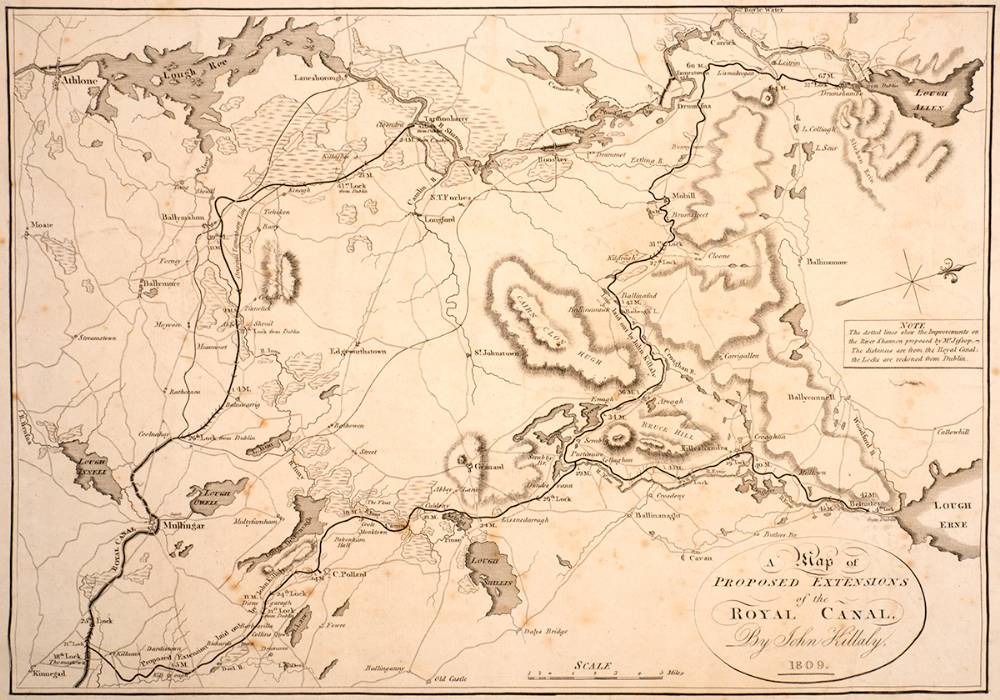
    A map of a proposed extension of the Royal Canal, from Kinnegad to Lough Allen and Lough Erne from 1809.

    (The map is on it's side, so the top of the page is 'West'.

    60842.jpg


  • Moderators, Politics Moderators Posts: 38,907 Mod ✭✭✭✭Seth Brundle


  • Moderators, Politics Moderators Posts: 38,907 Mod ✭✭✭✭Seth Brundle


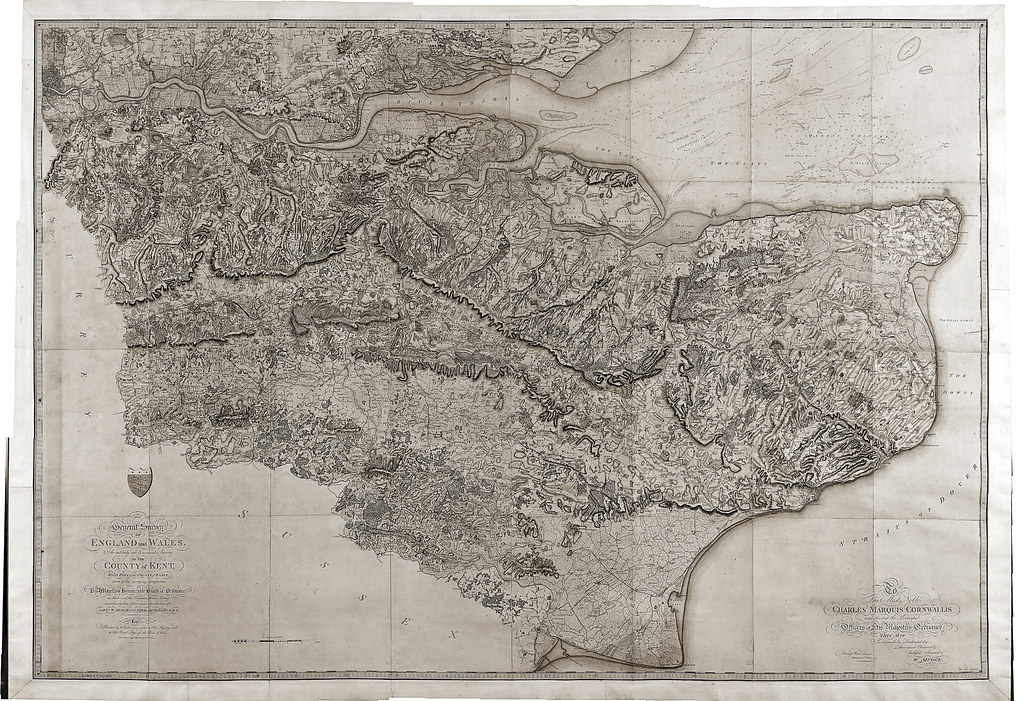
    An Entirely New & Accurate Survey Of The County Of Kent, With Part Of The County Of Essex was created by William Mudge in 1801 and is regarded at the first official Ordnance Survey (UK) map.
    Following a rebellion in 1745 in the Scottish Highlands, our origins were established in military strategy. These roots developed over time and, as the French Revolution was causing increased fear for the government, its defence ministry was ordered to begin a survey of England’s most exposed southern coasts to protect the nation. The name of this ministry was, yes you guessed it, the Board of Ordnance!

    At the time Kent, England’s most south-easterly county, was identified to have had the most vulnerability in its coast line and therefore the highest susceptibility to the French invasion. As a result, the first map we ever made was of Kent in 1801. It focused on communication routes and included hill shading to ensure men at arms could interpret the landscape with precision. Over time, this map design became less focused on these elements and was developed to appeal to a much wider audience.

    Produced to a scale of one inch to one mile, the map took three years to complete and was finished in the drawing room at our original offices, the Tower of London. It was printed by William Faden of Charing Cross, a then leading cartographer and map publisher.

    At this time, maps were engraved back to front on copper plates and separate legends were created for the symbols as the maps were big enough without them. The first maps were sold at three guineas (£3 3s) per county survey, which was between one and three weeks’ wages for the average person.
    https://www.ordnancesurvey.co.uk/newsroom/blog/the-beginning-of-our-paper-maps?utm_source=twitter&utm_medium=social&utm_term=&utm_content=&utm_campaign=69bfe499-6521-4724-a0d8-0ff9f8bc2354

    6210633144_3db0f0d60f_b.jpg


  • Registered Users Posts: 5,471 ✭✭✭Charles Babbage


    European purchasing power

    main-qimg-4abdcc9b4bbea83d13910a1ad0f8346e


  • Registered Users Posts: 14,016 ✭✭✭✭retalivity


    Looks like they cheated and just made everywhere in Iceland and Norway red and everywhere in Ukraine and Belarus blue.
    No overspill at the old Iron curtain borders either, between the Baltic and the Adriatic


  • Advertisement
  • Registered Users Posts: 9,381 ✭✭✭Yurt2


    retalivity wrote: »
    Looks like they cheated and just made everywhere in Iceland and Norway red and everywhere in Ukraine and Belarus blue.
    No overspill at the old Iron curtain borders either, between the Baltic and the Adriatic


    It makes sense. The Icelandic krona and Norwegian krone are extremely strong currencies and their economies are highly redistributive. In dollar or euro terms, someone working in a convenience store or a fish processing facility in either country has way more purchasing power than even upper-middle class punters in Ukraine or Belarus who (I'm only presuming) have sh*thouse currencies.


  • Registered Users Posts: 5,471 ✭✭✭Charles Babbage


    It is notable in the above map that Italy has the big regional differences for which it is well known, but in Britain even Wales or the North-East are not so far away. Also Denmark is notably higher than Sweden or Finland. Ireland would do well to learn from Denmark.


  • Registered Users Posts: 5,733 ✭✭✭Duckworth_Luas


    Is this map not showing what is basically the cost of living by region.

    For example, it's much more expensive to buy the same basket of goods anywhere in Switzerland than anywhere in Romania.


  • Registered Users Posts: 78,262 ✭✭✭✭Victor


    Is this map not showing what is basically the cost of living by region.

    For example, it's much more expensive to buy the same basket of goods anywhere in Switzerland than anywhere in Romania.
    Not quite.

    If you earn €500/week, yes, you can buy less in Switzerland than in Romania. However, if you earn €1,000/week in Switzerland, but only €100/week in Romania there is a big shift. However you can but 10 times as much, because your rent in Switzerland is much more than it is in Romania*.


    * exceptionally few people rent in Romania, but you get the idea.


  • Moderators, Category Moderators, Arts Moderators, Sports Moderators Posts: 48,405 CMod ✭✭✭✭magicbastarder


    yes, but which does the map show? absolute or relative purchasing power?


  • Registered Users Posts: 2,605 ✭✭✭yagan


    yes, but which does the map show? absolute or relative purchasing power?
    I'd be inclined to think it's absolute rather than relative purchasing power.

    I know a good few Polish who returned to jobs at home because cost of living relative to wages is better than Ireland.


  • Registered Users Posts: 393 ✭✭Mullinabreena


    yagan wrote: »
    I'd be inclined to think it's absolute rather than relative purchasing power.

    I know a good few Polish who returned to jobs at home because cost of living relative to wages is better than Ireland.
    I'd believe that alright. I took a pay cut leaving Dublin for Sligo and I'm significantly better off.


  • Moderators, Category Moderators, Arts Moderators, Sports Moderators Posts: 48,405 CMod ✭✭✭✭magicbastarder


    hard to see for certain, but louth seems much better off than expected in that graphic?


  • Registered Users Posts: 40,159 ✭✭✭✭ohnonotgmail


    hard to see for certain, but louth seems much better off than expected in that graphic?

    all the dubs with jobs in dublin


  • Advertisement
  • Registered Users Posts: 8,913 ✭✭✭Gregor Samsa


    Three proposed borders in the north east of Ireland from 1914 - at a time when "Ulster" was looking to be excluded from Home Rule.

    The third one became the official border of the Irish Free State in 1922, and remained so when the Boundary Commission failed to offer an alternative.

    1. WF Bailey (Estates Commissioners Office)

    image.jpg

    "Taking WF Bailey first, his was the most disruptive scheme and it paid the least heed to existing administrative boundaries. Instead, Bailey relied on physical geography to craft a more visible border. In Fermanagh, Bailey cut straight through both of the county’s parliamentary divisions, running his boundary line directly up the middle of the Erne waterways system. Of the three schemes, Bailey’s was the only one in which his accompanying notes made no acknowledgement to the scheme’s temporary nature. Bailey used physical geography to create a visible and less permeable boundary line further suggesting he had a permanent settlement in mind."


    2. Sir Henry Robinson (Vice-President of the Irish Local Government Board)

    image.jpg

    "By far the most thorough of the three exclusion schemes was that devised by Sir Henry Robinson. In drawing his boundary line, Robinson took local government boundaries as his operational unit: a method his Undersecretary would later dismiss as unworkable. Robinson had drawn up the local authority areas for the Local Government Act in 1898 and appears to have been proud of the administrative subunits he had designed at that time.

    The Robinson scheme proposed the exclusion of 26.85 percent of the population of Ireland and 28.58 percent of Ireland’s land by valuation. Robinson’s exclusion zone was two-thirds Protestant and one-third Catholic. Of the three, Robinson’s boundary line was the only one which explicitly considered infrastructure like road and rail connections."

    3. Sir James Dougherty (Undersecretary to the The Chief Secretary for Ireland)

    image.jpg

    "The third and final scheme to be submitted was that of Undersecretary Dougherty, the highest-ranking civil servant in Ireland and, as a native of Garvagh in the east of Co Derry, the only Ulsterman among the three men consulted. Dougherty first wrote on May 7th explaining that it would be “a difficult, if not impossible job to construct these pens” and that “the policy of exclusion, whatever plan may be adopted, bristles with difficulties and … I do not see how they are to be surmounted.”

    Only with the inauguration of the Irish Free State in December 1922 did the boundary line officially become an international border. Its form remained fluid until the collapse of the Boundary Commission three years later, confirming Dougherty’s 1914 line as the Border ever since."

    Full article: https://www.irishtimes.com/culture/heritage/plotting-partition-the-other-border-options-that-might-have-changed-irish-history-1.4556046


Advertisement