Advertisement
If you have a new account but are having problems posting or verifying your account, please email us on hello@boards.ie for help. Thanks :)
Hello all! Please ensure that you are posting a new thread or question in the appropriate forum. The Feedback forum is overwhelmed with questions that are having to be moved elsewhere. If you need help to verify your account contact hello@boards.ie

The Afternoon Show: Mandatory Cycle Helmets

Options
124»

Comments

  • Closed Accounts Posts: 18,056 ✭✭✭✭BostonB


    tomasrojo wrote: »
    Good point. No, the numbers fell substantially between counts done before and after compulsion, at a very noticeably steeper rate. I think in Victoria numbers had been rising until compulsion.

    I'll try to find the numbers

    Maybe I'm reading it wrong but it looks like the trend reversed just before the compulsion. Not that I wouldn't expect complusion to have a huge effect. Most cyclist I see, cycle in ordinary clothes and on a old crock. So bascially just hop on a bike. You couldn't do that if you had to bring a helmet, or a light for that matter.


  • Registered Users Posts: 11,747 ✭✭✭✭tomasrojo


    BostonB wrote: »
    Maybe I'm reading it wrong but it looks like the trend reversed just before the compulsion. Not that I wouldn't expect complusion to have a huge effect. Most cyclist I see, cycle in ordinary clothes and on a old crock. So bascially just hop on a bike. You couldn't do that if you had to bring a helmet, or a light for that matter.
    I see what you mean, but judging by that graph, for both cases the rates of increase were slowing (first order differential positive, second order negative: decelerating rates essentially), but they were both increasing until compulsion. They didn't even flatline at compulsion; the trend reversed. The blue line in particular is a very drastic drop.

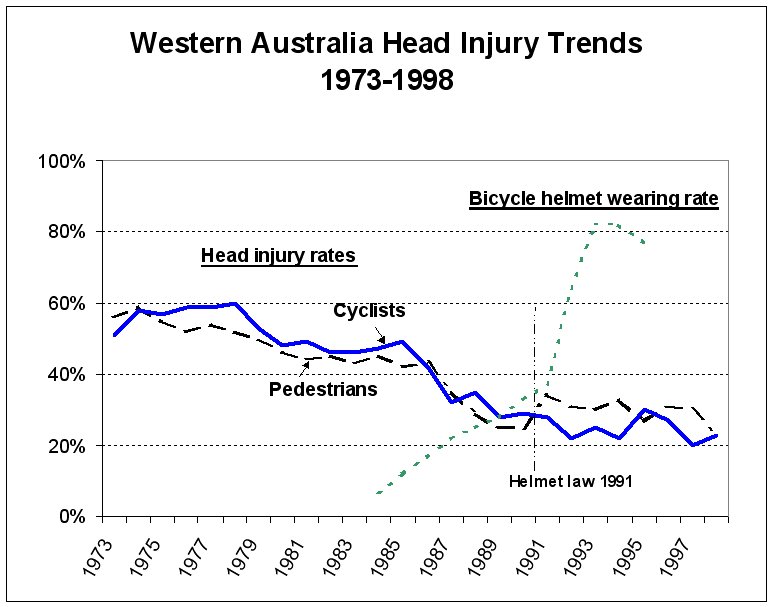
    And it has to be kept in mind that the whole reason for this law was that "helmets are 85% effective in preventing head injuries". If that's the case, where's the huge drop overnight in head injuries in this graph, considering that helmet-wearing rates went up meteorically in the space of a year or two.

    1139_1.jpg


  • Closed Accounts Posts: 4,013 ✭✭✭kincsem


    Am I the only person to guess that reduced cycling numbers might be due to increased affluence resulting in increased car ownership?


  • Registered Users Posts: 32,379 ✭✭✭✭rubadub


    kincsem wrote: »
    Am I the only person to guess that reduced cycling numbers might be due to increased affluence resulting in increased car ownership?
    I would say so, well a part reason, I would certainly think the helmets would affect it to a much higher degree.
    pre law 1991 count 6072,
    post law 1992 count 3857, down 36%,
    post law 1993 count 3414, down 44%.
    seems a lot, I wonder what the drop was in the previous years, this would show if there was already a trend.


  • Registered Users Posts: 3,981 ✭✭✭Diarmuid


    BostonB wrote: »
    Maybe I'm reading it wrong but it looks like the trend reversed just before the compulsion.
    Not if the measured data points are indicated by the triangle. However it's hard to tell from the graph...


  • Advertisement
  • Registered Users Posts: 11,747 ✭✭✭✭tomasrojo


    Diarmuid wrote: »
    Not if the measured data points are indicated by the triangle. However it's hard to tell from the graph...
    The datapoints are indicated by the triangles. The data are from the census, which is taken every five years.

    On the other points, I don't think increasing wealth explains the trend reversal and sharp drops very well, since Australia didn't become very much more weathy in that timeframe.

    There was a change of driving age for provisional drivers in Victoria (17 to 16) and this has been adduced from time to time to explain the fall in teenage cycling participation, but:

    http://www.cyclehelmets.org/1101.html
    Even if every 16-year old cyclist had changed completely to driving accompanied by an older person, that would account for only a small part of the 43% drop in cycling by Victorian teenagers post-law. It would not account at all for the decline of up to 60% in cycling among teenagers elsewhere in Australia.


  • Registered Users Posts: 11,747 ✭✭✭✭tomasrojo


    It may have been a mistake for the original author to join the triangles with lines, as it seems to indicate continuous data. But it's not uncoventional to join isolated data points with lines.


  • Closed Accounts Posts: 5 pedal.ready


    Generally cycling was increasing in Australia prior to helmet laws. The roads were becoming safer (fatality rate per 100,000 population reduced from 21.4 in 1982 to 13.5 in 1990) and cycling was growing.

    Matched survey counts from Melbourne
    1990 pre-law - 3121 counted,

    post law 1991 - 2011 counted, -- 2011/3121 = 0.644
    extras wearing helmets 297, fewer people cycling 1110

    NSW, counts,
    1991 pre law - 6072 counted,

    post law 1992 - 3857 counted, -- 3857/6072 = 0.635
    extras wearing helmets 1019, fewer people cycling 2215

    For children surveys at school gates in NSW, 395 extras wearing helmets and 1156 fewer cycling was their outcome. For Victoria from 1990 to 1991, 30 more teenagers wearing helmets compared to 623 fewer cycling. A few web sites provide extra information. http://tiny.cc/0FdZR
    discusses the 85% claim.

    http://www.cycle-helmets.com/australian-cyclist.html
    http://www.cla.asn.au/Article/081125Bik ... Policy.pdf
    http://www.youtube.com/watch?v=YLoPA_I6SL8.
    http://www.youtube.com/watch?v=ZriJe1CO7-k
    http://www.eco-logica.co.uk/pdf/WTPP12.3.pdf
    http://www.ctcyorkshirehumber.org.uk/campaigns/velo.htm
    http://www.cycle-helmets.com
    http://www.cycle-helmets.com/canada-hel ... ssment.doc
    http://tiny.cc/0FdZR
    http://www.cyclehelmets.org

    http://www.ctc.org.uk/DesktopModules/Ar...&mid=13641

    http://www.garnautreview.org.au/CA25734E0016A131/WebObj/D0852004ResponsetoIssuePaper5-ChrisGillham/$File/D08 52004 Response to Issue Paper 5 - Chris Gillham.pdf


  • Closed Accounts Posts: 18,056 ✭✭✭✭BostonB


    tomasrojo wrote: »
    I see what you mean, but judging by that graph, for both cases the rates of increase were slowing (first order differential positive, second order negative: decelerating rates essentially), but they were both increasing until compulsion. They didn't even flatline at compulsion; the trend reversed. The blue line in particular is a very drastic drop....

    From my reading. The trend was there before compulsion. It also doesn't explain the a decline in Ireland without the compulsion. Could the reason it declined in Ireland not also apply in Australia.


  • Registered Users Posts: 5,618 ✭✭✭Civilian_Target


    BostonB wrote: »
    Maybe I'm reading it wrong but it looks like the trend reversed just before the compulsion. Not that I wouldn't expect complusion to have a huge effect. Most cyclist I see, cycle in ordinary clothes and on a old crock. So bascially just hop on a bike. You couldn't do that if you had to bring a helmet, or a light for that matter.

    If the helmet is permanently attached to the bike, and the same for the lights, of course you can. Not that I'd advise helmet use. While the Australian surveys show that the head injury rates barely dropped at all with a massive increase in helmet use, the Velib shows the inverse is true too. Paris saw a massive increase in people cycling without helmets with the introduction of Velib, and apparently a decline in injury rates amongst cyclists! http://bike-sharing.blogspot.com/2008/07/happy-birthday-velib.html

    To me, it seems clear that helmet use and head injury rates are not really correlated at all!


  • Advertisement
  • Closed Accounts Posts: 18,056 ✭✭✭✭BostonB


    There's safety in numbers we are told so with any decline or increase that would have the opposite effect on accident rates. Regardless of helmets.


  • Closed Accounts Posts: 5 pedal.ready


    Ireland - can we access data showing the level of cycle use for each year from say 1980 to 2009? cycle to work and all forms of cycling, what data is available? any help? similar with level of road safety in general. It appears a downward trend for cycling over many years, in contrast to Australia where they had more of a drop in cycling due to helmet laws.

    I have noticed
    "In 1986 a total of 23,635 primary level pupils cycled
    to school whereas in 2006, only 4,087 primary school
    pupils cycled to school (a decline of 83%)." from the
    http://www.transport.ie/upload/general/11387-0.pdf

    I do know that cycling to school in some parts of Australia also declined even as helmets were being promoted, I am wondering if this drop of 83% would have occurred if helmets had not been promoted. The above pdf does not seem to be particularly promoting helmets, it may be best not even to promote helmets at all. My view it is best not to promote helmets and focus on improving cycling safety in other ways.


  • Moderators, Motoring & Transport Moderators Posts: 14,073 Mod ✭✭✭✭monument


    Remember in Ireland's case, while there was no law, there was and still is a lot of official promotion of helmets.

    Most non-cyclist here seem to think cycling is dangerous -- danger always seems to be one of the reasons people say they don't cycle or ways they question cycling 'how do you manage when it's so dangerous on the roads' etc. Weather would be only brought up more on wet days.

    Promotion of unnecessary 'safety' gear for the average urban cyclist makes cycling look more dangerous than it is.


  • Registered Users Posts: 11,747 ✭✭✭✭tomasrojo


    BostonB wrote: »
    From my reading. The trend was there before compulsion. It also doesn't explain the a decline in Ireland without the compulsion. Could the reason it declined in Ireland not also apply in Australia.
    I really don't mean to sound antagonistic; I'm genuintely curious. Do you think the cycling percentages were trending downwards _before_ compulsion? That's not what the graph shows. For both red and blue datasets, the trend was upwards before compulsion, albeit the growth was moderating somewhat. After compulsion, cycling participation clearly dropped, strongly so in the blue case.

    The use of lines between the triangles and diamonds may be confusing. The vertical lines obviously mark the point at which the compulsion law was passed or enforced. The blue and red lines passing through the vertical lines are not trend lines. They're just joining the datasets before and after the law. The only datapoints are the triangles and diamonds; the datapoints before the vertical lines are higher than those after.

    As for the decline in Ireland, I don't think we ever saw a really sharp fall in cycling participation. It just eroded away over twenty or so years.


  • Closed Accounts Posts: 5 pedal.ready


    http://www.cyclehelmets.org/1194.html

    I may be able to assist you with extra information.

    I think cycling was increasing prior to helmet legislation.

    "Prior to the law, cycling was growing strongly in New South Wales, with an increase of 250 per cent during the 1980s in Sydney [3]. "

    "Cycling had been booming for some years – in Melbourne there was an increase of 47 per cent in the number of cyclists from 1986 to 1989 [26]. Population growth during the same period was 7.5 per cent."

    "Before the law, cycling was enjoying a tremendous increase in popularity in Western Australia. The number of regular cyclists in Western Australia almost doubled between 1982 and 1989 from 220,000 to 400,000 [10]."

    These general statements provide an indication of how cycling was gaining. From 1986 to 1989, a 47% increase for Melbourne, is not reflected on the red line, shows two points from 1986 to 1991. If the blue and red lines were projected to the vertical lines, prior to legislation, this could be better, showing how cycling was still growing between 1986 and 1989, and then the drop in cycling would show up as steeper lines after legislation. The points provided are census data and between 1986 and 1989 only Victoria provides a precise reference. Adult commuters in Melbourne had a wearing rate prior to legislation of 47%, so the red and blue lines are probably not reflecting overall cycling, recreational and school use or weekend use. Census data may show less of a drop than other data, all points to bear in mind.

    http://www.eco-logica.co.uk/pdf/WTPP12.3.pdf

    I think the above link provides details on weekday counts for Melbourne, 34% down by the 2nd year.


  • Registered Users Posts: 11,747 ✭✭✭✭tomasrojo


    The nearest data I could find for Ireland with a quick search was on transport.ie:
    http://www.transport.ie/uploads/documents/news/Cycling%20Facts%20%2020th%20April%202009.doc
    In 1986, 7% of all trips to work in Ireland were made by bike. By 1996 that figure had fallen to just over 4%.

    By 2006 commuter cycling had fallen to less than 2%.

    It would be interesting to know what it was in 1991.


  • Closed Accounts Posts: 18,056 ✭✭✭✭BostonB


    tomasrojo wrote: »
    I... The blue and red lines passing through the vertical lines are not trend lines. They're just joining the datasets before and after the law. The only datapoints are the triangles and diamonds; the datapoints before the vertical lines are higher than those after....


    I have no doubt that the helmet law dropped numbers dramatically. I'm just saying perhaps its also part of an overall trend unrelated to helmets. As the numbers fell in Ireland too with no helmet law. Maybe thats just coincidence?


  • Registered Users Posts: 11,747 ✭✭✭✭tomasrojo


    BostonB wrote: »
    I have no doubt that the helmet law dropped numbers dramatically. I'm just saying perhaps its also part of an overall trend unrelated to helmets. As the numbers fell in Ireland too with no helmet law. Maybe thats just coincidence?
    You raise a very good point. As you say, it's important, not to isolate numbers from their national context, and from international trends. The international trend throughout the 90s (at least in the English-speaking world) would have been for cycling participation to drop. It does surprise me that it was generally rising in Australia in the early 90s, which bucked, as far as I know, the general trend in the English-speaking world. Perhaps it was overdue a fall.

    But given the timing of the fall (the census following the mandatory helmet law) and the severity, and given that the same phenomenon was observed about two years later when New Zealand followed the same legal path, I think the case for MHLs putting people off cycling is clear enough. Clearer than the case that MHLs improve public health.


  • Closed Accounts Posts: 18,056 ✭✭✭✭BostonB


    Increasing numbers cycling seems to reduce the number of accidents more than helmet laws. Sheer weight of people has more impact. Which isn't surprising.

    Thus I think the accident stats could reflect the changes in numbers rather than the wearing of helmets.

    I'm on the fence about wearing a helmet. I'm not making a judgement call on that. Theres lots of others things that need more urgent attention than helmet laws, that won't be enforced anyway. But I don't these stats are as clear cut as they appear.


  • Registered Users Posts: 11,747 ✭✭✭✭tomasrojo


    BostonB wrote: »
    Thus I think the accident stats could reflect the changes in numbers rather than the wearing of helmets.

    That's entirely possible, a very good point. It may also be that making risk-takers wear helmets means that any protective effect of helmets is immediately negated by their propensity to take more risks when they feel better protected. Or perhaps motorists take more risks when they think that cyclists are better protected.


    I guess it could be many things. But, given the experience in the coutnries where they've been tried, it's very hard to make the case that mandatory helmet laws are worth the bother. (I realise that you are definitely not arguing that they are worth the bother.)


  • Advertisement
  • Closed Accounts Posts: 5 pedal.ready


    http://www.ctcyorkshirehumber.org.uk/campaigns/velo.htm

    Parts of this report shows higher accident rates associated with increasing helmet use, rather than changes in number of cyclists.

    Two pieces of useful research could be assessing helmet use and the rate of accident involvement and the rate of head impacting for a bare head compared to one helmeted.


  • Registered Users Posts: 1,141 ✭✭✭Doctor Bob


    tomasrojo- thanks for looking at that article on motorbike helmets. You confirmed my suspicions re the stats. Also, I had a hunch your comment (below) was the case, but not being too engineering/physics-minded I wasn't able to articulate my reservations. Cheers.
    tomasrojo wrote: »
    This bit is completey wrong. Kinetic energy increases as a square of velocity. You can't just subtract the speed for which the helmet is certified from the speed you were travelling at. Beginner's mistake. However, that does mean that the protective effect is even lower than stated in the article.


Advertisement