Advertisement
If you have a new account but are having problems posting or verifying your account, please email us on hello@boards.ie for help. Thanks :)
Hello all! Please ensure that you are posting a new thread or question in the appropriate forum. The Feedback forum is overwhelmed with questions that are having to be moved elsewhere. If you need help to verify your account contact hello@boards.ie
Hi all! We have been experiencing an issue on site where threads have been missing the latest postings. The platform host Vanilla are working on this issue. A workaround that has been used by some is to navigate back from 1 to 10+ pages to re-sync the thread and this will then show the latest posts. Thanks, Mike.
Hi there,
There is an issue with role permissions that is being worked on at the moment.
If you are having trouble with access or permissions on regional forums please post here to get access: https://www.boards.ie/discussion/2058365403/you-do-not-have-permission-for-that#latest
There is an issue with role permissions that is being worked on at the moment.
If you are having trouble with access or permissions on regional forums please post here to get access: https://www.boards.ie/discussion/2058365403/you-do-not-have-permission-for-that#latest
The sun is dead!! Mini iceage???
Comments
-
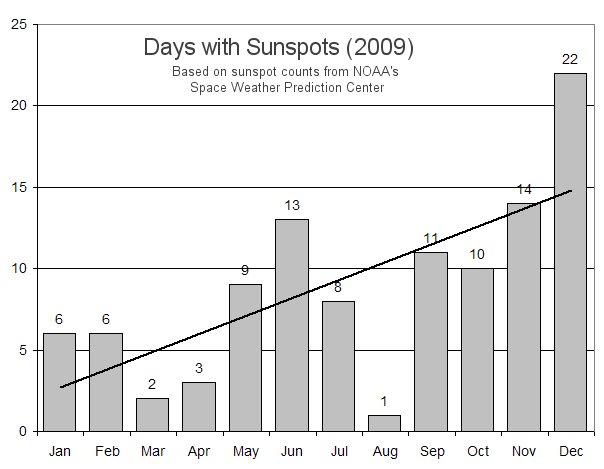
2009 is ending with a flurry of sunspots.if sunspot 1039 holds together just one more day (prediction: it will), the month of December will accumulate a total of 22 spotted days and the final tally for the year will look like above chart.
Current Stretch: 0 days
2009 total: 260 days (72%)
Since 2004: 771 days
Typical Solar Min: 485 days
Many thanks during the year for your thoughts and hopefully we shall continue to moniter our shining orb in the new year.
HAPPY NEW YEAR:)0 -
Found this,(below)maybe a bit dated as the article is May 2008,but it seems we are nowhere near a Maunder minimum which lasted a whopping 70 years!
Are we concerned? It would seem the maximum is far more likely scenario,and even then do we really know with any certainty what will happen?0 -
-
the iceman come wrote: »
Ah yea seen that one a while ago.
its from summer 2008 so by the end of that year it had broken records and this year was only 7 days off making a new one.
This is resembling a Dalton minimum now not a maunder minimum
Alot has been updated and written since that report so yes its gone way past it sell by date.0 -
I really enjoyed this thread - didn't nderstand all of it, but really enjoyed reading about it since - Thanks0
-
Advertisement
-
Happy new year guys.Its been great watching the minimum progress over the year.
To be honest Im surprised it lasted 771 days,wasnt too sure back in may.
Thanks guys for all the info and above all thankyou Red for starting this thread and your posts.
Having seen the havoc this december lets hope if we do get a mini iceage, its a really mild one.
Cheers.0 -
Looks like the mini iceage is upon us.
keep warm guys.0 -
Too early to make that call imho, we need several cold winters in a row first.0
-
Apocalypse now!0
-
Deleted User wrote: »Too early to make that call imho, we need several cold winters in a row first.
Agreed.However,weve had a few already. Winter 2008 in china ,for instance, was the coldest in 40 years,though it wasnt widely reported.0 -
Advertisement
-
Heres something interesting from spaceweather.
"ISLAND SNOW: Last week when NASA's Terra satellite orbited over Europe, it saw something very unusual. The normally temperate British Isles were completely covered by snow. From an altitude of 420 miles, Terra's MODIS (Moderate-resolution Imaging Spectroradiometer) camera snapped this picture:"0 -
Heres something interesting from spaceweather.
"ISLAND SNOW: Last week when NASA's Terra satellite orbited over Europe, it saw something very unusual. The normally temperate British Isles were completely covered by snow. From an altitude of 420 miles, Terra's MODIS (Moderate-resolution Imaging Spectroradiometer) camera snapped this picture:"
That's possibly the first time such an image has been possible, snow has always been restricted to a few regions never the whole island!
Don't know about 1963 or 1947, no satellite photos then") 0
0 -
Deleted User wrote: »That's possibly the first time such an image has been possible, snow has always been restricted to a few regions never the whole island!
Don't know about 1963 or 1947, no satellite photos then
Yeah, 1963 would have been similar,if not worse.0 -
Since there is renewed interest in whats happening with our sun i'll continue updating this thread.

As you can see there is lots going on at the moment.
She is no longer a sleeping giant.

We're gone from days in a row without sunspots to,
Days in a row with a sunspot .
27 as of 15/2/2010
And for those really interested,here a new paper from feb 4 2010.
http://arxiv.org/ftp/arxiv/papers/1002/1002.0597.pdf
Summary:It has been shown above that low altitude cloud cover closely follows cosmic ray flux; that the galactic cosmic ray flux has the periodicities of the glacial/interglacial cycles; that a decrease in galactic cosmic ray flux was coincident with Termination II [the warming that initiated the Eemian, the last interglacial] ; and that the most likely initiator for Termination II was a consequent decrease in Earth’s albedo.
The temperature of past interglacials was higher than today most likely as a consequence of a lower global albedo due to a decrease in galactic cosmic ray flux reaching the Earth’s atmosphere.
In addition, the galactic cosmic ray intensity exhibits a 100 kyr periodicity over the last 200 kyr that is in phase with the glacial terminations of this period.
Carbon dioxide appears to play a very limited role in setting interglacial temperature.
.................................................................................................................................................
Solar Cycle 24 was a late starter, about three and a half years later than the average of the strong cycles in the late 20th century and almost three year later than the weak cycles of the late 19th century. It was almost as late as Solar Cycle 5, the first half of the Dalton Minimum. The last few months have seen it ramp up relatively rapidly.
February 15, 2010
Dalton Minimum Return Gaining Attention
Now some of the overlapping solar cycles are attracting solar scientist. The AGU Fall meeting has a session entitled “Aspects and consequences of an unusually deep and long solar minimum”. Two hours of video of this session can be accessed here.
Two of the papers presented had interesting observations with implications for climate. First of all Solanki came to the conclusion that the Sun is leaving its fifty to sixty year long grand maximum of the second half of the 20th century. He had said previously that the Sun was more active in the second half of the 20th century than in the previous 8,000 years. This is his last slide:
McCracken gave a paper on The Effects of Low Solar Activity Upon the Cosmic Radiation and the Interplanetary Magnetic Field over the Past 10,000 years and the Implication for the Future.
His Concluding Slide:0 -
anything interesting happening with the sunspots in the last few weeks???0
-
This from spaceweather.
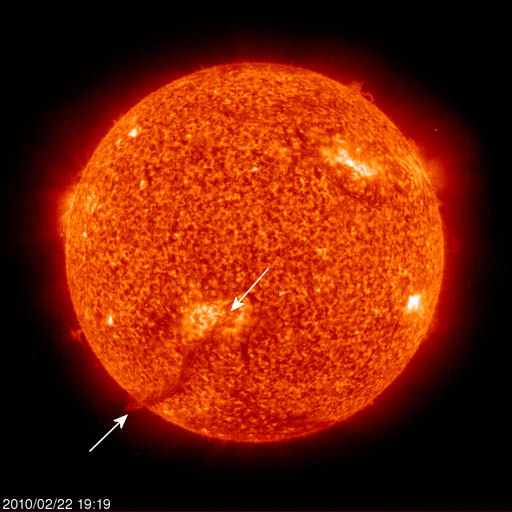
For the seventh day in a row, an enormous magnetic filament is hanging suspended above the surface of the sun's southern hemisphere.
Solar filaments are unpredictable. If this one collapses and hits the stellar surface, the impact could produce a powerful Hyder flare.
And there has only been 2 spotless days this year.0 -
so with her awake and spitting fire so to speak,
will that mean things will get warmer around the world in the next year or so.0 -
Well its much more complicated than that but i'll show some new and old info to help you draw your own conclusion.
Indirect Effects act to amplify the direct effects significantly
UV warming through ozone chemistry high up in low and mid latitudes (Shindell at NASA GISS, Labitzke). Though solar irradiance varies only 0.1% over the 11 year cycle, radiation at longer UV wavelengths are known to increase by 6 to 8 percent with still larger changes (factor of two or more) at extremely short UV and X-ray wavelengths (Baldwin and Dunkerton, JAS 2004).
Labitzke has shown statistically significant differences of temperatures in the lower stratosphere into the middle troposphere with the 11 year solar cycle (warmest at max).
The sun gave us a good example of this in 2001/02 when in September, a second solar max kicked in with high solar flux that corresponded with a large spike in ultraviolet.


The above chart shows correlation between the upper atmosphere heights (proportional directly to temperature) and solar flux/ultraviolet. In 2001/02 winter (January-February) note how the middle atmosphere matched the warming in the low and middle atmosphere in the Labitzke analysis. Below Drew Shindell, climate modeler for James Hansen showed how the low ultraviolet could have cause the cold winters of the Maunder Minimum. His model included ultraviolet and ozone.
Geomagnetic storms that warm high latitudes (Labitzke, Pyche et al). Here major flares and coronal mass ejections that produce the aurora ionize the atmosphere in the auroral ring about the magnetic pole. That heat works its way down into the middle atmosphere in 10 days to 2 weeks. You can see that warm ring in the following global map on the left two weeks after a major geomagnetic storm.
Finally an Active sun reduces low cloudiness by diffusing galactic cosmic rays - ion mediated nucleation (Svensmark).
Note the inverse relationship of cosmic rays (blue) and sunspots (orange) and how low clouds in different latitude bands increase during solar minima when cosmic rays increase and decrease during solar maxima when cosmic rays are diffused. Note below how our cosmic rays have exceeded the previous space age maximum in this super long and quiet solar minimum.
These factors work together to enhance warmth in active solar periods and diminish solar warmth in quiet periods.
Scaffetta and West (2007) using Total Solar irradiance as a proxy for the total solar effect suggested the sun may account for 69% of the changes since 1900.
Soon (2007) showed how the total solar irradiance correlated with arctic temperatures very well, far better than with carbon dioxide.
“CERN’s much-anticipated CLOUD experiment has begun, the atom lab says. Using the 50-year-old Proton Synchrotron, the experiment simulates cosmic rays passing through the earth’s atmosphere, and hopes to reveal the extent to which the constant background drizzle of charged particles plays a role in cloud formation. Earlier experiments have suggested that ionisation causes clouds to “seed” – and that ionisation is influenced by the type and quantity of cosmic rays that reach the earth.
Both the sun and the earth’s magnetic fields act as umbrellas, protecting the surface from the high energy particles, although two particles still reach the surface per second. But small changes in the cosmic ray flux produce significant changes in cloud cover. When fewer cosmic rays reach earth, the planet’s climate is warmer, when more reach earth, the climate cools.
“So marked is the response to relatively small variations in the total ionization, we suspect that a large fraction of Earth’s clouds could be controlled by ionisation,” noted Danish scientist Henrik Svesmark. Svensmark has pioneered the research using smaller experiments, but has waited over a decade to see it tested on such a scale.
Much of the recent interest comes from climate watchers. Clouds are one of the biggest factors in determining global surface temperature.
The cosmic ray effect – a factor of the background CBR [cosmic background radiation] bombardment itself, and the relative strength of the
earth and the Sun’s magnetic shields – shows a strong correlation between temperature [and] CBR and is extraordinary. Here’s the relationship over the short term – around 2,000 years.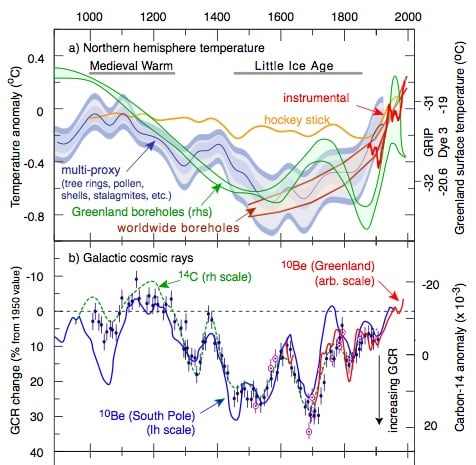
And here’s the correlation into deep time, with CO2 as a comparison.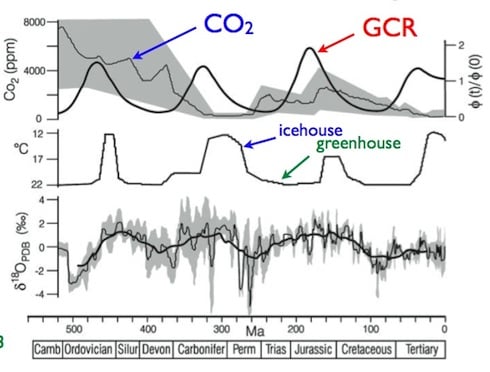
In addition, “deep freezes” in the Earth’s temperatures have coincided with short-lived but intense bursts of cosmic ray activity. Modulation is thought to reflect the Sun’s passage through spiral arms of the Milky Way, and also the Sun’s oscillation in relation to the plane of the galaxy. The Sun bobs up and down 2.7 times per orbit.”0 -
so thats the theory of the long period of global cooling more or less fúcked.!!!
thanks for all that info redsunset.0 -
thetonynator wrote: »so thats the theory of the long period of global cooling more or less fúcked.!!!
Far from it,have you actually read the thread?0 -
Advertisement
-
Join Date:Posts: 29920
Is it time to crack open the "others" skulls and feast on the goo inside?
Yes Kent, yes I think it is...
I'm staying put down here in sunny Malta... its a bit stormy but its nice and warm")
BTW, Great pictures... the rest I am completely baffled by...
DeV.0 -
-
I've often taken the simplistic view that more sunspots simply mean an increase in solar energy, having looked at some of the stuff that redsunset had posted - it appears to be more to do with the magnetic energy that sunspots disrupt that warm the earth less. No sunspots = stable megnetic fields and more cosmic rays.
In other words cosmic rays appear to increase cloud cover, reducing the direct heating effect of the sun.
Or something like that! 0 -
thetonynator wrote: »yeah but not at the same time and i get confused easily . . .
But now that the sunspots are back doesn't it mean it wont be getting cooler???
Some of this is too hard for my tiny little brain to cope with . . .:(
OK alot of the info can be a little over the head for most i guess.
It's not guaranteed that we will get somewhat cooler,its really a waiting game to see what actually happens or if anything at all.
I feel something is going on but i only hope i live long enough to see,if anything materialises.
The scientists are simply trying to get answers to why we had previous mini ice ages and warmer periods and wheather the sun does actually influence it.
And they do make alot of sense in their findings in like tree rings and icecores to basically look back in time as to what was happening in our atmosphere at x time period.
If you go back to where i've posted about the Dalton Minimum,you will see that what we are entering closely follows that same period.
See how Dalton Minimum showed very little solar max (peak sunspot numbers)and where we are today.
It might not happen and even the Dalton had sunspots but nothing like what we've experienced in recent sunspot cycles.
If this period is to stay on a Dalton Minimum course,there will have to be no mental surge in activity on the sun that drives the flux through the roof like what occured in below chart.
Now compare the flux chart today,big difference.Peak is 95 to date so keep an eye on it for spikes,if any.
The Maunder Minimum period had little or no sunspots,but we are definately not in that scenario.
Nobody knows the outcome and that is why scientists are excited to see the long term results.
Of course theres the whole cosmic ray thing too but i won't get into that now.Its written fairly well in the posts.
Loads of questions to be answered im afraid ,that will come only very slowly to the scientific community.
Plenty of skeptics too which makes it all the more fun.
I hope you understand a little better cause i could be here all night going through it all so you get a very tongue and cheek response:)0 -
o dear god my brain hurts now:eek:
thanks for the info, will have to read it a few times i think to get to understand it 100% but think i have a sort of idea0 -
Yes dolanbaker its much easier to just follow the sunspot activity aspect of this and let the rest fall into line after.0
-
Full Halo CME - In the latest Lasco images you can see a Full-Halo CME billowing away from the sun on Sunday. This appears to be a farside event and shoud not have an impact on earth. The source could be a sunspot hiding on the backside of the sun. Check out the image below.

Solar Update - Sunspot 1051 is currently the only visible sunspot on the face of the sun. Sunspot 1050 has decayed into a spotless plage.
Solar activity should remain at very low levels.
Sunspot 1051 (Sunday) 0
0 -
-
NOT sun related but found this and just sticking it in here,
 JPL research scientists concluded the quake shortened the length of an Earth day by about 1.26 microseconds (a microsecond is one millionth of a second).
The 8.8-magnitude earthquake that struck Chile on Feb. 27 was so powerful it may have tipped Earth's axis and shortened the length of a day, scientists at NASA say.
According to NASA, a complex computer model's preliminary calculation shows that Earth's days should have shortened by 1.26 microseconds (a microsecond is a one millionth of a second).
A large quake shifts enough rock to redistribute the mass of the planet, which can speed its rotation.
The change won't be noticed in day-to-day life, but is permanent.
NASA scientist Richard Gross also calculated that the quake moved Earth's figure axis (the axis about which Earth's mass is balanced) by about eight centimetres.
The figure axis is not the same as the Earth's north-south axis, of which the Earth rotates around once a day at about 1,600 kilometres per hour. The figure axis is offset from the north-south axis by about 10 metres.
Melissa Giovanni, a geology professor with the University of Calgary,has said that an earthquake generally has to be at least 8-magnitude to have any recordable impact on the Earth's axis.
"The result of this particular earthquake, because it broke some a large piece of the (Earth's) crust, its actually moved part of the mass of the Earth," she said. "An earthquake of this size, I think it broke something like 400 kilometres of crust. That amount of crust moving all at once is changing the distribution of the mass of the Earth."
She added that the Richter scale that measures earthquakes is a base-10 logarithmic scale, meaning the 8.8-magnitude earthquake in Chile was about 20 times larger than the 7.1-magnitude earthquake in Haiti in January.
Using the same model, NASA says the devastating 9.1 magnitude quake in the Indian Ocean in 2004 shortened the day by 6.8 microseconds and shifted the axis by seven centimetres.
NASA says there are two reasons the Chile quake may have affected the figure axis more than the 2004 quake.
The Chile quake was located further away from the equator, making it more effective in affecting the figure axis.
Secondly, the fault responsible for the Chile earthquake is at a steeper angle than the fault in the 2004 earthquake. This moves Earth's mass vertically more effectively, making it more effective in shifting Earth's figure axis.
Scientists compare this to a figure skater's spin. As a figure skater goes into a spin and pulls her arms in, it speeds up her rotations.
NASA notes that the Earth's day can be increased as well. Filling China's Three-Gorge reservoir, which could hold 40 cubic kilometers of water, would increase the day by 0.06 microseconds.
Gross said the numbers were preliminary and may change as more information becomes available.
At least 723 people died in the Chilean quake. More than half a million houses were damaged or destroyed.0 -
Advertisement
-
Having a rest!
(almost) spotless again..0 -
This is probably a silly question

I am just wondering do met services measure actual direct, unscreened air temperatures? The reason I ask is that would this be a way of being able to measure in some way the actual direct heat of the sun on the earth's surface. Of course, you would need to be recording such a parameter in a sunny location , but would this give an idea? 0
 -
I know that some sites record UV levels (not sure that's the same). I have seen several sites that measure solar energy as received on the earth, but these are not met services. www.spaceweather.com for example.0
-
Yes they do by using Black Bulb thermometers, but it is solar radiation you are thinking about and the data is on page 7 of the monthly bulletins.Deep Easterly wrote: »This is probably a silly question
I am just wondering do met services measure actual direct, unscreened air temperatures? The reason I ask is that would this be a way of being able to measure in some way the actual direct heat of the sun on the earth's surface. Of course, you would need to be recording such a parameter in a sunny location, but would this give an idea?0 -
A huge Prominence was observed off the northern region of the sun.This prominence was as tall as at least 10 planet earths.
A solar wind stream is buffeting Earth's magnetic field and causing geomagnetic disturbances at high latitudes. 0
0 -
Paper is longer so I have taken pieces of this and made it shorter.
Just another opinion
The Sun is Undergoing a State Change
by James A. MarusekBackground
Each morning, I turn on my computer and check to see how the sun is doing. For the past several years I was normally greeted with the message "The sun is blank - no sunspots." We are at the verge of the next sunspot cycle, Solar Cycle 24. How intense will this cycle be? Why is this question important? Because there are “Danger Signposts” ahead!
We are currently in a solar minimum leading up to Solar Cycle 24, so named because it is the 24th consecutive cycle that astronomers have observed and listed. The first cycle began in March 1755.
Figure 1. Image of Solar Cycle 23 from the Solar and Heliospheric Observatory
(SOHO) by Steele Hill (NASA GSFC)
The sun exhibits great variability in the strength of each solar cycle. Some solar cycles produce a high number of sunspots. Other solar cycles produce low numbers. When a group of cycles occur together with high number of sunspots, this is referred to as a solar “Grand Maxima”. When a group of cycles occur with minimal sunspots, this is referred to as a solar “Grand Minima”. Usoskin details the reconstruction of solar activity during the Holocene period from 10,000 B.C. to the present.1 Refer to Figure 2. The red areas on the graph denote energetic solar “Grand Maxima” states. The blue areas denote quiet solar “Grand Minima” states.
The reconstructions indicate that the overall level of solar activity since the middle of the 20th century stands amongst the highest of the past 10,000 years. This time period was a very strong “Grand Maxima”. Typically these grand maxima are short-lived lasting in the order of 50 years. The reconstruction also reveals “Grand Minima” epochs of suppressed activity, of varying durations have occurred repeatedly over that time span.
A solar Grand Minima is defined as a period when the (smoothed) sunspot number is less than 15 during at least two consecutive decades. The sun spends about 17 percent of the time in a Grand Minima state. Examples of recent extremely quiet solar “Grand Minima” are the Maunder Minimum (about 1645-1715 A.D.) and Spörer Minimum (about 1420-1570 A.D.) Figure 2. Sunspot activity throughout the Holocene. Blue and red areas denote grand
minima and maxima, respectively. The entire series is spread out over two panels for
better visibility.1
By monitoring the number of spotless days (days without sunspots) during a solar minimum, scientists can gain a sense of the intensity of the upcoming solar cycle. As of the end of December 2009, the cumulative number of spotless days in the transition into Solar Cycle 24 now stands at 771. The number of spotless days is beginning to tapper off. There were only 10 spotless days in December.
The transitions into Solar Cycles (SC16-23), referred to as recent solar cycles (years 1923 to ~2008), averaged 362 cumulative spotless days. Those minimums ranged from 227 – 568 spotless days. Since the current transition now exceeds this range, it is fairly clear that the sun is undergoing a state change.
The solar Grand Maxima state that has persisted during most of the 20th century is coming to an abrupt end. The old solar cycles (SC 10-15, years 1856 to 1923) averaged 797 spotless days, over twice that of the recent solar cycles. Those solar minimums ranged from 406 - 1028 spotless days.2 If this solar minimum ends soon, as it appears to be doing, then the upcoming solar cycle may be similar to the old solar cycles.
The sun has gone magnetically quiet as it transitions to Solar Cycle 24. The Average Magnetic Planetary Index (Ap index) is a proxy measurement for the intensity of solar magnetic activity as it alters the geomagnetic field on Earth. It is commonly referred to a measuring stick for solar magnetic activity. For 11 months, from November 2008 to September 2009, the Ap index had been hovering near rock bottom with reading of 4’s and 5’s. But in the last two months, October and November, the Ap monthly index broke through the glass floor and spawned the lowest value in the past 77 years with a reading of "3". And then in December, the AP Index even went quieter with a reading of "2". 3
Our Milky Way galaxy is awash with high-energy galactic cosmic rays (GCRs). These are charged particles (protons, ions) that originate from exploding stars (supernovas). Many of these particles are traveling near the speed of light. Because they are charged, their travel is strongly influenced by magnetic fields. Our sun produces a magnetic field that extends to the edges of our solar system. This field deflects many of the cosmic rays away from Earth.
But when the sun goes quiet (minimal sunspots), this field collapses inward allowing cosmic rays to penetrate deeper into our solar system. Currently the sun's interplanetary magnetic field has fallen to around 4 nano-Tesla (nT) from a typical value of 6 to 8 nT.
The solar wind pressure is down to a 50-year low. The heliospheric current sheet is flattening. In 2009, cosmic ray intensities have increased 19% beyond anything we've seen since satellite measurements began 50 years ago. 4
If we slip into a quiet solar "Grand Minima" state, we can expect GCR flux rates to increase 200% to 300% above current levels.
The sun has been in a “Grand Maxima” for most of the past century. This has accounted for much of the natural warming the earth has experienced.
But as evident in the high number of spotless days in this solar minimum, the sun is changing states. It might (1) level off and revert to the old solar cycles or (2) the sun might go even quieter magnetically slipping into a “Dalton Minimum” or a solar Grand Minima such as the “Maunder Minimum”. It is still a little early to predict which way it will swing.Quiet Sun Threat
There are some scientists that believe the sun, rather than leveling off into a new state in Solar Cycle 24, will continue to free fall throughout this solar cycle. Several scientists including David Hathaway (NASA)8, William Livingston & Matthew Penn (National Solar Observatory)9, Khabibullo Abdusamatov (Russian Academy of Science)10, Cornelis de Jager (The Netherlands) & S. Duhau (Argentina)11 and Theodor Landscheidt (Germany)12, have forecasted that the sun may enter a period similar to the Dalton Minimum or a more severe “Grand Minima” (such as the Maunder Minimum or Spörer Minimum), a decade from now in Solar Cycle 25.
A few scientists including David C. Archibald (Australia)13 and M. A. Clilverd (Britain)14 have warned this might even begin in Solar Cycle 24. We are at the transition into Solar Cycle 24 and this cycle has already shown itself to be unusually quiet.
The sun is a major force controlling natural climate change on Earth. Our Milky Way galaxy is awash with cosmic rays. These are high-speed charged particles (protons, ions) that originate from exploding stars. Many of these particles are moving close to the speed of light. Because they are charged, their travel is strongly influenced by magnetic fields. Our sun produces a magnetic field that extends to the edges of our solar system.
This field deflects many of the cosmic rays away from Earth. But when the sun goes quiet (minimal sunspots), this field collapses inward allowing cosmic rays to penetrate deeper into our solar system. As a result, far greater numbers collide with Earth and penetrate down into the lower atmosphere where they ionize small particles of moisture (humidity) forming them into water droplets that become clouds. Charged raindrops are ten to a hundred times more efficient in capturing aerosols than uncharged drops. Low clouds tend to be optically thick and are efficient at reflecting sunlight back into space. A large increase in Earth's cloud cover produces a global drop in temperature.
Galactic cosmic rays are a very effective amplifying mechanism for climate forcing because the energy needed to change cloudiness is small compared with the resulting changes in solar radiation received at the Earth’s surface.
Earth’s ocean cloud cover is strongly correlated with GCR flux modulated by solar cycle variations. Refer to Figure 3. Figure 3. A strong correlation between Galactic Cosmic Rays (GCRs) and Earth’s cloud cover
over the oceans. This figure shows cosmic rays fluxes from Climax (thick curve) plotted against four satellite cloud data sets. Triangles are the Nimbus-7 satellite data, squares are the ISCCP-C2 data, diamonds are the DMSP data, and crosses are the ISCCP-D2 data.15In 2006, the Danish National Space Center in Copenhagen conducted experimental studies of aerosol nucleation in air, containing trace amounts of ozone, sulfur dioxide and water vapor at concentrations representative of Earth’s atmosphere over the oceans. Their experiments confirmed the causal mechanism by which cosmic rays facilitate the production of clouds in Earth’s atmosphere.16 Specifically the experiments showed that (1) stable cloud aerosol clusters were formed in the presence of ions, (2) the nucleation rate was proportional to the ion density, (3) the characteristic time for producing stable clusters was very short (2 seconds or less).
This theory is not an abstract threat but rather a very real one grounded in historical observations. The last solar Grand Minima was the Maunder Minimum (1645-1715 AD). During the 30-year period from 1672-1699 AD, there were less than 50 sunspots detected, whereas during the past century over the same period between 40,000-50,000 sunspots normally would appear. The Maunder Minimum corresponded to the depths of the Little Ice Age. Before that was the Spörer Minimum (about 1420 to 1570 A.D.). That Grand Minima was also noted for bone-chilling cold temperatures and was referred to as a Little Ice Age.
The threat from a quiet sun is describe in the Solar Grand Minima Threat Analysis.17 Historically past solar “Grand Minima’s” produced a global drop in world temperatures. Food production declined due to shortened growing seasons, unpredictable early frost, a dramatic increase of days with overcast skies and a resulting decline in the intensity of sunlight. With diminished food production, a string of famines occurred. Added cloud cover also produced greater rainfall, massive storms and floods. For example during the Spörer Minimum, approximately 400,000 people perished in the A.D. 1570 “All Saints Day storm” in northwestern Europe.
And two catastrophic storms hit England and the Netherlands in A.D. 1421 and A.D. 1446, each storm killing 100,000. Flooding created swamplands that became mosquito breeding grounds and introduced tropical diseases such as malaria throughout Europe.18 During the Little Ice Age, glaciers expanded rapidly in Greenland, Iceland, Scandinavia and North America. This caused vast tracts of land to become uninhabitable. The Arctic ice pack expanded into the far south. Several reports describe Eskimos landing their kayaks in Scotland. Finland’s population fell by one-third, Iceland’s by a half, the Viking colonies in Greenland were abandoned altogether, as were many Inuit communities.19
This threat is not a short-term threat but extends over several decades. Of the 27 “Grand Minima’s” that have occurred over the past 12,000 years: 30% lasted less than 50 years, 52% lasted between 50 and 100 years, and 18% lasted over 100 years. Of these, the longest was Spörer Minimum, which lasted approximately 150 years.
GLOBAL WARMING SCAREIn the Man-Made Global Warming scare, it is alleged that man-made industrial emissions of carbon dioxide are increasingly trapping heat, which would otherwise escape from our atmosphere, thus causing global warming. It is further believed that this increasing carbon dioxide level will reach a tipping point where the world will heat up to the point that life will no longer be sustainable on the planet.
The consensus among scientists in support of the man-made global warming theory has been grossly exaggerated. For example, over 31,000 American scientists signed the following petition "There is no convincing scientific evidence that human release of carbon dioxide, methane, or other greenhouse gases is causing or will, in the foreseeable future, cause catastrophic heating of the Earth's atmosphere and disruption of the Earth's climate. Moreover, there is substantial scientific evidence that increases in atmospheric carbon dioxide produce many beneficial effects upon the natural plant and animal environments of the Earth."20 This number of scientists is not a trivial number.
By taking this stance many scientists place their careers in jeopardy. This is because the global warming lobby is very powerful and vindictive. The scientists that signed this petition believe in the scientific principles of openness, falsifiability, replicability and independent review. When the integrity of science is at stake, they are willing to step forward and be counted.
The primary greenhouse gas in Earth’s atmosphere is not carbon dioxide. Rather, it is water vapor. Water vapor is directly responsible for the Earth’s present climate. Carbon dioxide, methane, nitrous oxide, hydrofluorocarbons, perfluorocarbons, and sulfur hexafluoride are only minor constituents in Earth’s atmosphere and produce only very minimal effects on our climate.
Life on Earth is based on the carbon atom. Carbon dioxide is part of the fabric of life. Declaring carbon dioxide a pollutant is scientifically unsound. Without carbon dioxide; plants would quickly die. Even humans require some carbon dioxide to survive. Over the last 350 million years carbon dioxide levels have varied between 250 parts per million (ppm) and 2,500 ppm with an average level of around 1,500 ppm. This average level (1,500 ppm) happens to be an optimum level for many plants. Present atmospheric carbon dioxide level is currently on the low side at387 ppm.
Consider that individuals with respiratory problems are routinely given oxygen. Oxygen concentrators remove nitrogen from the air and provide 95 percent pure oxygen along with argon, other trace gases and over 1,500 ppm carbon dioxide. The American Industrial Hygiene Association (AIHA) reports that only when atmospheric carbon dioxide levels reach 100,000 ppm that the gas becomes immediately dangerous to human life.21
Satellites provide generally the most accurate atmospheric temperature measurements covering the entire globe. Average yearly lower Troposphere temperatures (relative to the 1979-1998 average) were as follows: 1998 (0.512°C.), 1999 (0.040°C), 2000 (0.035°C), 2001 (0.198°C), 2002 (0.311°C), 2003 (0.275°C), 2004 (0.195°C), 2005 (0.338°C), 2006 (0.260°C), 2007 (0.282°C), 2008 (0.048°C), and 2009 (0.259°C) according to the University of Alabama at Huntsville (UAH) LT5.2 satellite data.22
Comparing the peak year 1998 to the present, the lower
troposphere temperature is currently a 1/4 degree Celsius colder. This is despite the fact that over that same time period, atmospheric carbon dioxide (at Mauna Loa) has risen 20 ppm or 5% from 367 ppm to 387 ppm. The manmade global warming theory failed to predict this trend. The falling temperatures occurred at the same time as the sun produced minimal sunspots as it is transitioned into Solar Cycle 24.
There will be some that might argue that the year 1998 was a temperature anomaly. Indeed, they would be correct. But the elevated temperatures observed that year were used to drive fear into the hearts of many people that the Earth had finally reached a tipping point and this was proof-positive that man-made global warming was a hard fact instead of just a hypothesis based on untested (unvalidated) computer models.
Analysis of ice core data through glacial/interglacial transitions shows an association between carbon dioxide and temperature. But the climatic temperature always changed first and carbon dioxide levels followed. There is a measurable lag time of 400 – 1,000 years.23 Therefore; it is earth’s temperature that is driving atmospheric carbon dioxide levels rather than carbon dioxide levels driving temperature. Why is this the case? It is because the oceans stores vast quantities of carbon dioxide; far greater than our atmosphere. Carbon dioxide is soluble in water. This solubility decreases as the water temperature increases. As the world’s oceans gently warm naturally, carbon dioxide is released into Earth’s atmosphere.
The Earth’s atmosphere is fairly stable and resilient. Carbon dioxide levels during the Ordovician period (which began 490 million years ago and ended around 443 million years ago) were approximately 5,000 ppm, but these high-levels of carbon dioxide did not throw our world into runaway global warming.24 So if exceptionally high carbon dioxide levels did not cause run-away global warming in the past, why would we expect that to be the case in the future (especially at the minimal levels of 387 ppm)?Closing Comments
Will the sun’s magnetism continue to free fall during Solar Cycle 24 or will it level off into a steady state similar to the old solar cycles? Will the next decade produce massive solar storms or will we see the start of a Dalton type minimum or even enter a more severe solar Grand Minima producing another Little Ice Age? As a scientist I can say that I do not have all the answers. The road ahead is bricked in uncertainty. But what is certain is the sun is undergoing a state change.0 -
Advertisement
-
very interesting article.0
-
http://news.bbc.co.uk/2/hi/science/nature/8615789.stmLow solar activity link to cold UK winters
By Mark Kinver
Science and environment reporter, BBC News
A period of low solar activity could lead to more cold winters in the UK
The UK's big freeze explained
The UK and continental Europe could be gripped by more frequent cold winters in the future as a result of low solar activity, say researchers.
Looks like the solar minimum affects weather theory has gone mainstream!0 -
Just noticed the links are not working so go to the SDO site
http://svs.gsfc.nasa.gov/Gallery/SDOFirstLight.html
First Light for the Solar Dynamics Observatory
April 21, 2010: Warning, the images you are about to see could take your breath away.
At a press conference in Washington DC, researchers unveiled "First Light" images from NASA's Solar Dynamics Observatory, a space telescope designed to study the sun.
"SDO is working beautifully," reports project scientist Dean Pesnell of the Goddard Space Flight Center. "This is even better than we could have dreamed."
Launched on February 11th from Cape Canaveral, the observatory has spent the past two months moving into a geosynchronous orbit and activating its instruments. As soon as SDO's telescope doors opened, the spacecraft began beaming back scenes so beautiful and puzzlingly complex that even seasoned observers were stunned.
For instance, here is one of the first things SDO saw:
An erupting prominence observed by SDO on March 30, 2010. The 29 MB movie takes a while to download, but it is worth the wait.
Credit: SDO/AIA
"We've seen solar prominences before—but never quite like this," says Alan Title of Lockheed Martin, principal investigator of the Atmospheric Imaging Assembly (AIA), the observatory's main telescope array. "Some of my colleagues say they've learned new things about prominences just by watching this one movie."
SDO is the first mission of NASA's Living with a Star (LWS) program. The goal of LWS is to understand the sun as a magnetic variable star and to measure its impact on life and society on Earth. Program scientist Lika Guhathakurta of NASA headquarters envisions big things for the new observatory:
"SDO is our 'Hubble for the sun'," she says. "It promises to transform solar physics in the same way the Hubble Space Telescope has transformed astronomy and cosmology."
"No solar telescope has ever come close to the combined spatial, temporal and spectral resolution of SDO," adds Title. "This is possible because of the combination of 4096 x 4096-pixel CCDs with huge dynamic range and a geosynchronous orbit which allows SDO to observe the sun and communicate with the ground around the clock."
A full-disk multiwavelength extreme ultraviolet image of the sun taken by SDO on March 30, 2010. False colors trace different gas temperatures. Reds are relatively cool (~60,000 K); blues and greens are hotter (> 1,000,000 K). URL="http://www.boards.ie/media/medialibrary/2010/04/21/fulldiskmulticolor.jpg"][COLOR=#0066cc]full-resolution image[/COLOR][/URL
Credit: SDO/AIA
One of the most amazing things about the observatory is its "big picture" view. SDO is able to monitor not just one small patch of sun, but rather the whole thing--full disk, atmosphere, surface, and even interior. "We're going to make connections that were impossible in the past," says Title.
As an example he offers the events of April 8th:
With SDO looking on, decaying sunspot 1060 unleashed a minor "B3-class" solar flare. A shock wave issued from the blast site and raced across the surface of the sun (movie). SDO images clearly show magnetic loops and other structures rocking back and forth when the wave passes over them. Eventually, the wave disappeared over the sun's horizon--but the show wasn't over. Four hours after the initial blast, and some 200,000 km away, a massive prominence erupted (image).
Coincidence? Not according to Title.
"As the wave swept across the surface of the sun, it de-stabilized magnetic fields it encountered en route. I believe the magnetic underpinnings of the prominence were upset by the wave, and this led to the eruption."
A seemingly insignificant B-flare triggered a massive prominence eruption halfway across the sun. This is the sort of unexpected connection that, when fully understood, could lead to big advances in space weather forecasting.
On April 8th this active region unleashed a B3-class solar flare. Click to view an 8 MB movie of the flare and the subsequent shock wave that went rippling through the sun's atmosphere.
Credit: SDO/AIA
So far, SDO's prettiest pictures have come from the bank of telescopes called AIA. Other instruments on the spacecraft are working just as well—and they promise similarly exciting results.
"The Helioseismic Magnetic Imager (HMI) is performing splendidly," reports HMI principal investigator Phil Scherrer of Stanford University. "We're getting very high-quality, high signal-to-noise data."
HMI is designed to look inside the sun using a technique called helioseismology. Just as geologists use seismic waves to map the interior of our planet, solar physicists can use acoustic waves to map the interior of our star. On the sun, acoustic waves are generated by the sun's own internal motions. HMI detects the waves pulling the sun's surface back and forth, revealing indirectly what lies within.
"We're processing the data now," says Scherrer, "and soon we expect to have some nice maps of the sun's interior."
In addition to mapping the solar interior, the Helioseismic Magnetic Imager can also map magnetic fields on the sun's surface. This bipolar sunspot was observed by HMI on March 29th. White and black trace opposite magnetic polarities. The sunspot's main core (white) is about the size of Earth. URL="http://www.boards.ie/media/medialibrary/2010/04/21/hmi_magnetogram.mp4"][COLOR=#0066cc]2 MB movie[/COLOR][/URL
Credit: SDO/HMI
The Extreme UV Variability Experiment (EVE) is online, too, "and we're getting great data as well," says principal investigator Tom Woods of the University of Colorado, Boulder.
EVE monitors the sun where it is most variable—in the extreme UV part of the electromagnetic spectrum. At these wavelengths, the brightness of the sun can rise and fall a hundredfold in the blink of an eye, heating and "puffing up" Earth's upper atmosphere, and dragging down satellites. EVE measures these changes with unprecedented time and spectral resolution.
"EVE has already detected a number of very interesting solar flares," says Woods. "We're excited; the flares evolved in a way we didn't expect. This is something we wouldn't have seen without the capabilities of EVE." He plans to offer more details at a later date when the EVE team has had time to fully analyze the data.
Mission scientists stress that all of this is preliminary. The observatory is still being commissioned, and a good deal of testing and calibration remains to be done before regular, daily images become available in mid-May. Even more effort must be put in before hard science appears in refereed journals.
"First Light is just a first look," says Pesnell. "The best is yet to come."
A complete gallery of SDO's First Light images and data may be found at http://svs.gsfc.nasa.gov/Gallery/ SDOFirstLight.html.
An erupting prominence observed by SDO on March 30, 2010. False colors trace different plasma temperatures. Red is relatively cool (60,000 K); green and yellow are hotter (1,400,000 - 2,200,000 K). URL="http://www.boards.ie/media/medialibrary/2010/04/21/aia_cme_closeup_20100330-H1800_304-171.mp4"][COLOR=#0066cc]15 MB movie[/COLOR][/URL
SDO/AIA
And just to note the sun has been in bed for the last 9 days.very quiet again.0 -
http://www.spaceweather.comQUIET SUN: Just when you thought solar minimum was over... The sun has been blank for nine consecutive days, the longest stretch of spotlessness since 2009. Solar activity is very low and no sunspots are in the offing.
Are we on track for a Dalton minimum? Top graph: The figure shows sunspot record in blue and a polynomial fit in black. These cycles are said to be responsible for the little ice age periods seen in the last millennium. The latest little ice age on Earth occurred during the solar Dalton Minimum, which lasted from about 1790 to 1830.
Bottom graph: Solar cycles #1, 2, 3 and 4 are compared with solar cycles #20, 21, 22, and 23 (we are currently in solar cycle #24). The two sequences are separated by about 210 years. The figure suggests a repeating pattern. There is an increase during cycles #1, 2, and 3 followed by a decrease in cycle #4 that repeats for the cycles #20, 21, 22, and 23, which lasted about 13 years. If the bi-secular (occurring twice in a century) solar cycle repeats, a new solar minimum lasting a few decades should be expected. This new low solar activity cycle may induce a further cooling of the climate during the first half of the 21st century, according to Scafetta.0 -
Quiet sun puts Europe on ice
14 april 2010
BRACE yourself for more winters like the last one, northern Europe. Freezing conditions could become more likely: winter temperatures may even plummet to depths last seen at the end of the 17th century, a time known as the Little Ice Age. That's the message from a new study that identifies a compelling link between solar activity and winter temperatures in northern Europe.
The research finds that low solar activity promotes the formation of giant kinks in the jet stream. These kinks can block warm westerly winds from reaching Europe, while allowing in winds from Arctic Siberia. When this happens in winter, northern Europe freezes, even though other, comparable regions of the globe may be experiencing unusually mild conditions.
Northern Europe freezes, even though comparable regions experience unusually mild conditions
Mike Lockwood at the University of Reading in the UK began his investigation because these past two relatively cold British winters coincided with a lapse in the sun's activity more profound than anything seen for a century. For most of 2008-9, sunspots virtually disappeared from the sun's surface and the buffeting of Earth by the solar magnetic field dropped to record lows since measurements began, about 150 years ago.
Lockwood and his colleagues took average winter temperatures from the Central England Temperature dataset, which extends back to 1659, and compared it with records of highs and lows in solar activity. They found that during years of low solar activity, winters in the UK were far more likely to be colder than average. "There is less than a 1 per cent probability that the result was obtained by chance," says Lockwood, in a paper to appear in Environmental Research Letters (DOI: 10.1088/1748-9326/5/2/024001).
Judith Lean, a solar-terrestrial physicist at the US Naval Research Laboratory in Washington DC, says the analysis is statistically robust, and reckons it forms a piece in the larger puzzle of how solar activity influences weather. Often cited by climate-change sceptics as a cause of global warming the effects of solar cycles have largely evaded the grasp of climate modellers. Lockwood found that when he removed 20th-century warming due to industrial emissions from his models, the statistical link between solar lows and extreme winters was stronger, suggesting the phenomenon is unrelated to global warming. But the sun undeniably has a big influence on weather systems: it is, after all, the energy source that powers them.
"All the little pieces are adding up into something much bigger," says Lean. "People are beginning to realise that European weather is particularly susceptible to solar activity." A study she published in 2008 found that warmer-than-average temperatures were more likely in northern Europe when solar activity is high (Geophysical Research Letters, DOI: 10.1029/2008GL034864).
Lean says research like hers and Lockwood's is helping to overcome a long-standing reticence among climate scientists to tackle the influence of solar cycles on the climate and weather. A big clue to the nature of this influence may lie in work published in 2008 by David Barriopedro at the University of Lisbon, Portugal, and colleagues. They investigated so-called "blocking events" in the mid-latitude jet stream during the winters of 1955-99.
The jet stream brings winds from the west, over the Atlantic, and into northern Europe. Blocking occurs when the meanders in the jet stream become so large that they double back on themselves, halting the prevailing westerly winds and allowing cold north-easterlies to take control (see diagram). Barriopedro found that when solar activity is low, the blocking events move eastwards across the Atlantic towards Europe, effectively opening an atmospheric corridor to the frigid Siberian Arctic.
But how can solar variability influence the jet stream?
One finger of suspicion is pointing at the stratosphere, the layer of the atmosphere that lies 20 to 50 kilometres above our heads. There, patterns of winds and temperature are known to be influenced by solar activity, says Lockwood. This is because peaks in ultraviolet radiation emitted by the sun boost ozone formation in the stratosphere, which in turn absorbs more ultraviolet and heats up. The heating is greatest in the region of the stratosphere nearest to the sun and so a temperature gradient appears across the stratosphere and winds are born.
How this affects the weather below is still debated. Very little is known about the physics that governs the stratosphere, but one pattern that is emerging is that stratospheric "weather" is linked to the troposphere below it - where our everyday weather and currents like the jet stream reside. Edwin Gerber of New York University studies these interactions. He and colleagues showed in 2009 that upward movements of air in the troposphere can change the patterns of stratospheric winds. These changes, in turn, can be reflected back down to the troposphere and influence weather at the surface of the Earth (Geophysical Research Letters, DOI: 10.1029/2009GL040913).
"Changes in the stratospheric winds influence the path of winter storms across Europe," Gerber says.
If researchers can prove that the sun can similarly induce changes in the troposphere via the stratosphere, which Gerber thinks they will, this could solve one of the biggest puzzles of the Little Ice Age - namely, that it appeared to have been a peculiarly European phenomenon, with other parts of the globe largely spared. The effects of the sun on the stratosphere are not global, says Lockwood. "They change the way the atmospheric energy is distributed around the world rather than change the total amount of energy being put into it."
Future studies may show that the effects of changes in solar activity can be felt further afield, but for now it seems that Europe is particularly susceptible because it happens to sit under the northern jet stream at a longitude where its meanders can grow into kinks.
Although sunspot activity is gradually returning, astronomers are not expecting it to reach its previously high levels. northern Europe can look forward to some more harsh winters. It may be time to buy some decent gloves.0 -
Advertisement
-
Future low solar activity periods may cause extremely cold winters in North America, Europe and Russia
by Jarl R. Ahlbeck Jarl R. Ahlbeck, D.Sc. (Chem. Eng.), Docent (env. tech.) Abo Akademi University, Finland
17.03.2010
http://strat-www.met.fu-berlin.de/labitzke/moreqbo/MZ-Labitzke-et-al-2006.pdf
http://www.esrl.noaa.gov/psd/data/climateindices/
Summary.
The observed winter temperatures for Turku, Finland (and also generally for North America, Europe and Russia) for the past 60 winters have been strongly dependent on the Arctic Oscillation index (AO). When the Arctic Oscillation index is in "positive phase", high atmospheric pressure persists south of the North Pole, and lower pressures on the North Pole.
In the positive phase, very cold winter air does not extend as far south into the middle of North America as it would during the negative phase. The AO positive phase is often called the "Warm" phase in North America.
In this report I analyzed the statistical relation between the Quasi-Biennial Oscillation index (QBO is a measure of the direction and strength of the stratospheric wind in the Tropics), the solar activity, and the Arctic Oscillation index and obtained a statistically significant regression equation.
According to this equation, during negative (easterly) values of the QBO, low solar activity causes a negative Arctic Oscillation index and cold winters in North America, Europe and Russia, but during positive (westerly) values of the QBO the relation reverses.
However, the influence of the combination of an easterly value of the QBO and low solar activity on the AO is stronger and this combination is much more probable than the opposite.
Therefore, prolonged low solar activity periods in the future may cause the domination of a strongly negative AO and extremely cold winters in North America, Europe and Russia.
Arctic oscillation index and Turku winter temperature.
Turku is located in the SW corner of Finland where the Arctic Oscillation Index for December-February almost completely controls the winter temperature for these months. See Figures 1 and 2. Figure 1. Turku Winter temperature December-February 1951-2010 and corresponding Arctic Oscillation index, data from NOAA (2010).
 Figure 2. Same as Figure 1., but the Arctic Oscillation index is by means of regression analysis converted to the same scale as the Turku winter temperature.
In January and February 1989 the Arctic Oscillation index jumped up to a very high level causing a warm winter. The index stayed at a higher level, but collapsed back to a record low level in December 2009 - February 2010. This kind of behavior of a time series is very typical for 1-lag and 2-lag random walk mechanisms.
The data for the Arctic Oscillation index (AO) December-February 1951-2010 (NOAA 2010) are presented in Appendix 1., and the probability density diagram in Figure 3. Figure 3. Probability density diagram for the Arctic Oscillation index for December-February 1951-2010.
The Arctic Oscillation index for the winter months 1951-2010 follows a Gaussian distribution with an arithmetic mean value of -0.375.
The random walk behavior of the Arctic Oscillation index points towards a mechanism whereby the index consists of white noise that is driven by two or more harmonic oscillations. Most probable candidates for these oscillations are the Quasi-Biennial Oscillation with a period length of about 28 months, and the solar activity cycle with a period length of about 138 months.
A clear influence of the solar activity and the Quasi-Biennial Oscillation index on the Arctic Oscillation index has been discovered by Labitzke and will here be verified by means of statistical methods.
Quasi-Biennial Oscillation index.
The Quasi-Biennial Oscillation index is a measure of the strength and direction of tropical stratospheric wind. A negative value corresponds to easterly wind, and a positive value to westerly wind. The data for the Quasi-Biennial oscillation index (QBO) December-February 1951-2010 (NOAA 2010) are presented in Appendix 1. and the probability density diagram in Figure 4. Figure 4. Probability density diagram for the Quasi-Biennial Oscillation index for December-February 1951-2010.
For the winter months 1951-2010 the distribution is almost rectangular with an arithmetic mean value of -2.9. Thus, negative or easterly values of the QBOhave been predominant during the winter months.
The solar activity.
Labitzke (2005) used the 10.7 cm solar flux as a measure of solar activity. As the correlation coefficient between this measure and the sunspot number is 0.98, we may as well use the sunspot number directly.
The data for sunspot number (SUN) December-February 1951-2010 (NOAA 2010) is presented in Appendix 1. and the probability density diagram in Figure 5.
Figure 5. Probability density diagram for the sunspot numbers for December-February 1951-2010. As the sunspot number can never be negative, a log-Gauss curve fit can describe the observations. We can see that low solar activity has been more common than high solar activity. Taken together with theQBO, the combination low QBO- low SUNhas been much more common during the winters than the combination high QBO- high SUN.
AO as a function of QBO and SUN.
By means of multiple regression analysis, the following equation was tested:
AO = b0+ b1*QBO+b2*SUN+b3*QBO*SUN+b4*QBO2+b5*SUN2 (1)
where b0- b5are regression coefficients. The result is shown in Appendix 1. b2, b4, and b5were eliminated as statistically insignificant.
The final statistically significant regression equation (p < 0.05) is:
AO = -0.2779 + 0.06096*QBO- 0.0005149*QBO*SUN (2)
Graphical presentation of the regression equation.
On order to obtain a picture of the Equation (2), AO was plotted as a function of SUN for two values of QBO in Figure 6. These values were chosen as minimum and maximum values from the rectangular probability density in Figure 4.
Figure 6. Statistically significant (p< 0.05) regression model for the Arctic Oscillation index as a function of Sunspot Number plotted for minimum (east), neutral, and maximum (west) values of the Quasi-Biennial Oscillation index.
It is very obvious that a predominantly low sunspot solar activity at negative (easterly) Quasi-Biennial oscillation index is able to decrease the Arctic Oscillation index much more than the other combinations are able to change the Arctic Oscillation index.
At high solar activity, the Arctic Oscillation index has not been very sensitive to the Quasi-Biennial oscillation.
Turku winter temperature.
The fact that the solar activity and the Quasi-Biennial Oscillation together with stochastic noise control the Arctic Oscillation means that the Turku winter temperature too is dependent on these two oscillating parameters.
Equation (2) together with the connection obtained from Figure 2. give the result shown in Figure 7. Despite considerably high variations between different winters, the combination low QBO-low SUN is more likely to correspond to colder winter temperatures in Turku than all other combinations. Figure 7. Turku winter temperature as a function of solar activity and Quasi-Biennial oscillation.
Conclusion.
Historically, low solar activity has been connected to cold winters in Europe. A definitive physical mechanism for this fact has not yet been presented. This analysis however shows that the influence of solar activity together with stratospheric mechanisms acting on the Arctic Oscillation is statistically significant. It also explains why the Arctic Oscillation seems to behave according to a random walk mechanism. If the solar activity in the future goes into a new Dalton or Maunder Minimum, the winters inNorth America, Europe and Russia may become very cold.0 -
This is translated from italian.
A different view to past minimums looking at planetary alignments at the time and compared to now,it a little difficult but you'll get the idea.
Orbital resonance: The word Ecliptic ... Super Minimum coming?
Propose again an old article that explains how Ale, probably the sun will be affected during 2010 by special favorable orbital resonances that could ferry a Maunder Minimum style or Dalton.
We addressed two arguments passed in POST pivotal to introduce this place might finally explain and to understand the exceptional situation that is taking shape on the ecliptic.
Remembering first and foremost the enormous magnetic field of two main SiperGiganti gaseous Jupiter and Saturn. I stress again that Jupiter holds the record with regard to the power of the field in the solar system, only the highly organized magnetic fields of sunspots are more powerful! Recall that the electromagnetic interaction distance between two bodies with the mgnetosfera depends on the "position vector", so it depends on the distance in the first instance, we recall that the rotation of the planets around the Sun is specific to each of them 11,859 years to Jupiter, 29,657 years to 84,323 years for Saturn and Uranus.
Another way was due to better clarify the relationship between electromagnetic fields and plasma: the plasma consists of nuclei of atoms (hydrogen and helium in the solar) literally immersed in a sea of electrons. The solar plasma is therefore sensitive to magnetic fields, sunspots are the visible proof, less dense plasma channels generated by solar magnetic fields highly organized.
To better understand = http://it.wikipedia.org/wiki/Plasma_ (physics)
So if the sunspots are generated by magnetic fields will also be sensitive to external magnetic fields applied, the electromagnetic interaction being a vector quantity strongly dependent on the position vector, affected the distance at which you are to find the interacting entities.
We come then to the theory of Prof. P. A. Seeds:
SOURCE = http://arxiv.org/abs/0903.5009
In this publication of the Cornell University Library, Section Astrophysics, the author analyzes in detail the potential of distance between the Sun and the planets that orbit the ecliptic, the work is extremely complex and detailed reading it seems better understand the theories on a statistical basis by Prof. Timo Niroma.
We shall now consider five different situations on the ecliptic for 5 different periods some of which are often mentioned in this Blog.
Minimum between Cycle 21 and Cycle 22 August 1986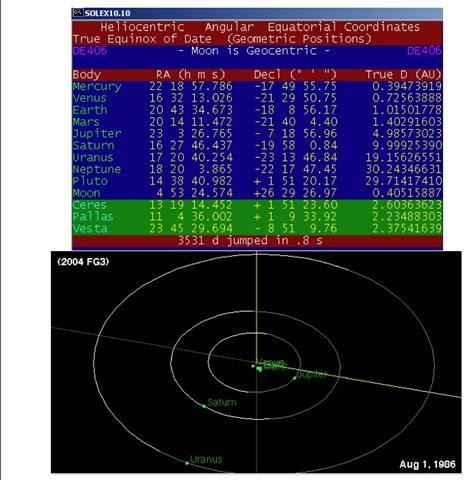
Jupiter near perihelion, with a distance of 4.9857 AU from the Sun (AU = astronomical units), Saturn at nearly 10 AU with staggered arrangement, the carrier that combines the Sun to Jupiter and Saturn carrier that combines the Sun at an angle of about 90 Degrees, the situation stands out as the three gas giants are "the same side" thinking of dividing the ecliptic into 2 parts with a perfect straight line that cuts from east to west (horizontal yellow line).
Minimum between Cycle 22 and Cycle 23 August 1996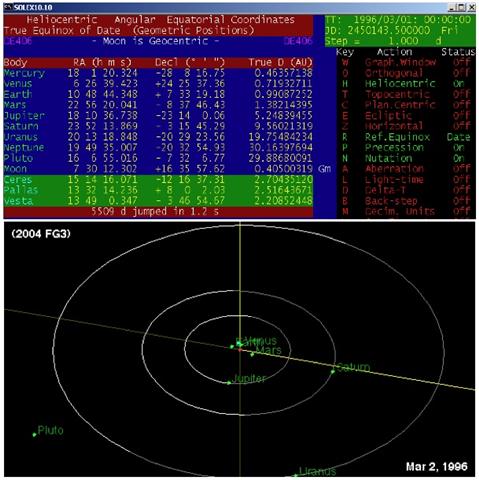
This provision Jupiter rather "outside game" with a distance of 5248 AU from the Sun, Saturn is more close than the previous situation 9:56 AU.
The angle between two vectors is always around 90 degrees and this time the three giants are almost even in the same quarter dl'eclittica.
The largest minimum of 1913
We have often used this date as a benchmark than the current minimum, emphasize that while 1913 was one year in 2008, this minimum is that 2009 is compared to this year!
The situation has some orbital substantial difference than the minimum considered before, we start from the corner formed by the vectors connecting the two main supergiants the Sun: at least 170 degrees, the alignment could therefore be much more effective with regard to the effects electromagnetic star!
Saturn on this date was in perihelion complete, with only 9.0469 AU away from the star, the situation of Jupiter but is not optimal for the distance from the Sun, with 5.18 AU is in fact an intermediate between perihelion and aphelion sitazione.
The approach to the Maunder Minimum's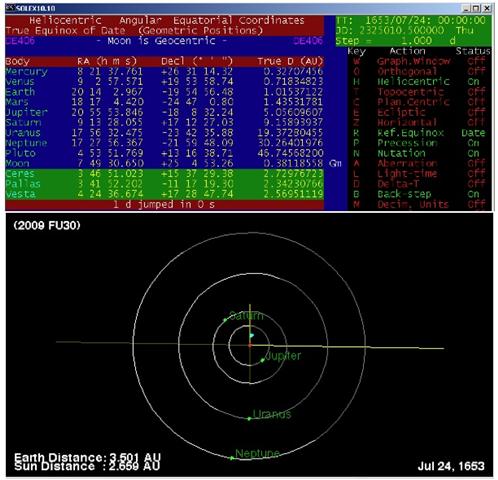
Year 1653, beginning the period known as the Maunder Minimum, you all know very well what we mean when we talk about this particular phase of Solar!
Jupiter and Saturn aligned perfectly on a hypothetical line which joins them via the Sun Uranus slightly misaligned, this configuration is completely different to that found in the periods mentioned above.
The angle formed by the carriers that ideally join the Sun-Jupiter-Saturn and Sun is almost 180 degrees, while Saturn is fairly close to perihelion, Jupiter is more distant from the point of perihelion.
The situation of 2010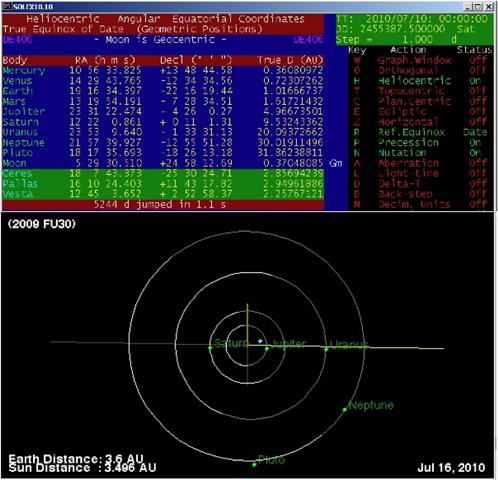
In 2010 it will achieve a very specific situation on the ecliptic, the three GigantiGassosi (Jupiter, Saturn and Uranus) will be perfectly aligned and the sun is between Jupiter and Saturn. Jupiter will be almost a perihelion distance of 4966 AU from the Sun, a little more distant Saturn with 9:53 AU.
The situation for 2010 will be very similar to that which occurred in 1653 but with two differences:
1) Jupiter is closer to the Sun compared to 1653 while Saturn farther
2) Uranus in 1653 was "off-axis will now perfectly aligned with the other two giants.
We can not say with absolute certainty that this situation will lead to a new superminimum , as I said some time on the blog "will be history that will assess the current minimum.
What we can say is that most forecasting models of solar activity based on the last three cycles with a deterministic approach, certainly never in their input data a situation like the current planetary alignment!
We follow closely the evolution of solar activity in 2010.0 -
would it not be better to link to hte articles and give a brief summary rather than copy pasting everything0
-
Have to say I have been enjoying the amount of info posted in one place.0
-
billy the squid wrote: »would it not be better to link to hte articles and give a brief summary rather than copy pasting everything
Yeah i was going to do that from the start but sometimes it doesn't suit,that last one was in italian and some might not have the translator on their PC op system,plus i feel the info could be lost over time because some sites pack up and alot of the relevant info is buried amongst other stuff too and i do combine bits from different sites in the one post sometimes so its just easy for all to have a read here.
I don't see it as an issue really.0 -
Today's spotless sun.
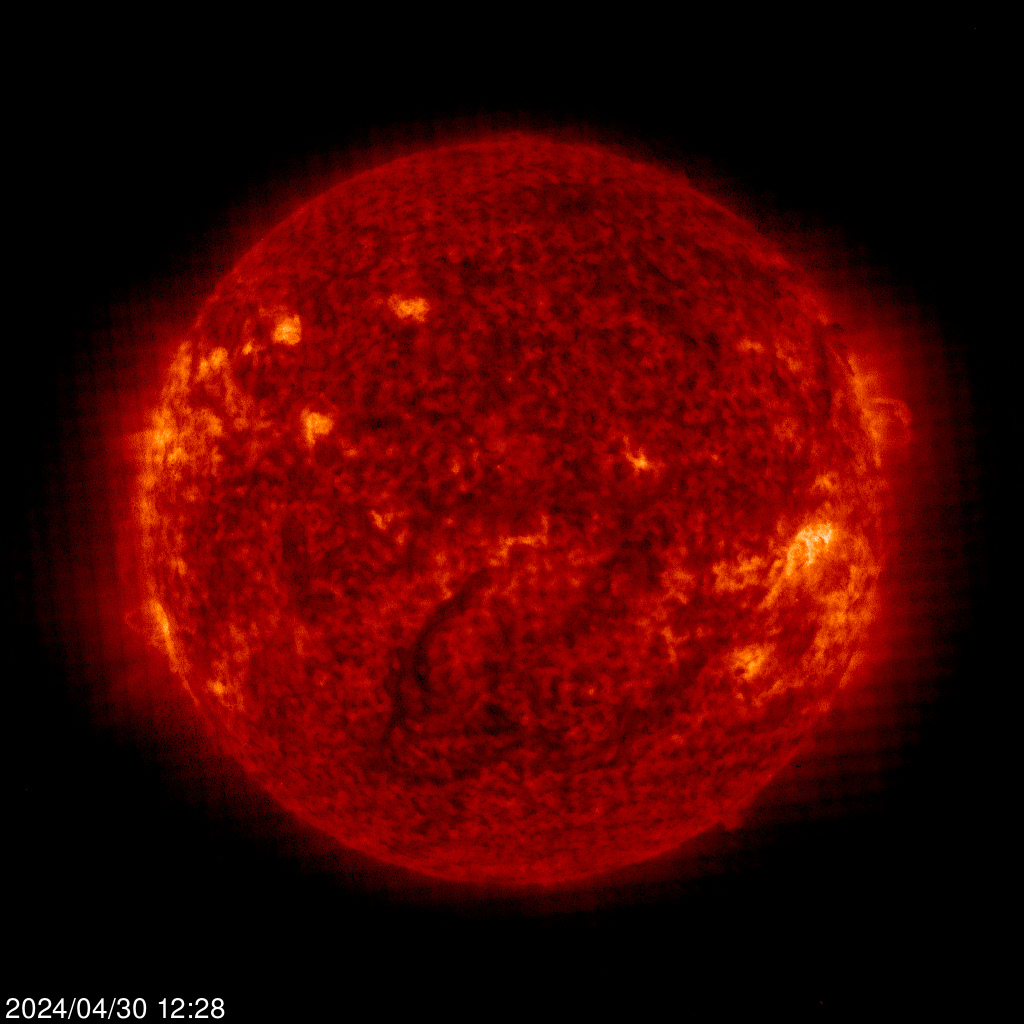 0
0 -
Has it been spotless for long this time???0
-
thetonynator wrote: »Has it been spotless for long this time???
http://spaceweather.com/[B]Sunspot number: 0 [/B] [URL="http://spaceweather.com/glossary/sunspotnumber.html"][COLOR=#810081]What is the sunspot number? [/COLOR][/URL]Updated 18 May 2010 [B]Spotless Days [/B]Current Stretch: 10 days 2010 total: 31 days (22%) 2009 total: 260 days (71%) Since 2004: 799 days Typical Solar Min: 486 days [URL="http://spaceweather.com/glossary/spotlessdays.htm?PHPSESSID=3v1ashbnvlgvbhbr2bd5qckb62"][COLOR=#0000ff]explanation[/COLOR][/URL] | [URL="http://science.nasa.gov/headlines/y2009/01apr_deepsolarminimum.htm"][COLOR=#0000ff]more info[/COLOR][/URL] Updated 18 May 2010
It would be interesting to compare with historical records to see just how quiet it really is.0 -
Typical - just as I finally get a solar filter for my telescopes, the sun goes and turn boring. Boo!0
-

Still quiet, not sure if the predicted path is following the number of sunspots recorded or the other way round.
Compared with cycle 4 & 5
http://www.solen.info/solar/cycl4.html

http://www.solen.info/solar/cycl5.html0 -
Advertisement


![[Deleted User]](/applications/dashboard/design/images/defaulticon.png)


![URL="http://www.boards.ie/media/medialibrary/2010/04/21/fulldiskmulticolor.jpg"][COLOR=#0066cc]full-resolution image[/COLOR][/URL](/?page=URL_%22http%3A%2F%2Fwww.boards.ie%2Fmedia%2Fmedialibrary%2F2010%2F04%2F21%2Ffulldiskmulticolor.jpg%22%5D%5BCOLOR_0066cc%5Dfull_resolution_image%5B%2FCOLOR%5D%5B%2FURL)
Advertisement