There is an issue with role permissions that is being worked on at the moment.
If you are having trouble with access or permissions on regional forums please post here to get access: https://www.boards.ie/discussion/2058365403/you-do-not-have-permission-for-that#latest
The sun is dead!! Mini iceage???
Comments
-
A must see lecture for all those interested on what i've been posting about sunspots and cosmic ray connection, especially in part 2 but watch it all.
http://www.youtube.com/watch?v=m4SN1-vwBVs part 1
http://www.youtube.com/watch?v=lIkQL6K8uY4&NR=1 part 2
http://www.youtube.com/watch?v=M3MIRroP5cA part 30 -
Hello redsunset.
Although I'm inclined to agree with you, I think I prefare if you were wrong. I was looking forward to a bit of global warming.
Those videos are interesting, havent seen them before.
But even Al gore's look convincing at first, so is there a way of clarifying the credibility of the speaker? ie. do you know of other links to the research?0 -
Timothy Patterson is professor and director of the Ottawa-Carleton Geoscience Centre, Department of Earth Sciences, Carleton University
Appearing before the Commons Committee on Environment and Sustainable Development , Carleton University paleoclimatologist Professor Tim Patterson testified, "There is no meaningful correlation between CO2 levels and Earth's temperature over this [geologic] time frame. In fact, when CO2 levels were over ten times higher than they are now, about 450 million years ago, the planet was in the depths of the absolute coldest period in the last half billion years." Patterson asked the committee, "On the basis of this evidence, how could anyone still believe that the recent relatively small increase in CO2 levels would be the major cause of the past century's modest warming?"
Patterson concluded his testimony by explaining what his research and "hundreds of other studies" reveal: on all time scales, there is very good correlation between Earth's temperature and natural celestial phenomena such changes in the brightness of the Sun.
Dr. Boris Winterhalter, former marine researcher at the Geological Survey of Finland and professor in marine geology, University of Helsinki, takes apart Gore's dramatic display of Antarctic glaciers collapsing into the sea. "The breaking glacier wall is a normally occurring phenomenon which is due to the normal advance of a glacier," says Winterhalter. "In Antarctica the temperature is low enough to prohibit melting of the ice front, so if the ice is grounded, it has to break off in beautiful ice cascades. If the water is deep enough icebergs will form."
Dr. Wibjorn Karlen, emeritus professor, Dept. of Physical Geography and Quaternary Geology, Stockholm University, Sweden, admits, "Some small areas in the Antarctic Peninsula have broken up recently, just like it has done back in time. The temperature in this part of Antarctica has increased recently, probably because of a small change in the position of the low pressure systems."
But Karlen clarifies that the 'mass balance' of Antarctica is positive - more snow is accumulating than melting off. As a result, Ball explains, there is an increase in the 'calving' of icebergs as the ice dome of Antarctica is growing and flowing to the oceans. When Greenland and Antarctica are assessed together, "their mass balance is considered to possibly increase the sea level by 0.03 mm/year - not much of an effect," Karl»n concludes.
The Antarctica has survived warm and cold events over millions of years. A meltdown is simply not a realistic scenario in the foreseeable future.
Gore tells us in the film, "Starting in 1970, there was a precipitous drop-off in the amount and extent and thickness of the Arctic ice cap." This is misleading, according to Ball: "The survey that Gore cites was a single transect across one part of the Arctic basin in the month of October during the 1960s when we were in the middle of the cooling period. The 1990 runs were done in the warmer month of September, using a wholly different technology."
Karlen explains that a paper published in 2003 by University of Alaska professor Igor Polyakov shows that, the region of the Arctic where rising temperature is supposedly endangering polar bears showed fluctuations since 1940 but no overall temperature rise. "For several published records it is a decrease for the last 50 years," says Karl»
Dr. Dick Morgan, former advisor to the World Meteorological Organization and climatology researcher at University of Exeter, U.K. gives the details, "There has been some decrease in ice thickness in the Canadian Arctic over the past 30 years but no melt down. The Canadian Ice Service records show that from 1971-1981 there was average, to above average, ice thickness. From 1981-1982 there was a sharp decrease of 15% but there was a quick recovery to average, to slightly above average, values from 1983-1995. A sharp drop of 30% occurred again 1996-1998 and since then there has been a steady increase to reach near normal conditions since 2001."
Concerning Gore's beliefs about worldwide warming, Morgan points out that, in addition to the cooling in the NW Atlantic, massive areas of cooling are found in the North and South Pacific ocean the whole of the Amazon Valley; the north coast of South America and the Caribbean; the eastern Mediterranean, Black Sea, Caucasus and Red Sea; New Zealand and even the Ganges Valley in India. Morgan explains, "Had the IPCC used the standard parameter for climate change (the 30 year average) and used an equal area projection, instead of the Mercator (which doubled the area of warming in Alaska, Siberia and the Antarctic Ocean) warming and cooling would have been almost in balance."
Gore's point that 200 cities and towns in the American West set all time high temperature records is also misleading according to Dr. Roy Spencer, Principal Research Scientist at The University of Alabama in Huntsville. "It is not unusual for some locations, out of the thousands of cities and towns in the U.S., to set all-time records," he says. "The actual data shows that overall, recent temperatures in the U.S. were not unusual."
Carter does not pull his punches about Gore's activism, "The man is an embarrassment to US science and its many fine practitioners, a lot of whom know (but feel unable to state publicly) that his propaganda crusade is mostly based on junk science."
and here is basically that youtube lecture i posted in writing of how the sample cores can show Specifically a very strong and consistent 11-year cycle throughout the whole record in the sediments and diatom remains.
It shows one of the highest-quality climate records available anywhere today and in it we see obvious confirmation that natural climate change can be dramatic.
Climate stability has never been a feature of planet Earth. The only constant about climate is change; it changes continually and, at times, quite rapidly. Many times in the past, temperatures were far higher than today, and occasionally, temperatures were colder. As recently as 6,000 years ago, it was about 3C warmer than now. Ten thousand years ago, while the world was coming out of the thou-sand-year-long "Younger Dryas" cold episode, temperatures rose as much as 6C in a decade -- 100 times faster than the past century's 0.6C warming that has so upset environmentalists.
Climate-change research is now literally exploding with new findings. Since the 1997 Kyoto Protocol, the field has had more research than in all previous years combined and the discoveries are completely shattering the myths. For example, I and the first-class scientists I work with are consistently finding excellent correlations between the regular fluctuations in the brightness of the sun and earthly climate. This is not surprising. The sun and the stars are the ultimate source of all energy on the planet.
My interest in the current climate-change debate was triggered in 1998, when I was funded by a Natural Sciences and Engineering Research Council strategic project grant to determine if there were regular cycles in West Coast fish productivity. As a result of wide swings in the populations of anchovies, herring and other commercially important West Coast fish stock, fisheries managers were having a very difficult time establishing appropriate fishing quotas. One season there would be abundant stock and broad harvesting would be acceptable; the very next year the fisheries would collapse. No one really knew why or how to predict the future health of this crucially important resource.
Although climate was suspected to play a significant role in marine productivity, only since the beginning of the 20th century have accurate fishing and temperature records been kept in this region of the northeast Pacific. We needed indicators of fish productivity over thousands of years to see whether there were recurring cycles in populations and what phenomena may be driving the changes.
My research team began to collect and analyze core samples from the bottom of deep Western Canadian fjords. The regions in which we chose to conduct our research, Effingham Inlet on the West Coast of Vancouver Island, and in 2001, sounds in the Belize-Seymour Inlet complex on the mainland coast of British Columbia, were perfect for this sort of work. The topography of these fjords is such that they contain deep basins that are subject to little water transfer from the open ocean and so water near the bottom is relatively stagnant and very low in oxygen content. As a consequence, the floors of these basins are mostly lifeless and sediment layers build up year after year, undisturbed over millennia.
Using various coring technologies, we have been able to collect more than 5,000 years' worth of mud in these basins, with the oldest layers coming from a depth of about 11 metres below the fjord floor. Clearly visible in our mud cores are annual changes that record the different seasons: corresponding to the cool, rainy winter seasons, we see dark layers composed mostly of dirt washed into the fjord from the land; in the warm summer months we see abundant fossilized fish scales and diatoms (the most common form of phytoplankton, or single-celled ocean plants) that have fallen to the fjord floor from nutrient-rich surface waters. In years when warm summers dominated climate in the region, we clearly see far thicker layers of diatoms and fish scales than we do in cooler years. Ours is one of the highest-quality climate records available anywhere today and in it we see obvious confirmation that natural climate change can be dramatic. For example, in the middle of a 62-year slice of the record at about 4,400 years ago, there was a shift in climate in only a couple of seasons from warm, dry and sunny conditions to one that was mostly cold and rainy for several decades.
Using computers to conduct what is referred to as a "time series analysis" on the colouration and thickness of the annual layers, we have discovered repeated cycles in marine productivity in this, a region larger than Europe. Specifically, we find a very strong and consistent 11-year cycle throughout the whole record in the sediments and diatom remains. This correlates closely to the well-known 11-year "Schwabe" sunspot cycle, during which the output of the sun varies by about 0.1%. Sunspots, violent storms on the surface of the sun, have the effect of increasing solar output, so, by counting the spots visible on the surface of our star, we have an indirect measure of its varying brightness. Such records have been kept for many centuries and match very well with the changes in marine productivity we are observing.
In the sediment, diatom and fish-scale records, we also see longer period cycles, all correlating closely with other well-known regular solar variations. In particular, we see marine productivity cycles that match well with the sun's 75-90-year "Gleissberg Cycle," the 200-500-year "Suess Cycle" and the 1,100-1,500-year "Bond Cycle." The strength of these cycles is seen to vary over time, fading in and out over the millennia. The variation in the sun's brightness over these longer cycles may be many times greater in magnitude than that measured over the short Schwabe cycle and so are seen to impact marine productivity even more significantly.
Our finding of a direct correlation between variations in the brightness of the sun and earthly climate indicators (called "proxies") is not unique. Hundreds of other studies, using proxies from tree rings in Russia's Kola Peninsula to water levels of the Nile, show exactly the same thing: The sun appears to drive climate change.
However, there was a problem. Despite this clear and repeated correlation, the measured variations in incoming solar energy were, on their own, not sufficient to cause the climate changes we have observed in our proxies. In addition, even though the sun is brighter now than at any time in the past 8,000 years, the increase in direct solar input is not calculated to be sufficient to cause the past century's modest warming on its own. There had to be an amplifier of some sort for the sun to be a primary driver of climate change.
Indeed, that is precisely what has been discovered. In a series of groundbreaking scientific papers starting in 2002, Veizer, Shaviv, Carslaw, and most recently Svensmark et al., have collectively demonstrated that as the output of the sun varies, and with it, our star's protective solar wind, varying amounts of galactic cosmic rays from deep space are able to enter our solar system and penetrate the Earth's atmosphere. These cosmic rays enhance cloud formation which, overall, has a cooling effect on the planet. When the sun's energy output is greater, not only does the Earth warm slightly due to direct solar heating, but the stronger solar wind generated during these "high sun" periods blocks many of the cosmic rays from entering our atmosphere. Cloud cover decreases and the Earth warms still more.
The opposite occurs when the sun is less bright. More cosmic rays are able to get through to Earth's atmosphere, more clouds form, and the planet cools more than would otherwise be the case due to direct solar effects alone. This is precisely what happened from the middle of the 17th century into the early 18th century, when the solar energy input to our atmosphere, as indicated by the number of sunspots, was at a minimum and the planet was stuck in the Little Ice Age. These new findings suggest that changes in the output of the sun caused the most recent climate change. By comparison, CO2 variations show little correlation with our planet's climate on long, medium and even short time scales.
In some fields the science is indeed "settled." For example, plate tectonics, once highly controversial, is now so well-established that we rarely see papers on the subject at all. But the science of global climate change is still in its infancy, with many thousands of papers published every year. In a 2003 poll conducted by German environmental researchers Dennis Bray and Hans von Storch, two-thirds of more than 530 climate scientists from 27 countries surveyed did not believe that "the current state of scientific knowledge is developed well enough to allow for a reasonable assessment of the effects of greenhouse gases." About half of those polled stated that the science of climate change was not sufficiently settled to pass the issue over to policymakers at all.
Solar scientists predict that, by 2020, the sun will be starting into its weakest Schwabe solar cycle of the past two centuries, likely leading to unusually cool conditions on Earth. Beginning to plan for adaptation to such a cool period, one which may continue well beyond one 11-year cycle, as did the Little Ice Age, should be a priority for governments. It is global cooling, not warming, that is the major climate threat to the world.
Finally this thread is a, make your own mind up to what is actually going on.
in my opinion there's alot of scaremongering going on as i said in a previous post ONLY TIME WILL TELL.;)0 -
Last winter was very snowy for north America, But already the US is well ahead of 2008 in snow cover.
http://wattsupwiththat.com/2009/10/14/early-start-to-winter-20-of-usa-is-covered-in-snow-already/#more-116660 -
Where's the option "It's too much man, let it all hang out" in this survey!?
And I notice the self-centred anthropocentric word 'our' in the posed question. Oh dear, us and our damn conciousness. Listen, every other species will either adapt and survive or will be reduced in population towards extinction, such is Darwin's world. So the question is what impact will solar minima have on Homo sapiens, because the planet will do what a planet does regardless of our temporary infection.🌦️ 6.7kwp, 45°, SSW, mid-Galway 🌦️
"Since I no longer expect anything from mankind except madness, meanness, and mendacity; egotism, cowardice, and self-delusion, I have stopped being a misanthrope." Irving Layton
0 -
Ok, so we've had 3 crap summers in a row, where the jet stream was very reluctant to move north and we're in the middle of the deepest solar minimum in 100 years. So what were the summers like (in this part of the world) around 1911? Anyone know where to find out? And if solar cycle 24 continues to ramp up slowly, what's the prospects for next years summer?0
-
Long, hot summer: The Great British heatwave of 1911
On 17 July, 1911, most of the country was perspiring in 80F (27C) temperatures. It became too hot to work after midday, so the managers of the cotton mills and stone quarries in Clitheroe, Lancashire, decided to shut down in the middle of the afternoon. To compensate for lost hours, the quarrymen's day would now begin at first light, 4.30am.
The managers were delighted that the Daylight Savings Bill had not yet been made law, so they were able to take advantage of the early dawn.
The Times began to run a regular column under the heading "Deaths From Heat". And the weathermen forecast that temperatures would continue to rise.
By 20 July there had been 20 consecutive days without rain, and Richard Stratton, an elderly farmer in Monmouth, reported gathering his earliest harvest since 1865.
Schoolgirl Amy Reeves, aged 10, took off her boots and stockings and left them on the grass beside a shallow pond at Longcross near Chertsey in Surrey. She was discovered drowned later that afternoon, her head caught in the weeds beneath the water.
Two days later fires began to break out spontaneously along the railway tracks at Ascot, Bagshot and Bracknell, and the gorse on Greenham Common in Newbury caught light.
In London the sky seemed unusually clear, and in King's Lynn in Norfolk a temperature of 92F (33C) broke all previous records for that part of the country.
Motorised fire-engines tested their water jets for the first time on St Paul's Cathedral. The water reached the 365ft-high dome, well above the cross.
By the end of July the combined effects of lack of rain and scorching sun had resulted in a dangerous scarcity of grass for herds and flocks. Pastures had turned brown. Farmers were being forced to raise the price of milk.
On 28 July the nature correspondent of The Times reported that even in the deepest, most sheltered lanes it was impossible to find green leaves and with a note of despair that "the crannies and rifts in walled Sussex hedgerows where one looks for rare ferns and other treasures hold only handfuls of dry dust".
Nor was that all: "The most sorrowful sign of all is the silence of the singing birds. July is never a very musical month. This year however all the sylvan music has been mute. The silence of a parched countryside."
At the beginning of August the constitutional health of England was beginning to falter badly in the continuing heat.
Only at the London Zoo in Regent's Park were there any signs of enjoyment of the oppressive temperatures. Although the keepers' thick uniforms had been replaced with special lightweight jackets, their charges were thriving in the heatwave.
The lion cubs, cheetahs, leopards and jackals in the King's Collection had become unusually active and the lordly ungulates, the rhinoceros and giraffe, strode round their enclosures happier than they had been since leaving the large sunny plains of their homelands.
The royal party had arrived at Cowes, on the Isle of Wight, for the Regatta, "an enchanting picture of gleaming sails and gently swaying masts", and the King, George V, and the Prince of Wales, the future Edward VIII, had taken to cooling themselves with a pre-breakfast swim in Osborne Bay.
But the press had quickly discovered this secluded place. As cameramen jostled to get their shots of the sovereign and his heir in bathing dress, a statement was issued by Buckingham Palace: "If less objectionable behaviour is not observed by the photographers they are warned that steps will be taken to stop the nuisance."
Many miles from the seashore, an infinitely more newsworthy if less obviously photogenic sequence of events was taking place.
In London on the first day of the month the temperature maintained a steady 81F, and just as the dock owners were hoping that the strike action of earlier in the summer was a thing of the past, between four and five thousand men employed in the Victoria and Albert Docks stopped work, and the place was at a standstill.
That August the striking men were at least relieved to be out in the open wider streets of central London. With its narrow alleys, cramped and airless at the best of times, the East End had become intolerable in the August weather.
In filthy six-storey tenement buildings with narrow stone staircases, four or five people might share not just one room but one bed, crammed into a 12ft by 10ft space, a baby squashed in one corner, a banana crate for its cot. The air was thick with the rankness of unwashed bedding and stale food.
Even during the stifling summer nights there was little chance of rest, according to one exhausted mother, for "throughout the hours of darkness - which were not hours of silence - the sleepless folk talked incessantly."
Across the country the sun continued to burn down, and the hum of activity in meadow and field ceased. The water pump and the well in the village of High Easter in Dunmow, Essex, both ran dry.
Taking advantage of cloudless skies, many keen but inexperienced car drivers had saved up their petrol and took their chance on the roads.
Mr and Mrs George Cain from Yarmouth, Norfolk, skidded on the hot slippery tarmacadam surface of the Yarmouth streets and struck an electric cable. The car was hurled across the pavement and Mrs Cain's sister, Miss Smith, was impaled on the adjoining railings.
At Ditchling in Sussex a newspaper delivery boy drove into an oncoming horse, his van crumpling on impact as the horse was crushed to death on the bonnet.
By late August lassitude had begun to further weaken the nation's energy, as the hot weather hung over England like a brocade curtain. The relentless sunshine seemed to have bleached the colour from life, replacing it with an oppressive haze.
City dwellers were worst affected, and that year holidays as a means of escape were in fashion as never before. Summer holidays had been increasing in popularity over the years since the 1871 Bank Holiday Act had entitled everyone to a day off on Whit Monday in May and another in early August, just as everyone was due days off at Christmas and Easter. But these new work-free days were intended for unrestricted freedom in the sun, rather than for religious contemplation.
In 1911, 55 per cent of the British population were taking the minimum of a one-day trip to the sea in the summer. Some work places, including paradoxically the railway companies themselves, had begun to introduce paid holidays longer than the customary half-day, and the double advantages of good weather and financial security for sometimes as much as a week combined with the ever-improving transport services to make England's coastline a crowded place that August.
There, in the simple, cost-free pleasures of sunshine, sand and water, a fleetingly realisable equality was to be found by the poor, the suffragettes, the trade unionists, and even the parliamentarians.
Sun-darkened skin was still considered most undesirable, the give-away sign of an outside labourer, and special creams to counteract accidental tanning were advertised in the women's magazines. The Lady helpfully advised the use of "Sulpholine" lotion, "a simple remedy for clearing the skin of eruptions, roughness and skin discoloration."
A greater hazard even than sunburn was the risk of exposing naked flesh in public. On many bathing beaches the sexes were still segregated, although at Bexhill in Sussex the experiment of mixed bathing had attracted much excited comment.
A cautious entry from a bathing-machine was the recognised means of making bodily contact with the sea, though at a shilling a time it was not cheap. In the town hall at Broadstairs, Kent, a conservative-minded town (in 1911 it was still being promoted in the South Eastern and Chatham Railway Handbook as Charles Dickens's favourite resort), a large unmissable notice in the hall cautioned that "No female over eight years shall bathe from any machine except within the bounds marked for females." It hung next to a second poster warning that "Bathing dresses must extend from the neck to the knees."
These rules were accepted unquestioningly and were clearly not seen as restrictions, for the editor of the Handbook felt able to boast that Broadstairs was "one of the freshest and freest little places in the world".
The fully enclosed bathing machine was a sort of garden shed with wheels at one end, its walls and roof made either of wood or canvas. Men and women would enter the machine from the back, while it was parked high up from the water line on the gender-segregated beach.
In the pitch-black hut, windowless in order to discourage any peering in, bathers would remove their clothes and put them up high on a shelf inside the machine to keep them dry, before struggling in the dark with the elaborate costume required for swimming.
A sharp tap from inside was the agreed signal for a horse, a muscly man or even occasionally a mechanical pulley contraption to drag the whole machine and its human contents to a line just beyond the surf.
There the bather could slip discreetly into water up to the neck, with no chance of any part of the body being exposed to the view of those who remained on the beach. At the point of entry there was usually an attendant, irrationally sometimes of the opposite sex. Some ladies looked forward to the moment of being lifted into the sea by strong local arms more than any other part of their holiday.
By early September, summer was not quite ready to release its long hold on the year.
There was a feeling that month of a youthful boldness, a feeling which stretched beyond the school walls. On 6 September Thomas W Burgess, aged 37, covered in lard and stark naked except for a pair of thick motorist's goggles and a black rubber bathing cap, stepped into the sea at Folkestone to make his 16th attempt to reach France by swimming across the Channel.
Despite numerous attempts over the last 36 years, no one had succeeded in this since Matthew Webb reached Calais in August 1875. Webb was not there to wave Burgess into the water; he had been killed in 1883 trying to swim the Niagara Falls in Canada.
Averaging a mile and three-quarters an hour and accompanied by a boat whose crew fed him a grape from time to time and 11 drops of champagne every 30 minutes, Burgess followed the irregular course dictated by the tide, a route he described as "a figure of a badly written capital M with a loop on first down stroke".
After 37 miles and with only two and a half left to swim he sensed himself entering foreign waters, and was promptly stung badly by a cluster of poisonous pink French jellyfish. To show he was in no way offended, he asked the boat crew to start singing "La Marseillaise", and to their accompaniment he landed on the beautiful deserted beach at Le Chatelet near Sangatte.
On the day of the swim the temperature recorder at South Kensington registered 92F, and people found themselves crossing over to the shady side of the street. There was still a severe water shortage in pockets of the country, wool workers in Bradford Mills being laid off because there was no water for the night-time cleaning of the wool.
On 11 September the average temperature suddenly dropped by 20 degrees and The Times forecast good news: "The condition over the kingdom as a whole is no longer of the fine settled type of last week and the prospects of rain before long appear to be more hopeful for all districts."0 -
be gob, wouldn't mind that next summer. Beats heading abroad for a bit of sun and after this Christmas Budget, it doesn't look likely many will be able to head for a forign holiday next year
 0
0 -
some info for you
BEST SUMMERS
1887
The driest year of the 19th century. A quarter of the average rainfall fell in parts of the country in June with none in Devon and Cornwall. But the drought meant streams and rivers dried up and crops suffered.
1893
Mile End in East London clinched the record for the longest run of days without rain. From March 4 to May 15 - 73 days.
1911
July was hot and constantly sunny with Epsom notching up 36C and Hastings enjoying 384 hours of sun. August saw Raunds, Northamptonshire notch up 36.7C and even on September 8 it reached 34.6C.
1976
Standpipes in the street and adverts telling us to share a bath. The hottest summer since records began brought drought but a glorious summer. From June 23 to July 17 there were 15 days of 32C.
Heathrow saw 52 days above 25C. There was little rain until the end of August.
2003
The hottest day in British history was notched up six years ago today in Faversham, Kent, when 38.5C was recorded. But a dispute over the reading means that the 38.1C at Kew Gardens on the same day stands as the official record. Scotland notched up a new record high, too, with 32.9C set at Greycrook in the Borders, beating a record set in 1908.
WORST SUMMERS
1816
There were no bikinis on the beaches of Worthing this year (not that they had been invented, mind). 1816 saw temperatures that would make a penguin reach for a muffler. Averages were 12.8C for June, 13.4C for July and 13.9C for August. Cold spells around the world were thought to have been triggered by low solar activity and volcanos spewing ash into the atmosphere.
1879
One of the coldest summers for the previous 160 years, the warmest it got was 26.8C in Norfolk. It was also the wettest summer in the North East until just two years ago.
1903
London suffered the wettest month on record with a third of its rainfall dropping in two weeks in June. In Camden, rain fell continuously from 1pm on the 13th to 11.30pm two days later - 58 hours and 30 minutes. The record still stands.
1909
The coldest June for 230 years, dropping to 10C. July wasn't much better and from May 23 to August 6 temperatures didn't climb above 27C.
1954
At Tynemouth not a single ray of sun was seen from August 16 to 24.
WEIRDEST SUMMERS
1906
A scorching day on September 1 saw Manchester City take on Woolwich Arsenal in 32C heat. The part-time players, on a diet of beer and cigarettes, soon began to wilt under the heat and three City players were out of the game before half-time. The team finished with just six players - but sporting Arsenal kept the score low at just 4-1.
1913
The saying goes that the weather on St Swithin's day, July 15, will set the tone for the next 40. But in 1913 15 hours of rain was followed by 31 days of sun from 40 in London.
1936
The temperature dropped to 1.1C overnight on August 29 in Rickmansworth, Herts. But by the middle of the afternoon the thermometer had soared to 29.4C.
1975
The latest snow storms recorded fell across Britain in early June, as far south as Surrey. The Derbyshire v Lancashire cricket match at Buxton was cancelled due to snow.
1982
Newcastle managed to go from June 17 to 26 with just 20 minutes of sun.
STORMIEST SUMMERS
1843
One of the worst storms to batter Britain happened on August 9. Hail stones as big as pigeon eggs fell, forming huge drifts. Small tornadoes uprooted trees and wrecked roofs. Crops were flattened which led to a poor harvest.
1906
Britain basked in a heatwave during July. But on August 2 the weather broke in Guildford and the storm saw almost continuous lightning and fierce wind, uprooting trees, knocking holes in the bridge and demolishing houses. At the station trains were lifted off their tracks.
1912
A devastating flood hit Norfolk when a quarter of average annual rainfall fell on August 25. The previous high water mark in Norwich was exceeded by 15ins. Three drowned. 8,000 made homeless.
1939
Lightning killed seven people and injured 19 when storms swept London. The dead were on a day out in Ilford's Valentines Park when they sheltered in a hut. But lightning struck the iron roof with devastating consequences.
1958
The biggest hailstone recorded hit West Sussex in Horsham, creating a 60 mm crater. It weighed nearly five ounces and was 10cms across.
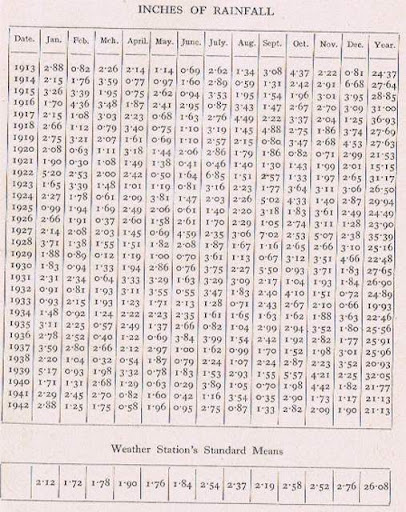
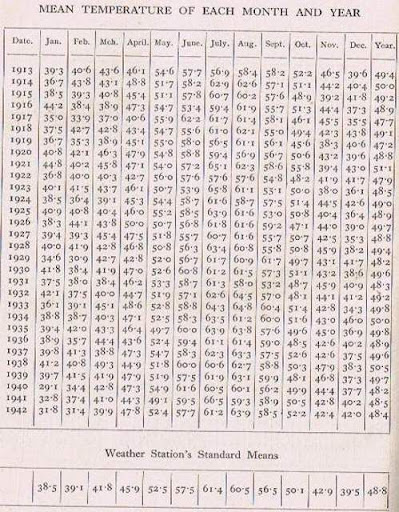
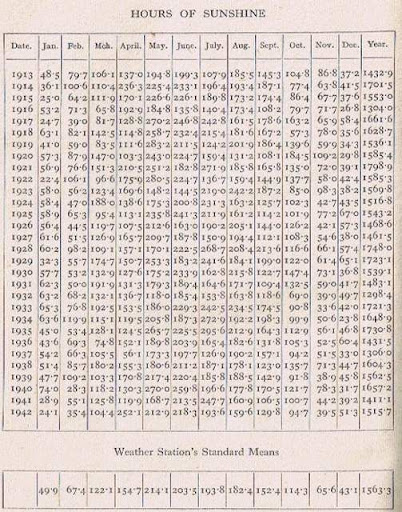
norwich readings 1913-1942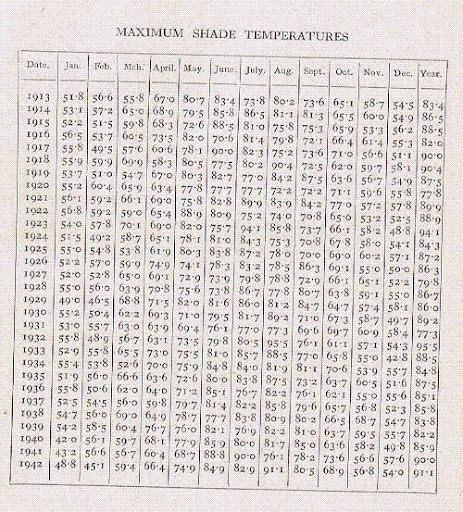
 0
0 -
update
Spotless Days
Current Stretch: 18 days
2009 total: 229 days (79%)
Since 2004: 740 days
Typical Solar Min: 485 days0 -
Advertisement
-

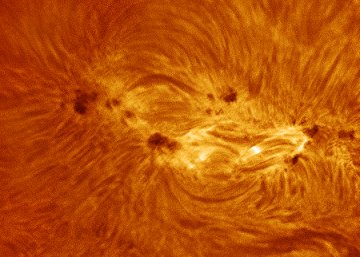
Detailed observations of sunspots have been obtained by the Royal Greenwich Observatory since 1874.
These observations include information on the sizes and positions of sunspots as well as their numbers. These data show that sunspots do not appear at random over the surface of the sun but are concentrated in two latitude bands on either side of the equator.
A butterfly diagram (updated monthly) showing the positions of the spots for each rotation of the sun since May 1874 shows that these bands first form at mid-latitudes, widen, and then move toward the equator as each cycle progresses.
Notice too how sunspot numbers have increased alot from solar cycle 15.
Today's sun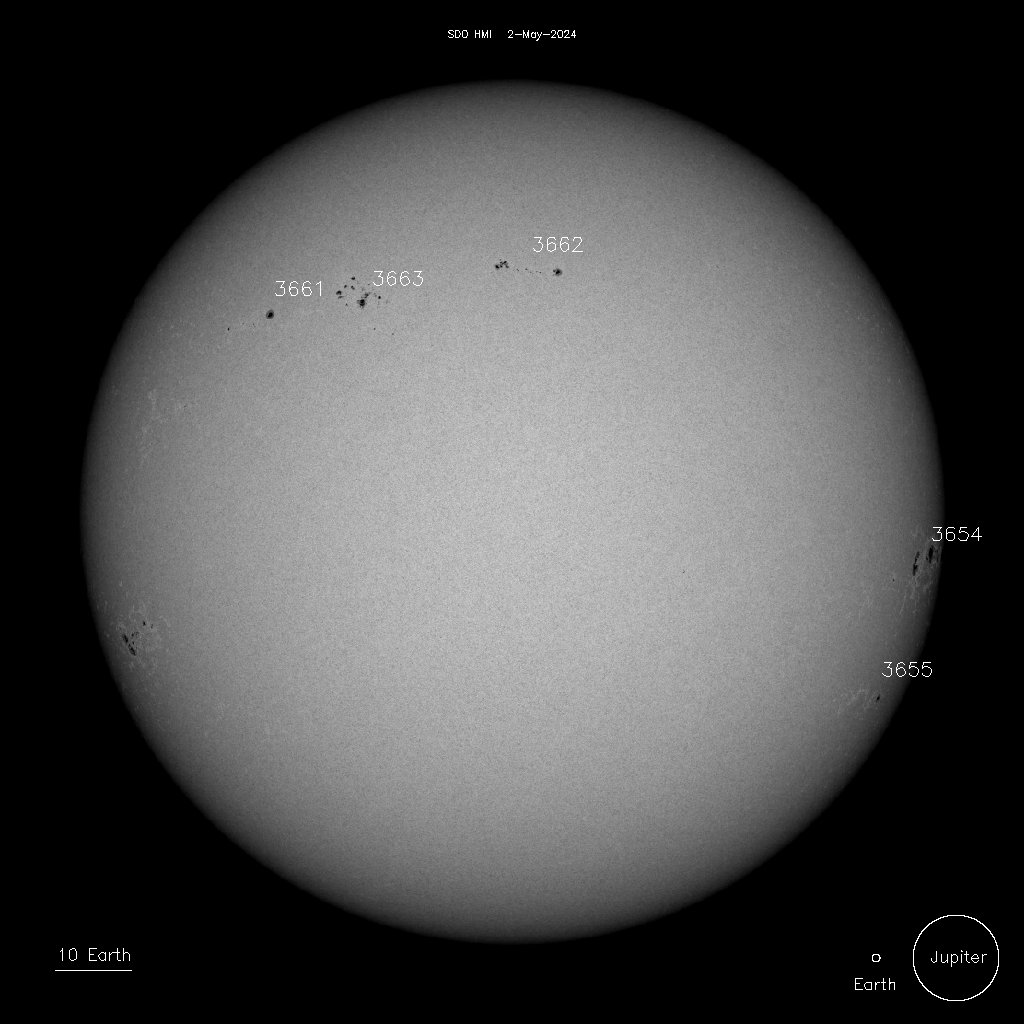 0
0 -
a little spoilsport.
Daily Sun: 21 Oct. 09
Tiny new-cycle sunspot 1028, which emerged yesterday for a few hours, is already fading away.
i wonder would a spot like that have even been noticed in times of the maunder and dalton minimums to break a lenghty spotless sun.
i seriously doubt it.0 -
Saw this report on sky news in august,only came across it now on youtube, http://www.youtube.com/watch?v=09h48RJiQM00
-
Saw this report on sky news in august,only came across it now on youtube, http://www.youtube.com/watch?v=09h48RJiQM0
lost me on the odd and even cycles , can you explain the point he was trying to makeA belief in gender identity involves a level of faith as there is nothing tangible to prove its existence which, as something divorced from the physical body, is similar to the idea of a soul. - Colette Colfer
0 -
silverharp wrote: »lost me on the odd and even cycles , can you explain the point he was trying to make
I think it's something to do with magnetic fields co-inciding and opposing on alternate cycles. Must read up on it again in one of the links further up this thread.0 -
This video from piers should help you understand that better.silverharp wrote: »lost me on the odd and even cycles , can you explain the point he was trying to make
http://www.youtube.com/watch?v=0Qi8oZ2vG0c
im also gonna email piers and ask alot of questions,so hopefully he'll respond so i can share it with you all.0 -
All-time October low recorded in Bavaria
Published: 20 Oct 09 16:36 CET
Online: http://www.thelocal.de/society/20091020-22693.html
Meteorologists on Tuesday morning recorded the lowest ever October temperature in Germany, as the mercury dipped to a chilly -24.3 degrees Celsius in Bavaria’s Berchtesgaden national park.0 -
Sunspot activity has shown an increase since the long quiet spell of July-September 2009 (51 days in a row with a blank solar surface), but it’s certainly nothing to crow about just yet.
A pronounced sunspot group helped push the solar 10.7cm radio flux to its highest level in 18 months in late September; since then, a 19-day blank streak resumed the march of sunspot-less days which now ranks 6th for any year since 1900.
A weak sunspot briefly formed for only a matter of hours on October 21st ; but there’s an indication of another very minimal one forming.
None of these events signal any type of dramatic uptrend in solar activity; in fact, the sun was far more active as to sunspot counts in October 2008 than observed thus far in October 2009 (thru Oct 21).
As I have stated in numerous previous sunspot posts, trends make or break either an ending or continuance of this deep solar minimum.
The radio flux “spike” in late September was significant, but until the overall solar flux and sunspot activity holds a consistent trend for a few months, we are still placed in the position of “hide and watch”.0 -
just listening to this now, seems interesting
http://www.financialsense.com/Experts/2009/Plimer.html
Ian Plimer
Author
Heaven and Earth: Global Warming, the Missing Science
Climate, sea level, and ice sheets have always changed, and the changes observed today are less than those of the past. Climate changes are cyclical and are driven by the Earth's position in the galaxy, the sun, wobbles in the Earth's orbit, ocean currents, and plate tectonics. In previous times, atmospheric carbon dioxide was far higher than at present but did not drive climate change. No runaway greenhouse effect or acid oceans occurred during times of excessively high carbon dioxide. During past glaciations, carbon dioxide was higher than it is today. The non-scientific popular political view is that humans change climate. Do we have reason for concern about possible human-induced climate change?
This book's 504 pages and over 2,300 references to peer-reviewed scientific literature and other authoritative sources engagingly synthesize what we know about the sun, earth, ice, water, and air. Importantly, in a parallel to his 1994 book challenging creation science, Telling Lies for God, Ian Plimer describes Al Gore's book and movie An Inconvenient Truth as long on scientific misrepresentations. Trying to deal with these misrepresentations is somewhat like trying to argue with creationists, he writes, who misquote, concoct evidence, quote out of context, ignore contrary evidence, and create evidence ex nihilo.
Ian Plimer, twice winner of Australia's highest scientific honor, the Eureka Prize, is professor in the School of Earth and Environmental Sciences at The University of Adelaide and is author of six other books written for the general public in addition to more than 120 scientific papers.A belief in gender identity involves a level of faith as there is nothing tangible to prove its existence which, as something divorced from the physical body, is similar to the idea of a soul. - Colette Colfer
0 -
Advertisement
-
-
Glad to see someone is putting it up to the likes of AL GORE AND HIS CARBON trading company.0 -
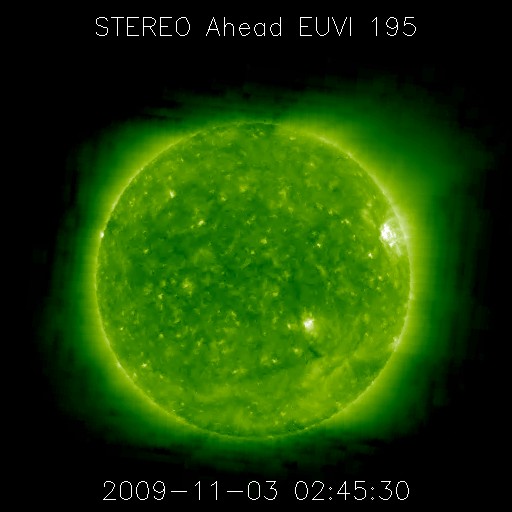
STEREO Ahead image)

SUNSPOT 1029 has become more magnetically organized and there is a chance for B and C-Class solar flares. The solar flux reached 76.9 Saturday. This is the highest flux reading of Cycle 24 thus far. When will the solar flux crack 80? 100? Time will tell.
Since last month, there has been a sharp influx of sunspots, near sunspots and magnetic regions. You can still see some of the leftover regions from a month ago.
Sunspot 1029 (Sunday)
Magnetic Map of the sun (Saturday) 0
0 -
Hmmm i wonder if it's all gonna kick off!!!
new solar cycle predictions,
http://www.hm-treasury.gov.uk/d/Solar_Cycles_24_and_25_and_Predicted_Climate_Response_22nd_October.pdf 0
0 -
KEN RING
I don't think Ireland is in for as a bad winter as parts of Europe and Asia and most of the US will probably have, and this is because of the low sunspot count that's going on making the world cooler at the moment, and the world has been cooling since 2004, so Ireland just won't have the usual warmer days causing the evaporation which will fall as precipitation, on days that are cool enough. So I would say it won't be a nice winter but it won't be severe.0 -
The Sunspot (1029) that has been visible for the past 4/5 days has turned into a biggie. Largest sunspot in the past year apparently.

Just for a bit of perspective on the size of this sunspot, the entire Earth could fit into the core,and end to end it is about 50,000Km long.0 -
Advertisement
-
All quiet on the western front!
 0
0 -
Ok, so we've had 3 crap summers in a row, where the jet stream was very reluctant to move north and we're in the middle of the deepest solar minimum in 100 years. So what were the summers like (in this part of the world) around 1911? Anyone know where to find out? And if solar cycle 24 continues to ramp up slowly, what's the prospects for next years summer?
http://booty.org.uk/booty.weather/climate/1900_1949.htm
Great historical record of weather for the last few thousand years with great detail for the past 1,000 years!0 -
Deleted User wrote: »All quiet on the western front!
NOT-SO-BLANK SUN: Today, the sunspot number is zero, which means the sun is blank, right? Wrong. This morning, NASA's STEREO-A spacecraft photographed sunspot 1029 seething with activity over the sun's western horizon:This impressive sunspot, which rotated over the sun's western limb three days ago, does not add to the sunspot number because it is no longer visible from Earth. Astronomers only count spots that are on the Earth-facing side of the sun. That's how it's been done since Rudolph Wolf invented the sunspot number in 1848. In those days, only one side of the sun was visible from Earth, so the tradition was established.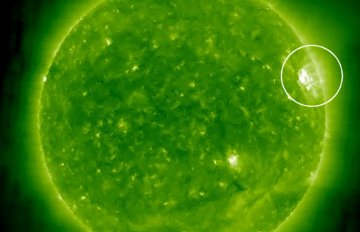
Photo credit: STEREO Extreme Ultra Violet Telescope (195 A)
Now, however, for the first time in the history of astronomy, NASA's twin STEREO spacecraft are seeing over the sun's horizon, tracking sunspots that officially "don't count." The two spacecraft are moving toward opposite sides of the sun, and by February 2011 the entire sun will be under their watchful eyes. Perhaps it is time to start thinking about a "whole sun" sunspot number. As today's image shows, the sun is not always as blank as it appears to be.
so the question now is, do we continue to count whats being done for centuries or get out of the dark ages and start counting properly?
I feel we have the technology now to do it right so lets start using it.0 -
The summer of 1911 was hot in both western Europe and eastern North America. 1912 was considerably cooler in both cases, 1913 somewhat warmer than average in North America.
I think the better comparison is probably to 1809-11 or thereabouts.
However, I think of solar activity as a background factor in overall global climate, changing the baseline. There can still be large variations on that somewhat depressed baseline. This seems to be what we're seeing in 2009 certainly in North America where the warmest months are not that spectacular and the coldest months have been very cold (last January for example in central and eastern N America).
If a major El Nino was to come along either soon or in 2-3 years, this could overwhelm low solar activity as a forcing feature and change the baseline to something above 30-year averages.
Personally, I think AGW effects are something like 0.5 C, solar variability can reduce baselines by about 1.0 C, and natural cycles and variation can account for up to 4-6 C deg depending on region. If there were to be a volcanic dust veil that could drop the baseline another 1-2 C deg.
All these factors are largely independent and have to work together in ways that could involve different sorts of "trade offs" regionally. For example, where I live (British Columbia) we can count on a large positive anomaly from a moderate to strong El Nino lasting 12-18 months. In Baffin Island at the other end of the country, the likely result is slightly negative.
People are talking a lot about a "solar storm" in 2012-13, is there any real consensus among predictions about this being unusually severe, or do they just mean the usual peak in auroral activity that comes along usually with or just after the solar cycle peaks? I'm wondering how much of the "Mayan doomsday" thinking has crept into this solar storm discussion.
Just to touch on my views of the Mayan doomsday (21 Dec 2012) I think it means nothing at all. The so-called alignment of the sun and galactic centre is not precise but is only marginally different from year to year, it's not as though suddenly there is some monstrous alignment that was never close before. Also the concept of Mayan long calendar cycles (260 yr) ending and new ones starting with supposed cataclysmic portents for earthlings, this seems imprecise at best and is really just a feature of their way of keeping time, not any sort of meaningful physical process. Of course, with the state of the world right now, we'll be lucky to see how 21 Dec 2012 actually turns out.0 -
so the question now is, do we continue to count whats being done for centuries or get out of the dark ages and start counting properly?
I feel we have the technology now to do it right so lets start using it.
I would say that for statistical analysis you would need to retain the existing method to be consistant with historical data.
But there is nothing wrong with reading those on "the dark side if the sun as well" on a separate chart.
Question: do the spots on the other side affect the Earths weather?0 -
Advertisement
-
How Long Will Our Sun Remain Quiet and Cosmic Rays Increase?
“We don’t have records prior to 1874 that give us details about the sun.
Compared to the past 130 years, our sun now is unprecedented as far as
how slow this Solar Cycle 24 is taking off - or not taking off!” [SIZE=+1]
- D[/SIZE]avid Hathaway, Ph.D., NASA Heliospheric Team Leader
N[SIZE=-1]ASA'S Advanced Composition Explorer satellite (ACE) launched
August 1997 to study solar particles and galactic cosmic rays. It has nine
instruments onboard that helps it track solar wind and galactic cosmic
rays from interstellar space beyond the heliosphere. ACE serves as a
space weather station while in orbit. ACE can provide a one-hour advance
warning of any geomagnetic storms that are caused by coronal mass ejections.[/SIZE]
[SIZE=-1]
Strong solar coronal mass ejections can disrupt radio, TV and
telephone communications on Earth.[/SIZE]
What has happened to our sun?
NASA’s Heliospheric Team Leader, David Hathaway, says he cannot find another solar minimum in the past that has acted quite like this one that has put out only a few sunspots since Solar Cycle 24 officially began at the end of 2008.
Our sun is so quiet that solar physicists from around the world gathered in September to discuss whether we are entering a period similar to the Maunder Minimum of 1645 to 1715, when for 70 years the sun was spotless and there was a mini-ice age.
There was no ACE satellite then, but measurements of beryllium concentrations in ice layers indicate that during the Maunder Minimum, cosmic rays were 2.5 times what they are now. Dr. Hathaway points out that Earth scientists did not start measuring cosmic rays until the beginning of the modern Space Age in the early 1960s, and that for the past five decades, our sun might have been unusually active.
[SIZE=+1]Interview:[/SIZE]
David Hathaway, Ph.D., Heliospheric Team Leader, NASA Marshall Space Flight Center, Huntsville, Alabama: “In the 50 years or so we’ve been making the (cosmic ray) measurements – yeah! this is by far the highest level of galactic cosmic rays that we’re seeing at Earth and we know exactly what is causing it. It’s the sun’s weakened magnetic fields and weakened solar winds that are all related to this Solar Cycle 24 minimum.
Beryllium is produced in the Earth’s upper atmosphere by cosmic rays striking nitrogen in particular and you find it in ice cores. If you look back at the record, there are significant changes. But, the amount that you see also depends on the strength and variations of the Earth’s magnetic field.
Periods like the Maunder Minimum occupy about 15% of the time. If you looked over thousands of years of Beryllium 10, it looks like 15% of the time, the sun is in this quiet state where it’s not producing sunspots. Given that, we’re about due. And I think that’s what comes up and why people are actively talking about grand minima like the Maunder Minimum is that if you go by percentages and the fact it has been so active, then we’re about due (for a long minimum).
We don’t have records prior to 1874 that give us details about the sun. Compared to the past 130 years, our sun now is unprecedented as far as how slow this Solar Cycle 24 is taking off - or not taking off!
[SIZE=+2]Understanding the Peculiar
2008 - 2009 Solar Minimum [/SIZE]
WHEN YOU GET TOGETHER NOW WITH YOUR SOLAR AND HELIOSPHERIC COLLEAGUES, DO YOU TALK ABOUT WHAT THE ODDS ARE RIGHT NOW THAT WE COULD BE GOING INTO ANOTHER MAUNDER MINIMUM?
It comes up in conversations all the time! (laughs) There is no doubt about it - it’s in the back of our minds!
Certainly the Maunder Minimum comes up. We recently had a meeting of 60 or 70 solar and heliospheric physicists from around the world who met on Mount Desert Island in Maine back in late September.[SIZE=+1]S[/SIZE][SIZE=-1]eptember 2009 gathering of solar and heliospheric physics from around the world
on Mount Desert Island, Maine, to discuss “Understanding the Peculiar Solar Minimum.”[/SIZE]The title of the meeting was “Understanding the Peculiar Solar Minimum” – meaning this one! (laughs) The interesting thing is that at one point during that meeting, we took a vote amongst ourselves about how many thought that this Solar Cycle 24 is so peculiar that it would have a name attached to it, like Maunder Minimum or Dalton Minimum. It was a small minority that thought that it was that peculiar.The vast majority felt that this is a significant minimum. It’s smaller than anything we have seen in the 50 years of the Space Age. But it does look like you can go back 100 years or so and find other similar minima.
Now, science is not done by voting! (laughs) So, it remains to be seen about what actually does happen in this Solar Cycle 24.
These were some of the world’s experts in these areas that concluded – yes, this is a deep solar minimum, but at this point, we’re not quite ready to say this is so weird that we need to give a name to it – that it’s something we haven’t seen in 200 years.
HOW DID YOU VOTE?
I didn’t think it was that peculiar. The only peculiar thing I see about it is that it’s so reluctant to get going.
Others are talking about the cosmic rays are through the roof. The number of spotless days is more than we’ve seen in a hundred years. The sun’s poles are weaker than we’ve seen in 30 years. Boy! We have a lot of things we’d like to do that require sunspots on the sun to help us understand how the sun and solar activity work. And without sunspots, we’re kind of shut down! (laughs)
And we also know that at some point, the sun is going to go into another minimum like the Maunder Minimum, but predicting when – I’m not sure I’m ready to go out on that limb. (laughs)
[SIZE=+2]What Happened to 2006 Predictions
of Huge Solar Cycle 24?[/SIZE]
ISN’T IT ESPECIALLY STRANGE FOR YOU BECAUSE THREE YEARS AGO, ALL THE PHYSICS OF THE SUN THAT YOU AND NASA AND EVERYBODY ELSE WAS USING WERE ANTICIPATING THAT THIS COULD BE THE BIGGEST SOLAR MAXIMUM ON RECORD?
There were indications back then. I am writing a paper – it’s on my computer as we speak (laughs) – basically saying that I made a big mistake – myself and Bob Wilson – when we wrote a paper in 2006, suggesting Solar Cycle 24 was going to be a huge cycle based on conditions at that time. The problem we had with our prediction was that it was based on a method that assumes that we’re near sunspot cycle minimum.
We had just previously gone through three or four sunspot cycles that had been only ten years long each, so for the one in 1996 to 2006, it seemed like a reasonable assumption. But as we now know, we were off by at least two years. And if we take conditions on the sun now, it’s a completely different story. The conditions now – using even that same technique from 2006 – says that the next sunspot cycle is going to be half what we thought it was back in 2006.
Another big prediction in 2006 was based on a dynamo model – a model for how the sun produces magnetic fields - and it suggested a huge cycle.
But there also were people back at that time saying otherwise. A group of colleagues led by Leif Svalgaard, Ph.D., were looking at the sun’s polar fields and saying even at that point, the sun’s polar fields were significantly weaker than they had been before and those scientists back then predicted it was going to be a small cycle.
[SIZE=+2]How Small Will Solar Cycle 24 Be? [/SIZE][SIZE=+1]S[/SIZE][SIZE=-1]unspot 1029, a Solar Cycle 24 magnetic disturbance,[/SIZE]I’ve come around to that view now. I think there is little doubt in my mind now that we’re in for a small cycle. The big question now is how small? I think most of us are predicting small cycles. I think even the techniques I’m using now are suggesting HALF the size of the last three or four solar cycles, but my fear is that even that might be too big just from the fact that it’s taken so long for this Solar Cycle 24 to really get off the ground and start producing sunspots.
grew from October 24 to 29 and has reached about 32,000 miles
(50,000 kilometers) end-to-end as it heads around to the back side of the sun.
According to Spaceweather.com, the number of days in 2009 without sunspots
as of November 12, was 249[/SIZE][SIZE=-1], or 76% of the time our sun was blank.
I have no doubt at this point that it’s going to be a little cycle. My current prediction is that it’s going to be about half of what we’ve seen in the last four solar cycles or so. But in my gut, I feel it’s going to be smaller than that! (laughs) It’s just so slow in taking off and the indicators that we see – both the polar fields and the geomagnetic indicators are lower than anything we’ve seen before.
[SIZE=+2]No More 2012 Solar Maximum for Cycle 24?[/SIZE]
ISN’T IT IRONIC THAT THERE HAS BEEN ALL THIS ANTICIPATION OF 2012 BECAUSE OF THE CLOSING DOWN OF THE MAYAN CALENDAR AND THE EXPECTATION THAT POSSIBLY SOMETHING ON OR FROM THE SUN OR RELATED TO THE SUN MIGHT IMPACT THE EARTH DURING SOME LARGE SOLAR MAXIMUM IN 2012. BUT RIGHT NOW, DOES IT SEEM LIKE THE SUN WILL BE ESPECIALLY QUIET IN 2012?
Indeed. In fact, when we came out with the prediction of a big cycle back in 2006, I got lots of emails from folks. If it was going to be such a big cycle, it should have started in 2006 so by 2012, it ought to be at its peak.
And at this point, it looks like, ‘No, I don’t think so!’ (laughs) Not at all! I think it’s going to be a small peak and it’s not going to be in 2012. It’s going to be in 2013. So, I think any connection that people might try to make between solar activity and the end of the Mayan calendar cycle is problematic.
IN FACT, IN 2012, THE SUN MIGHT BE THE QUIETEST IT HAS BEEN AT A SOLAR MAXIMUM FOR 130 OR MORE YEARS?
Yes, indeed! It might be. The Mayans never said there were going to be disasters. It’s just that it’s the end of that cycle and you start another one.
IS IT FAIR TO SAY THAT THE SUN IS BOTH PECULIAR AND UNPREDICTABLE?
Yeah, I’d buy that! (laughs) Most definitely!
[SIZE=+2]Our Variable Sun[/SIZE]
WHICH IS KIND OF EERIE FOR EARTH LIFE DEPENDENT ON THAT SUN?.
Yeah, the good thing is that when you look at what we really depend upon, which is the radiant energy from the sun – even over the full extent of the sunspot cycle, that only varies by 1/10th of 1%. So, we’re lucky in that regard. It’s a small change. If it were big, I think in terms of evolution, we wouldn’t be here talking about it. But the fact is when it comes to variable stars, our sun’s variability is tiny. Any big solar variations could really wreak havoc on our climate and survivability.
[SIZE=+2]Our Middle Age Sun Is Getting Brighter [/SIZE]
In fact, in the much longer picture looking over billions of years, the sun is getting brighter. The sun now is some 30% brighter as far as the energy it puts out than it was 3.5 or 4 billion years ago. This is just part of how stars work. As they burn up the hydrogen in the core to make helium, the core starts to collapse a bit and heat up and that expands the outer layers and makes the sun brighter.
IN THE EVER-INCREASING BRIGHTNESS OF OUR SUN, IT IS HEADED TO BECOMING A RED GIANT AT ITS DEATH, ISN’T IT?
Yeah – we’ve got a long time to wait for that – another 4.5 to 5 billion years! But the sun is quite erratic and really hard to predict. I know from very personal experience!” (laughs)0 -
Himmm, yes, we live in interesting times, but I think I might prefer uninteresting and stable, for a Chinese man once said about his enemy.
"May he live in interesting times"0 -
SOLAR MINIMUM:
The sun is in the pits of a very deep solar minimum. Many researchers thought the sunspot cycle had hit bottom in 2008 when the sun was blank 73% of the time. Not so. 2009 is on the verge of going even lower. So far this year, the sun has been blank 75% of the time, and only a serious outbreak of sunspots over the next few weeks will prevent 2009 from becoming the quietest year in a century. Solar minimum continues.
Spotless Days
Current Stretch: 9 days
2009 total: 252 days (75%)
Since 2004: 763 days
Typical Solar Min: 485 days
Remember that in 2008 we had 266 spotless days so def on course to beat it.0 -
We stand vindicated, my friend.
The hacked emails are turning up the heat on the global warming fanatics.The "trick" temperature measurement mail is particularly insightful.
Now the only fair thing to do is to strip al gore of the peace prize and give it to you:D.
The research on your thread alone trumps all the pseudo-scientific speechs and presentations of big Al.You are a credit to the scientific community.
Years down the road Al's movie would be one of the best comedies of all time:D.0 -
Sunspot number: 0
Updated 05 Dec 2009
Spotless Days
Current Stretch: 13 days
2009 total: 256 days (76%)
Since 2004: 767 days
Typical Solar Min: 485 days
Still very quiet, just one spot around the other side.
Another Dalton minimum perhaps??0 -
Deleted User wrote: »Sunspot number: 0
Updated 05 Dec 2009
Spotless Days
Current Stretch: 13 days
2009 total: 256 days (76%)
Since 2004: 767 days
Typical Solar Min: 485 days
Still very quiet, just one spot around the other side.
Another Dalton minimum perhaps??
Just 11 more days to the record.Things are getting really interesting now.0 -
Yes our main climate driver has gone very quiet again after the recent burst of activity as the Flux chart indicates.

To help you understand when we talk about Flux,here's an excellent pdf on the matter.
http://www.arrl.org/tis/info/pdf/0209038.pdf0 -
http://www.independent.co.uk/environment/climate-change/sunspots-do-not-cause-climate-change-say-scientists-1839867.htmlSunspots do not cause climate change, say scientists
Leading scientists, including a Nobel Prize-winner, have rounded on studies used by climate sceptics to show that global warming is a natural phenomenon connected with sunspots, rather than the result of the man-made emissions of carbon dioxide.
http://www.weatherzone.com.au/news/minus-13-degrees-the-coldest-its-been-in-april/11794
Last April, AustraliaA new Australian record was set early this morning, a temperature of minus 13 degrees, at Charlotte Pass on the Snowy Mountains.
http://www.perthnow.com.au/news/bureau-records-coldest-perth-september-day-in-10-years/story-e6frg1rc-1225781188834
(Western Australia)PERTH shivered through the coldest September day in 10 years
http://mapcenter.hamweather.com/records/7day/us.html?c=maxtemp,mintemp,lowmax,highmin,snow
USA more recently
Harvard Astrotemperature records were set this month in the US:
765 new snowfall records
224 Low Temperature
349 Lowest Max Temperatures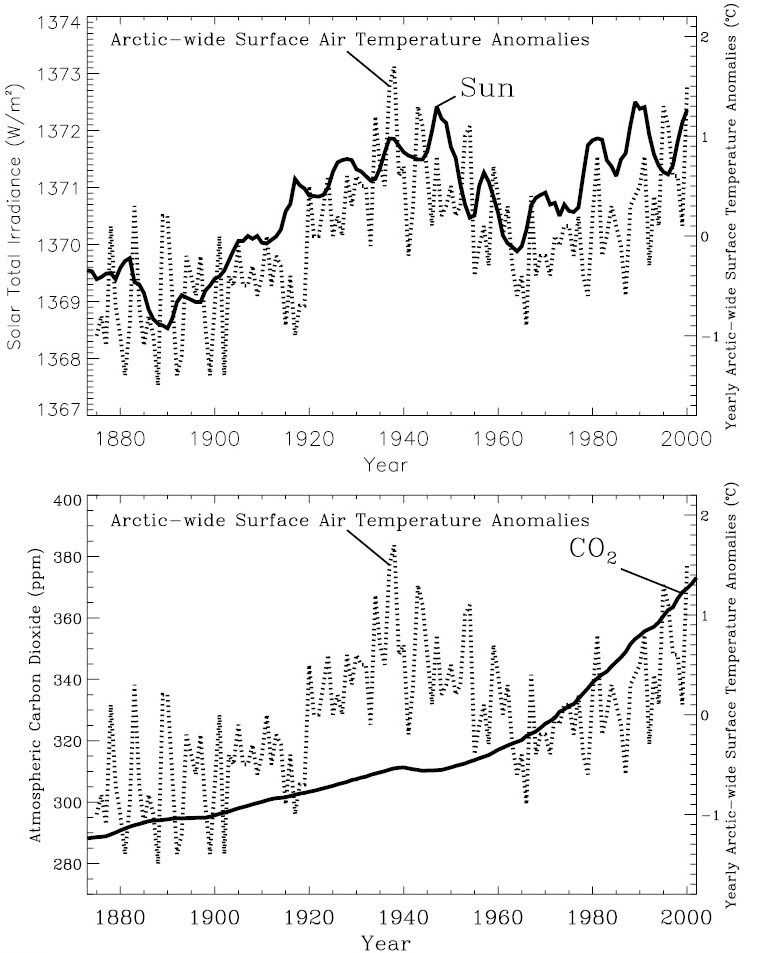 0
0 -
^ Interesting, a good post for the "climategate" threads!0
-
Apologies if this has been posted already, its from CERN and a lecture by James Kirkby. who is leading an experiment known as CLOUD The lecture is about the suns possible impact on climate variations.
The vid is about an hour long. Lots of science but well worth stiking with. I have only watched half of it at this point but Kirkby himself doesn't get political as his breif is science and attempting to understand.
http://cdsweb.cern.ch/record/1181073/0 -
Advertisement
-
An analyst I respect recommended this website if one is interested in the area of climate science.
http://www.friendsofscience.org/A belief in gender identity involves a level of faith as there is nothing tangible to prove its existence which, as something divorced from the physical body, is similar to the idea of a soul. - Colette Colfer
0 -
Cheers for the input lads.
We have a huge sunspot at the moment thats 6 times larger than the earth and still growing.
With only a couple of weeks left till the new year,we need 7 more spotless days to tie with last year so hopefully we beat it.
Spotless Days
Current Stretch: 0 days
2009 total: 259 days (75%)
Since 2004: 770 days
Typical Solar Min: 485 days0 -
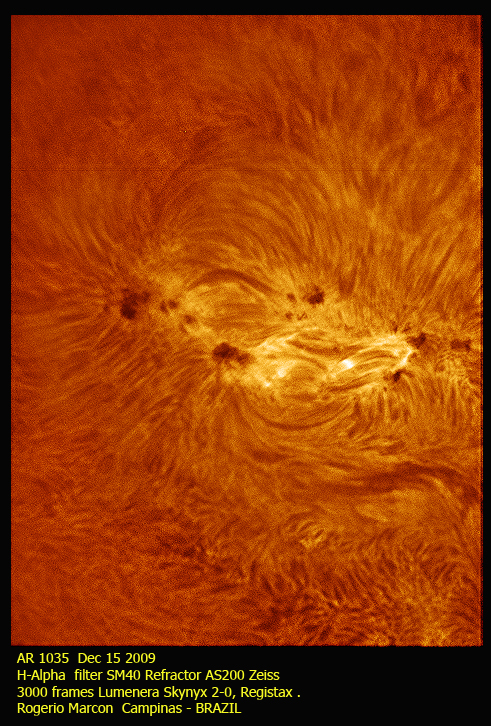
http://spaceweather.com/New sunspot 1035 is growing rapidly and it is now seven times wider than Earth. This makes it an easy target for backyard solar telescopes. Yesterday, Rogerio Marcon of Campinas, Brazil, photographed a maelstrom of hot plasma and magnetic filaments connecting the sunspot's dark cores:"Solar activity is picking up," he says.
The magnetic polarity of the spot identifies it as a member of Solar Cycle 24--the cycle we've been waiting for to end the deepest solar minimum in nearly a century. One spot isn't enough to end the lull, but sunspot 1035 could herald bigger things to come. Stay tuned for updates.
Another couple of days and it will be around the other side so we could still see th record for spotless days.0 -
It would be good to talk to al gore today about all the global warming thats going on.
Washington would be a good place,except for an inconvenient fact.He doesnt want to freeze his balls off as washington is experiencing its worst blizzard since records began.
Perhaps his next movie should be about how all the eurostar delays were figments of the passenger's imagination.0 -
There's nothing like watching a few protesters freezing while protesting against "global Warming" sonetimes the Irony isn't noticed!.
Anyway way OT, so back on track.
Three sets of spots visible at the moment, the chances of any more spotless days this year is diminishing.0 -

SOHO / NASA image 22 Dec 2009. Sunspots/developing spots circled.
The solar surface is “crackling” with life as it exhibits the greatest activity so far in Solar Cycle 24.
The year 2009 needs 8 more sunspot-free days to exceed last year’s “blank” count of 266 as of the 22nd.
This will not happen.
The 2008 record of quietest sunspot levels since 1913 appears “ safe” now as it’s mathematically impossible for 2009 to exceed 2008 after the 23rd.
The current sunspot “burst”, which started in early December, is the longest continuous sunspot string since Cycle24 began.
These data match up well with more recent solar forecasts, and an upward trend of solar emission since late September. The outlooks were consistently “off” for more than a year, but are now falling in line with projections. Solar activity and sunspot counts should continue to ramp upward as we move into 2010.0 -
I just found this thread today and felt compelled to say wow - fascinating stuff! Keep up the great work. I shall drop in more often for a read.0
-
http://www.prophecynewswatch.com/March26/2692.html
although it is a bible type website, they lifted this article from the new scientest website and it is very interesting,echoing pretty much what has been said on here.0 -
the iceman come wrote: »http://www.prophecynewswatch.com/March26/2692.html
although it is a bible type website, they lifted this article from the new scientest website and it is very interesting,echoing pretty much what has been said on here.
Actually, this thread is about the likelyhood of the opposite effect - a quieter sun and fewer sunspots & solar storms are likely this solar cycle!0 -
Advertisement
-
So close ,yet so far.Breaks my heart.:pac:
Daily Sun: 26 Dec. 09
 The Earth-facing side of the sun is blank--no sunspots. Image credit: SOHO/MDI Sunspot number: 0
Spotless Days
Current Stretch: 1 days
2009 total: 260 days (72%)
Since 2004: 771 days
Typical Solar Min: 485 days0


![[Deleted User]](/applications/dashboard/design/images/defaulticon.png)


