Advertisement
If you have a new account but are having problems posting or verifying your account, please email us on hello@boards.ie for help. Thanks :)
Hello all! Please ensure that you are posting a new thread or question in the appropriate forum. The Feedback forum is overwhelmed with questions that are having to be moved elsewhere. If you need help to verify your account contact hello@boards.ie
Hi all! We have been experiencing an issue on site where threads have been missing the latest postings. The platform host Vanilla are working on this issue. A workaround that has been used by some is to navigate back from 1 to 10+ pages to re-sync the thread and this will then show the latest posts. Thanks, Mike.
Hi there,
There is an issue with role permissions that is being worked on at the moment.
If you are having trouble with access or permissions on regional forums please post here to get access: https://www.boards.ie/discussion/2058365403/you-do-not-have-permission-for-that#latest

The sun is dead!! Mini iceage???

1111214161719

Comments

  • Registered Users, Registered Users 2 Posts: 13,666 ✭✭✭✭sryanbruen


    July 2018 had the lowest monthly sunspot number since August 2009.

    The blue line is every month's sunspot number from January 2006 to July 2018 whilst the red line is the 13 month running average for sunspot numbers.

    jr2gE96.png

    Data comes from SILSO.


  • Registered Users Posts: 1,985 ✭✭✭BLIZZARD7


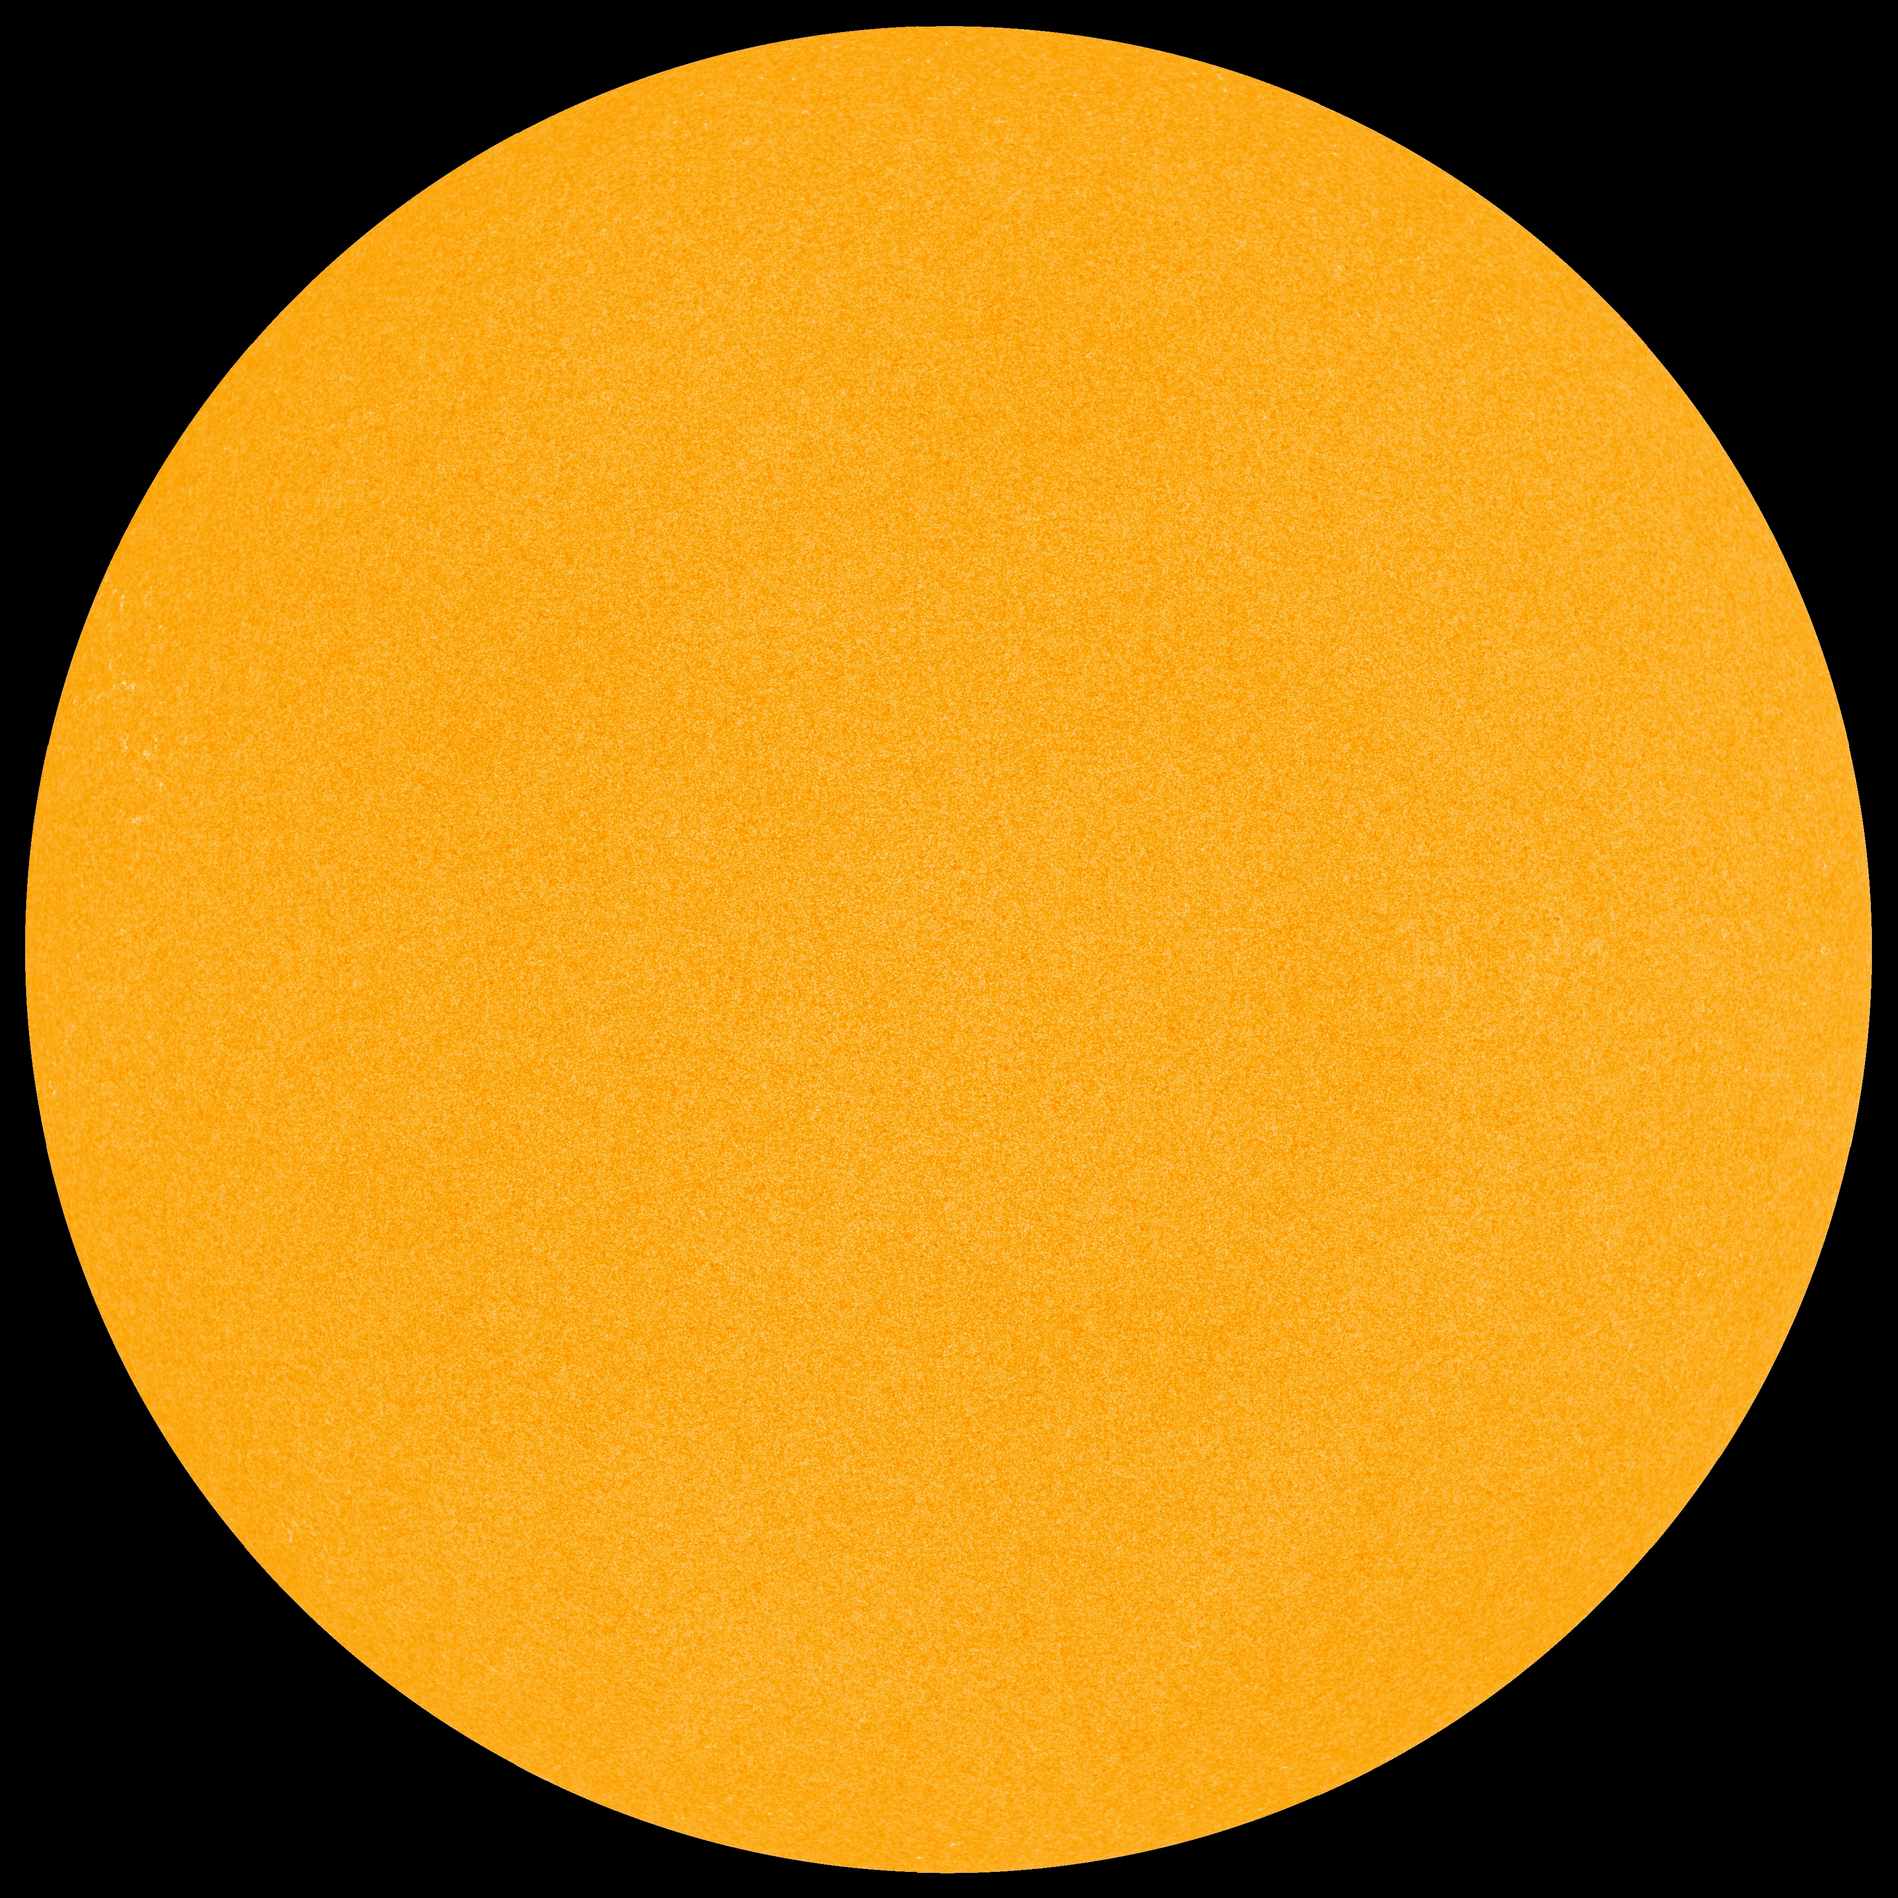
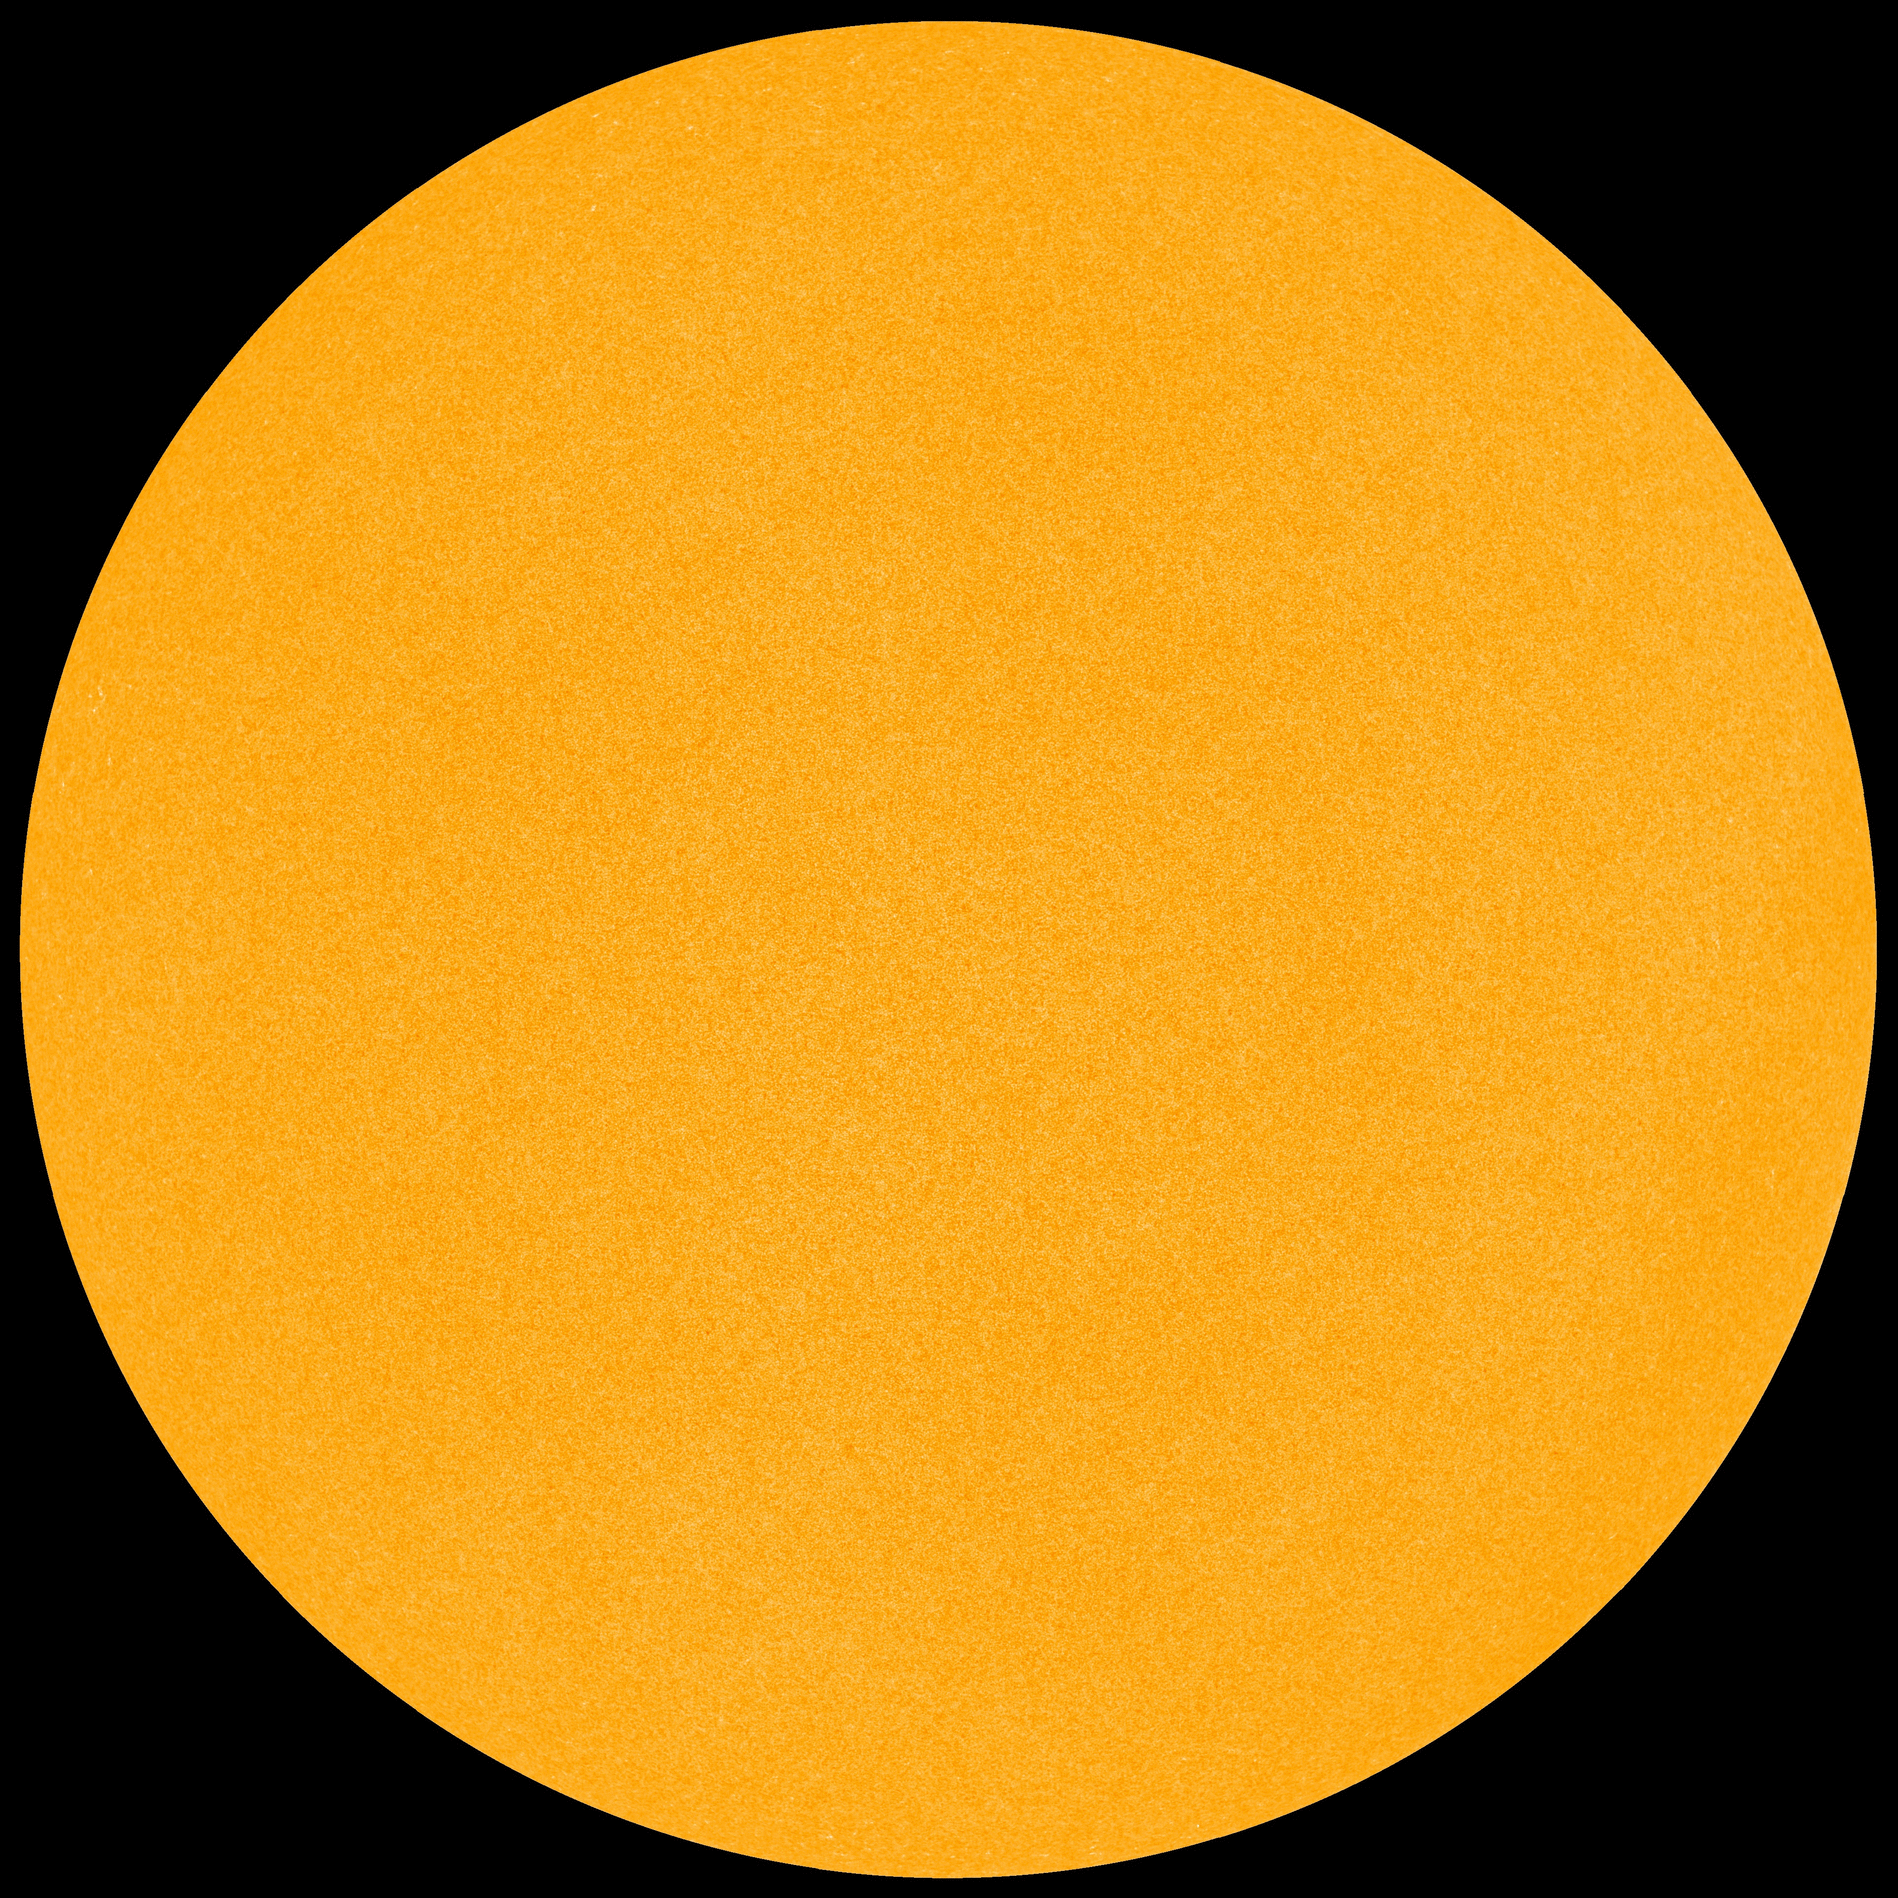
    10 consecutive days on the blink now -

    hmi1898.gif?PHPSESSID=53duehbibeq4k93im37rolpmb7

    From Spaceweather.com:

    SOLAR MINIMUM CONDITIONS ARE IN EFFECT: The sun has been without sunspots for 44 of the past 47 days. To find a similar stretch of blank suns, you have to go back to 2009 when the sun was experiencing the deepest solar minimum in a century. Solar minimum has returned, bringing extra cosmic rays, long-lasting holes in the sun's atmosphere, and strangely pink auroras.

    Will be interesting to see how this affects the winter, if at all...:p


  • Registered Users, Registered Users 2 Posts: 6,184 ✭✭✭Elmer Blooker


    ...... and some of the days when the sun is "active" is dubious in my opinion.
    I found this in the archives - July 22nd was a day when the sun was considered "active"? Sunspot 2716 is so tiny its invisible but it says current stretch: 0 days!
    http://www.spaceweather.com/archive.php?view=1&day=22&month=07&year=2018


  • Registered Users Posts: 1,985 ✭✭✭BLIZZARD7


    Another day blank and Solar flux is down to 68 from 70 yesterday, 132 days blank so far, should push easily above 200 by years end.


  • Posts: 31,118 ✭✭✭✭ [Deleted User]


    ...... and some of the days when the sun is "active" is dubious in my opinion.
    I found this in the archives - July 22nd was a day when the sun was considered "active"? Sunspot 2716 is so tiny its invisible but it says current stretch: 0 days!
    http://www.spaceweather.com/archive.php?view=1&day=22&month=07&year=2018
    Days like that would have certainly been marked as blank in the past.


  • Registered Users Posts: 1,985 ✭✭✭BLIZZARD7


    2 days blank on the sun again after a run of sunspots, talk of solar cycle 25 kicking in already? The latest spot or two seemed to have reverse polarity indicating this may be the case. Regardless, activity looks to be cooling off again. Sfu at 71.


  • Registered Users, Registered Users 2 Posts: 18,666 ✭✭✭✭silverharp


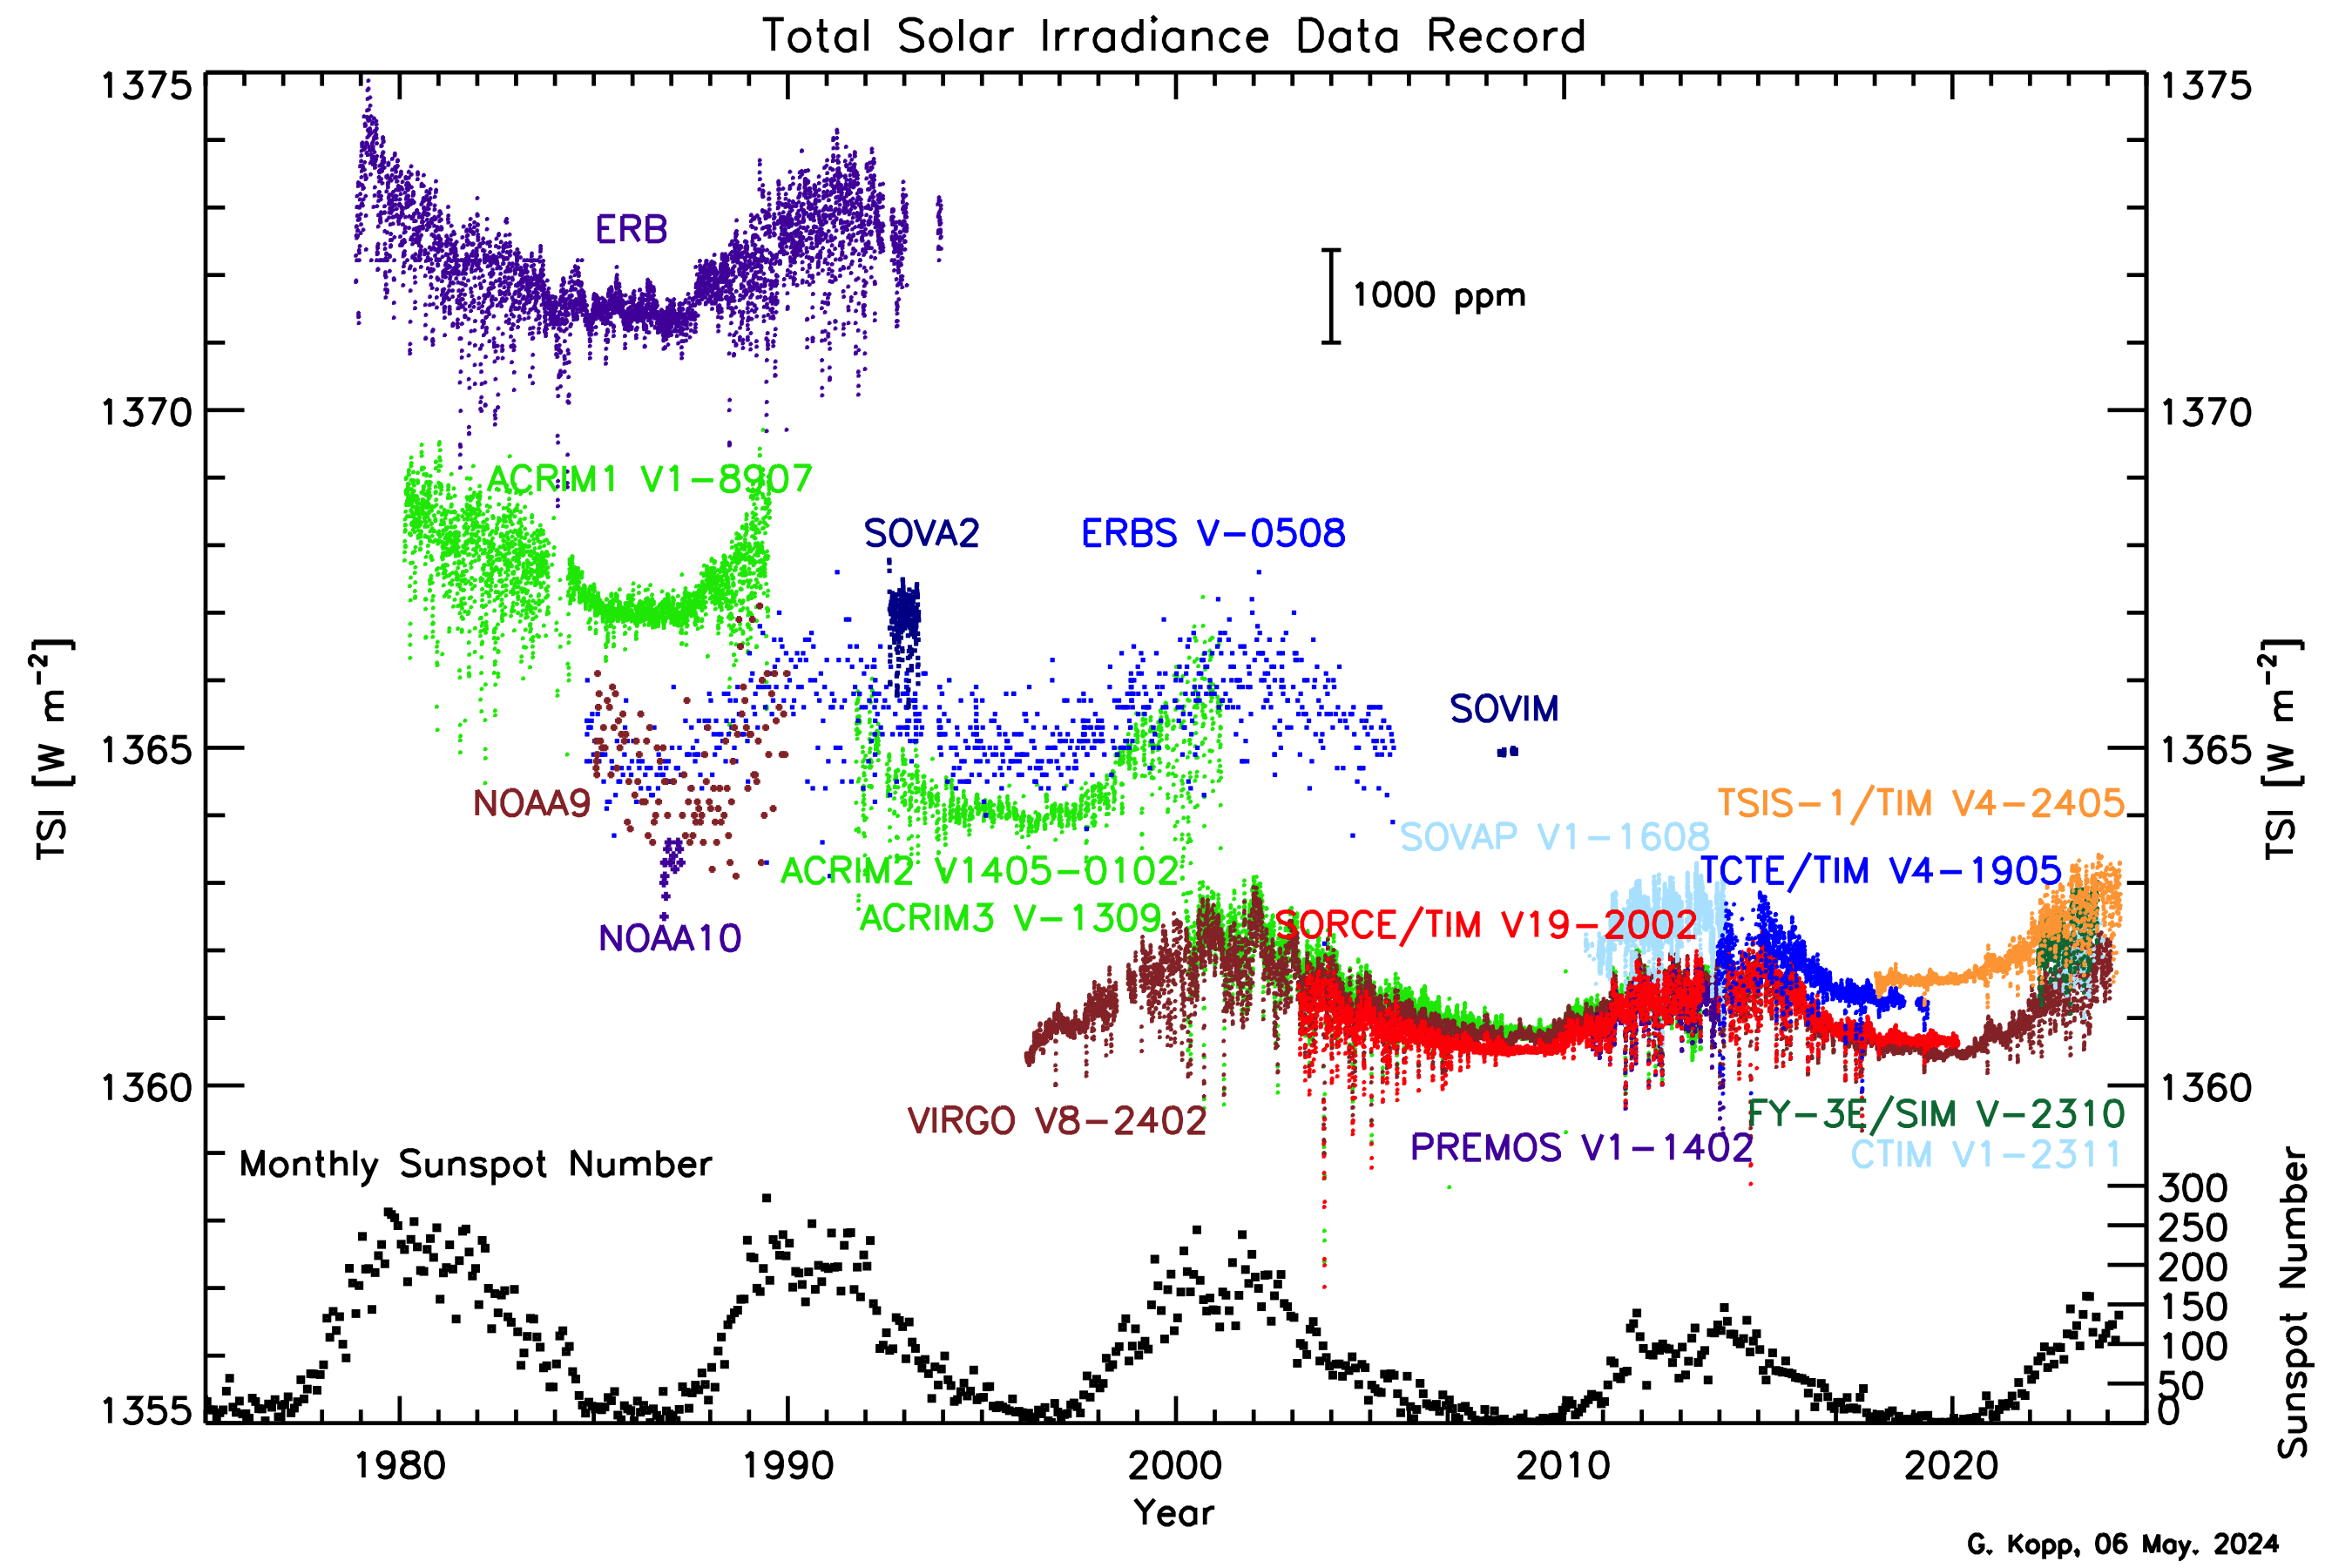
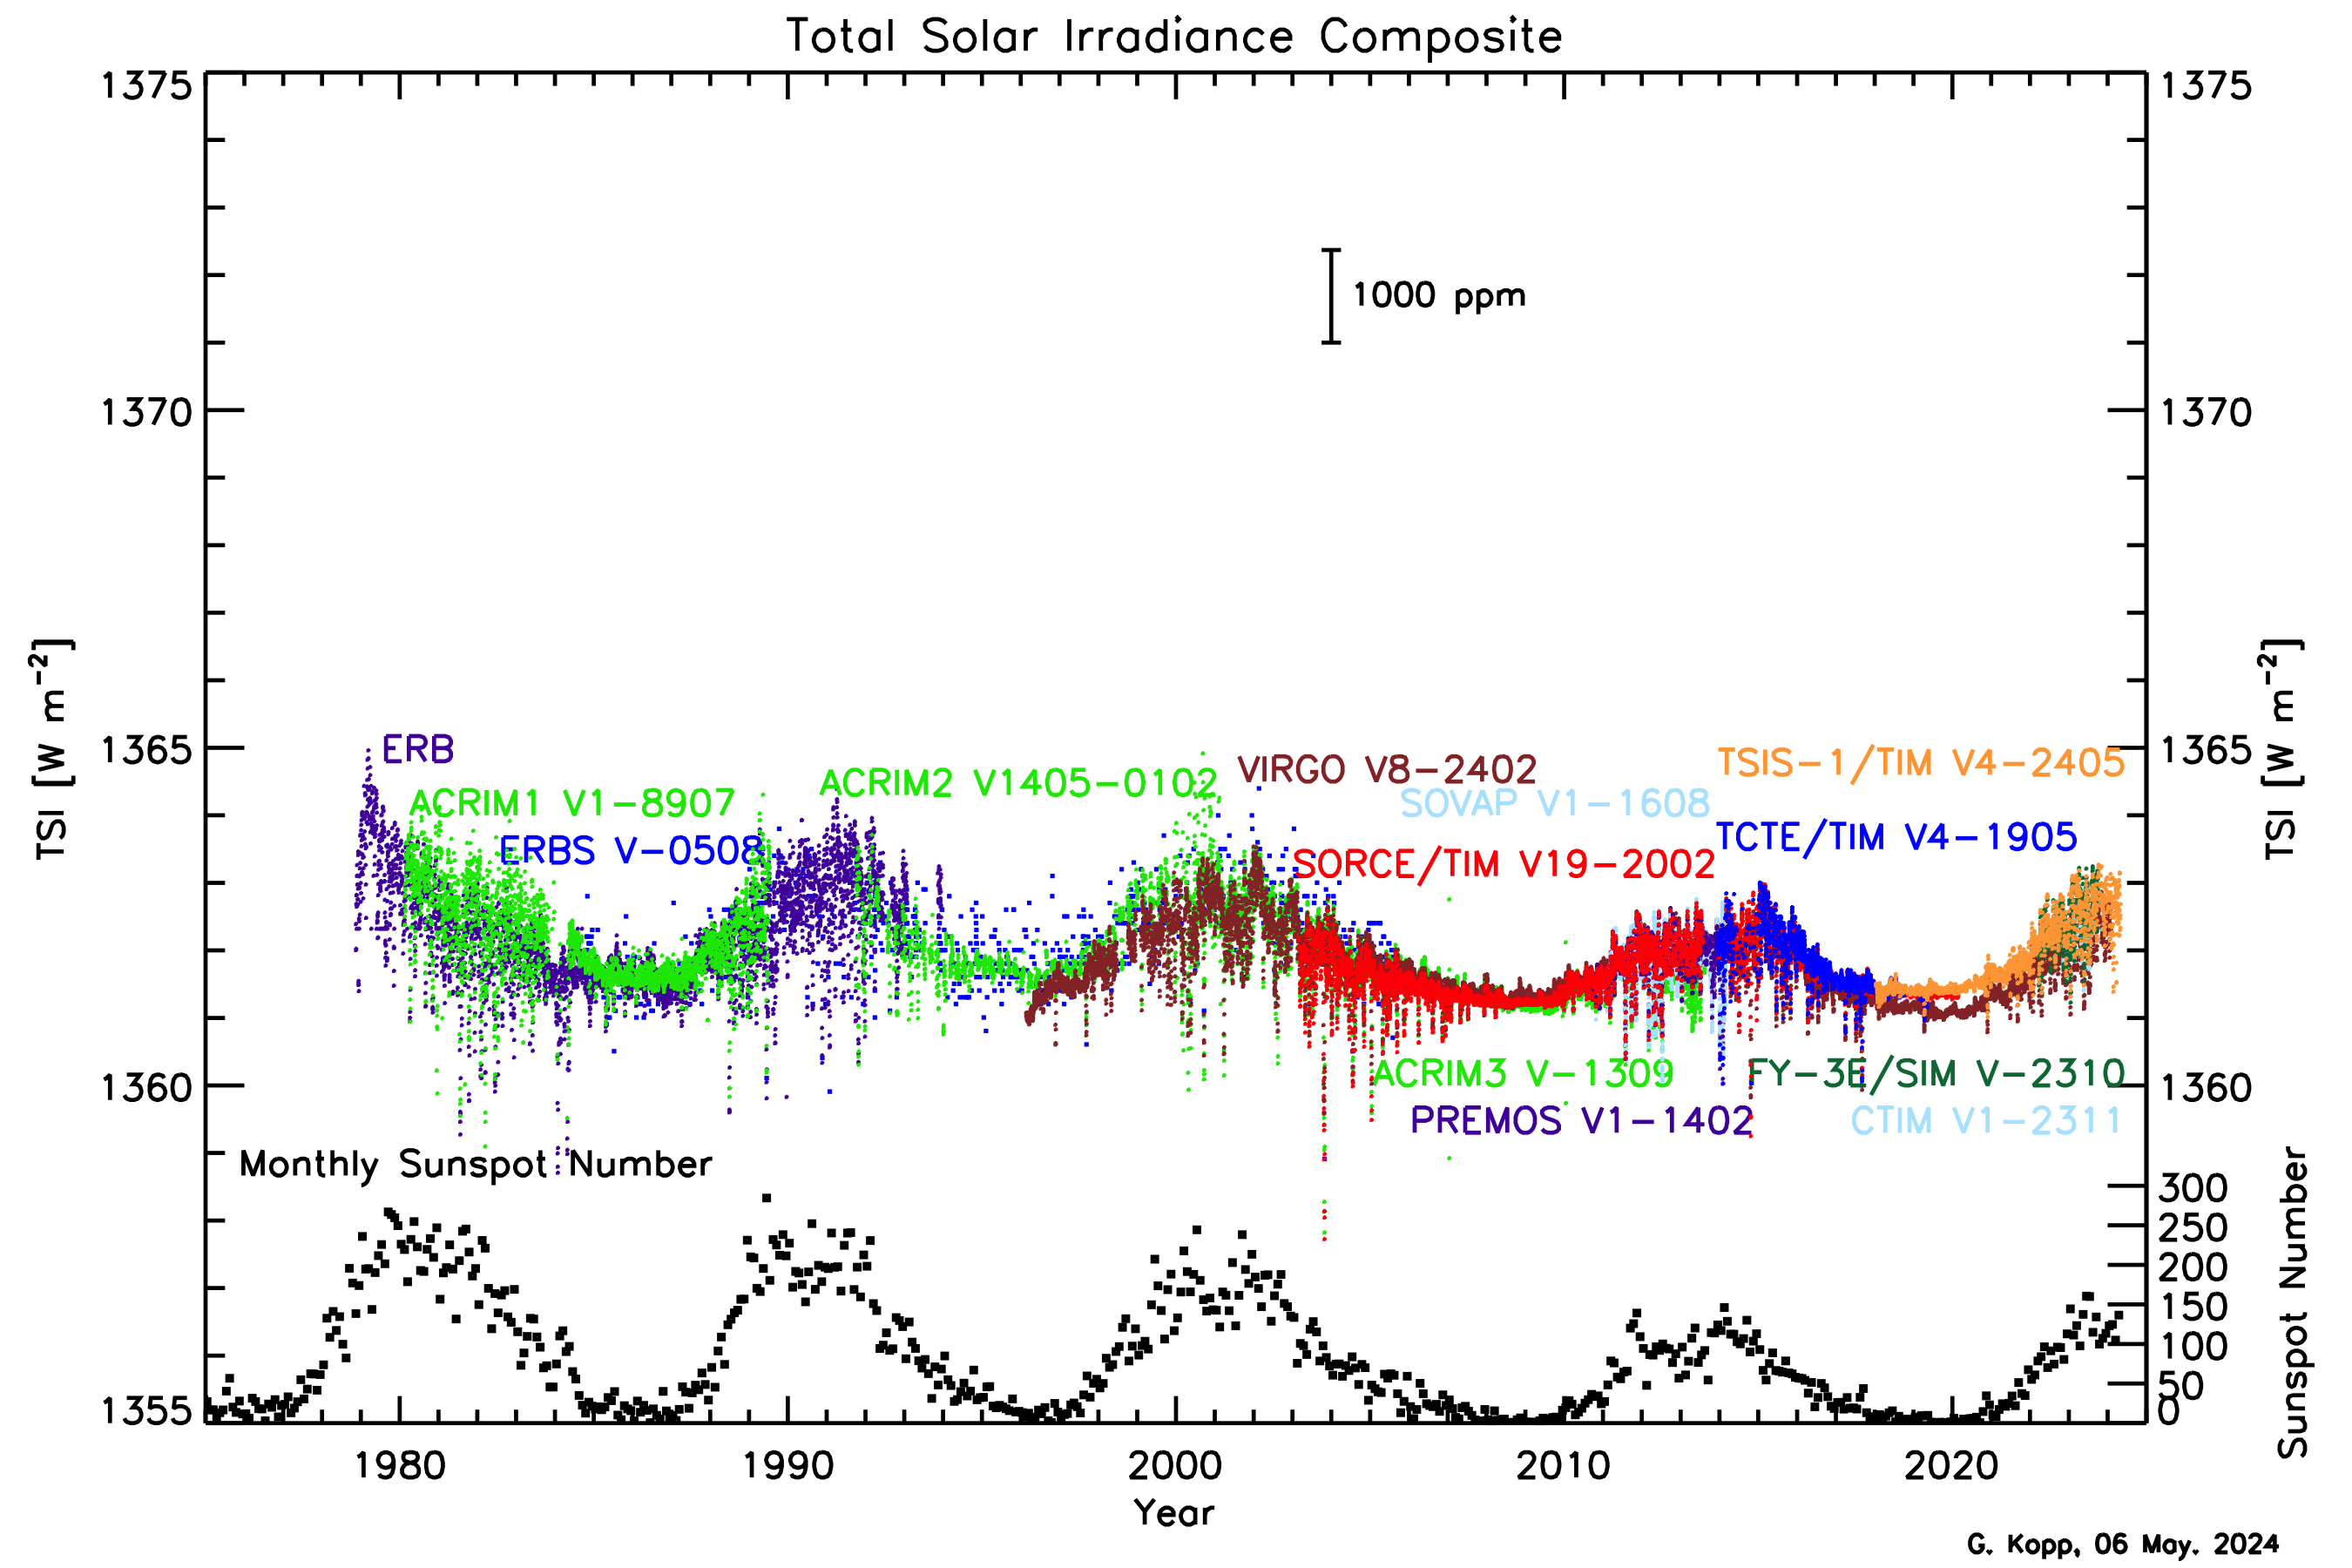
    how is solar output tracked in terms of what the earth receives in energy from the sun? is it showing any cycling in line with the sunspot cycles?

    A belief in gender identity involves a level of faith as there is nothing tangible to prove its existence which, as something divorced from the physical body, is similar to the idea of a soul. - Colette Colfer


  • Posts: 31,118 ✭✭✭✭ [Deleted User]


    silverharp wrote: »
    how is solar output tracked in terms of what the earth receives in energy from the sun? is it showing any cycling in line with the sunspot cycles?
    Some nice charts here.
    http://spot.colorado.edu/~koppg/TSI/index.html


    This one appears to have the TSI for the past few decades from a collection of instruments, without trying to correct errors between them.

    TSI.png

    Same chart with corrections to variance in instruments.
    TSI_Composite.png


  • Moderators, Society & Culture Moderators Posts: 1,719 Mod ✭✭✭✭star gazer


    4 days without a sunspot http://www.spaceweather.com/

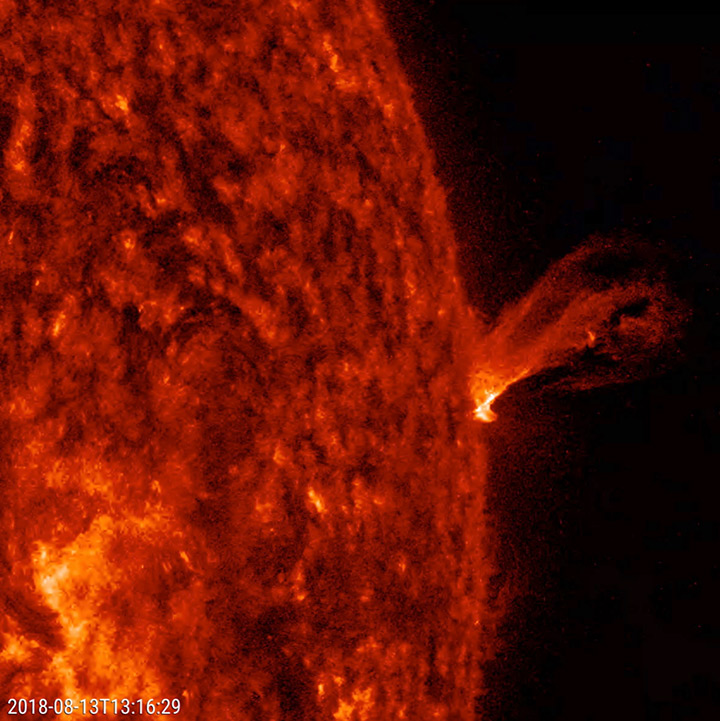
    Small eruption from the 13th of August.
    Small_prom_spin.jpg
    Solar Dynamics Observatory, nasa.

    The video of the two hours condensed:
    https://twitter.com/NASASun/status/1035907632286982144


  • Advertisement
  • Registered Users Posts: 1,985 ✭✭✭BLIZZARD7


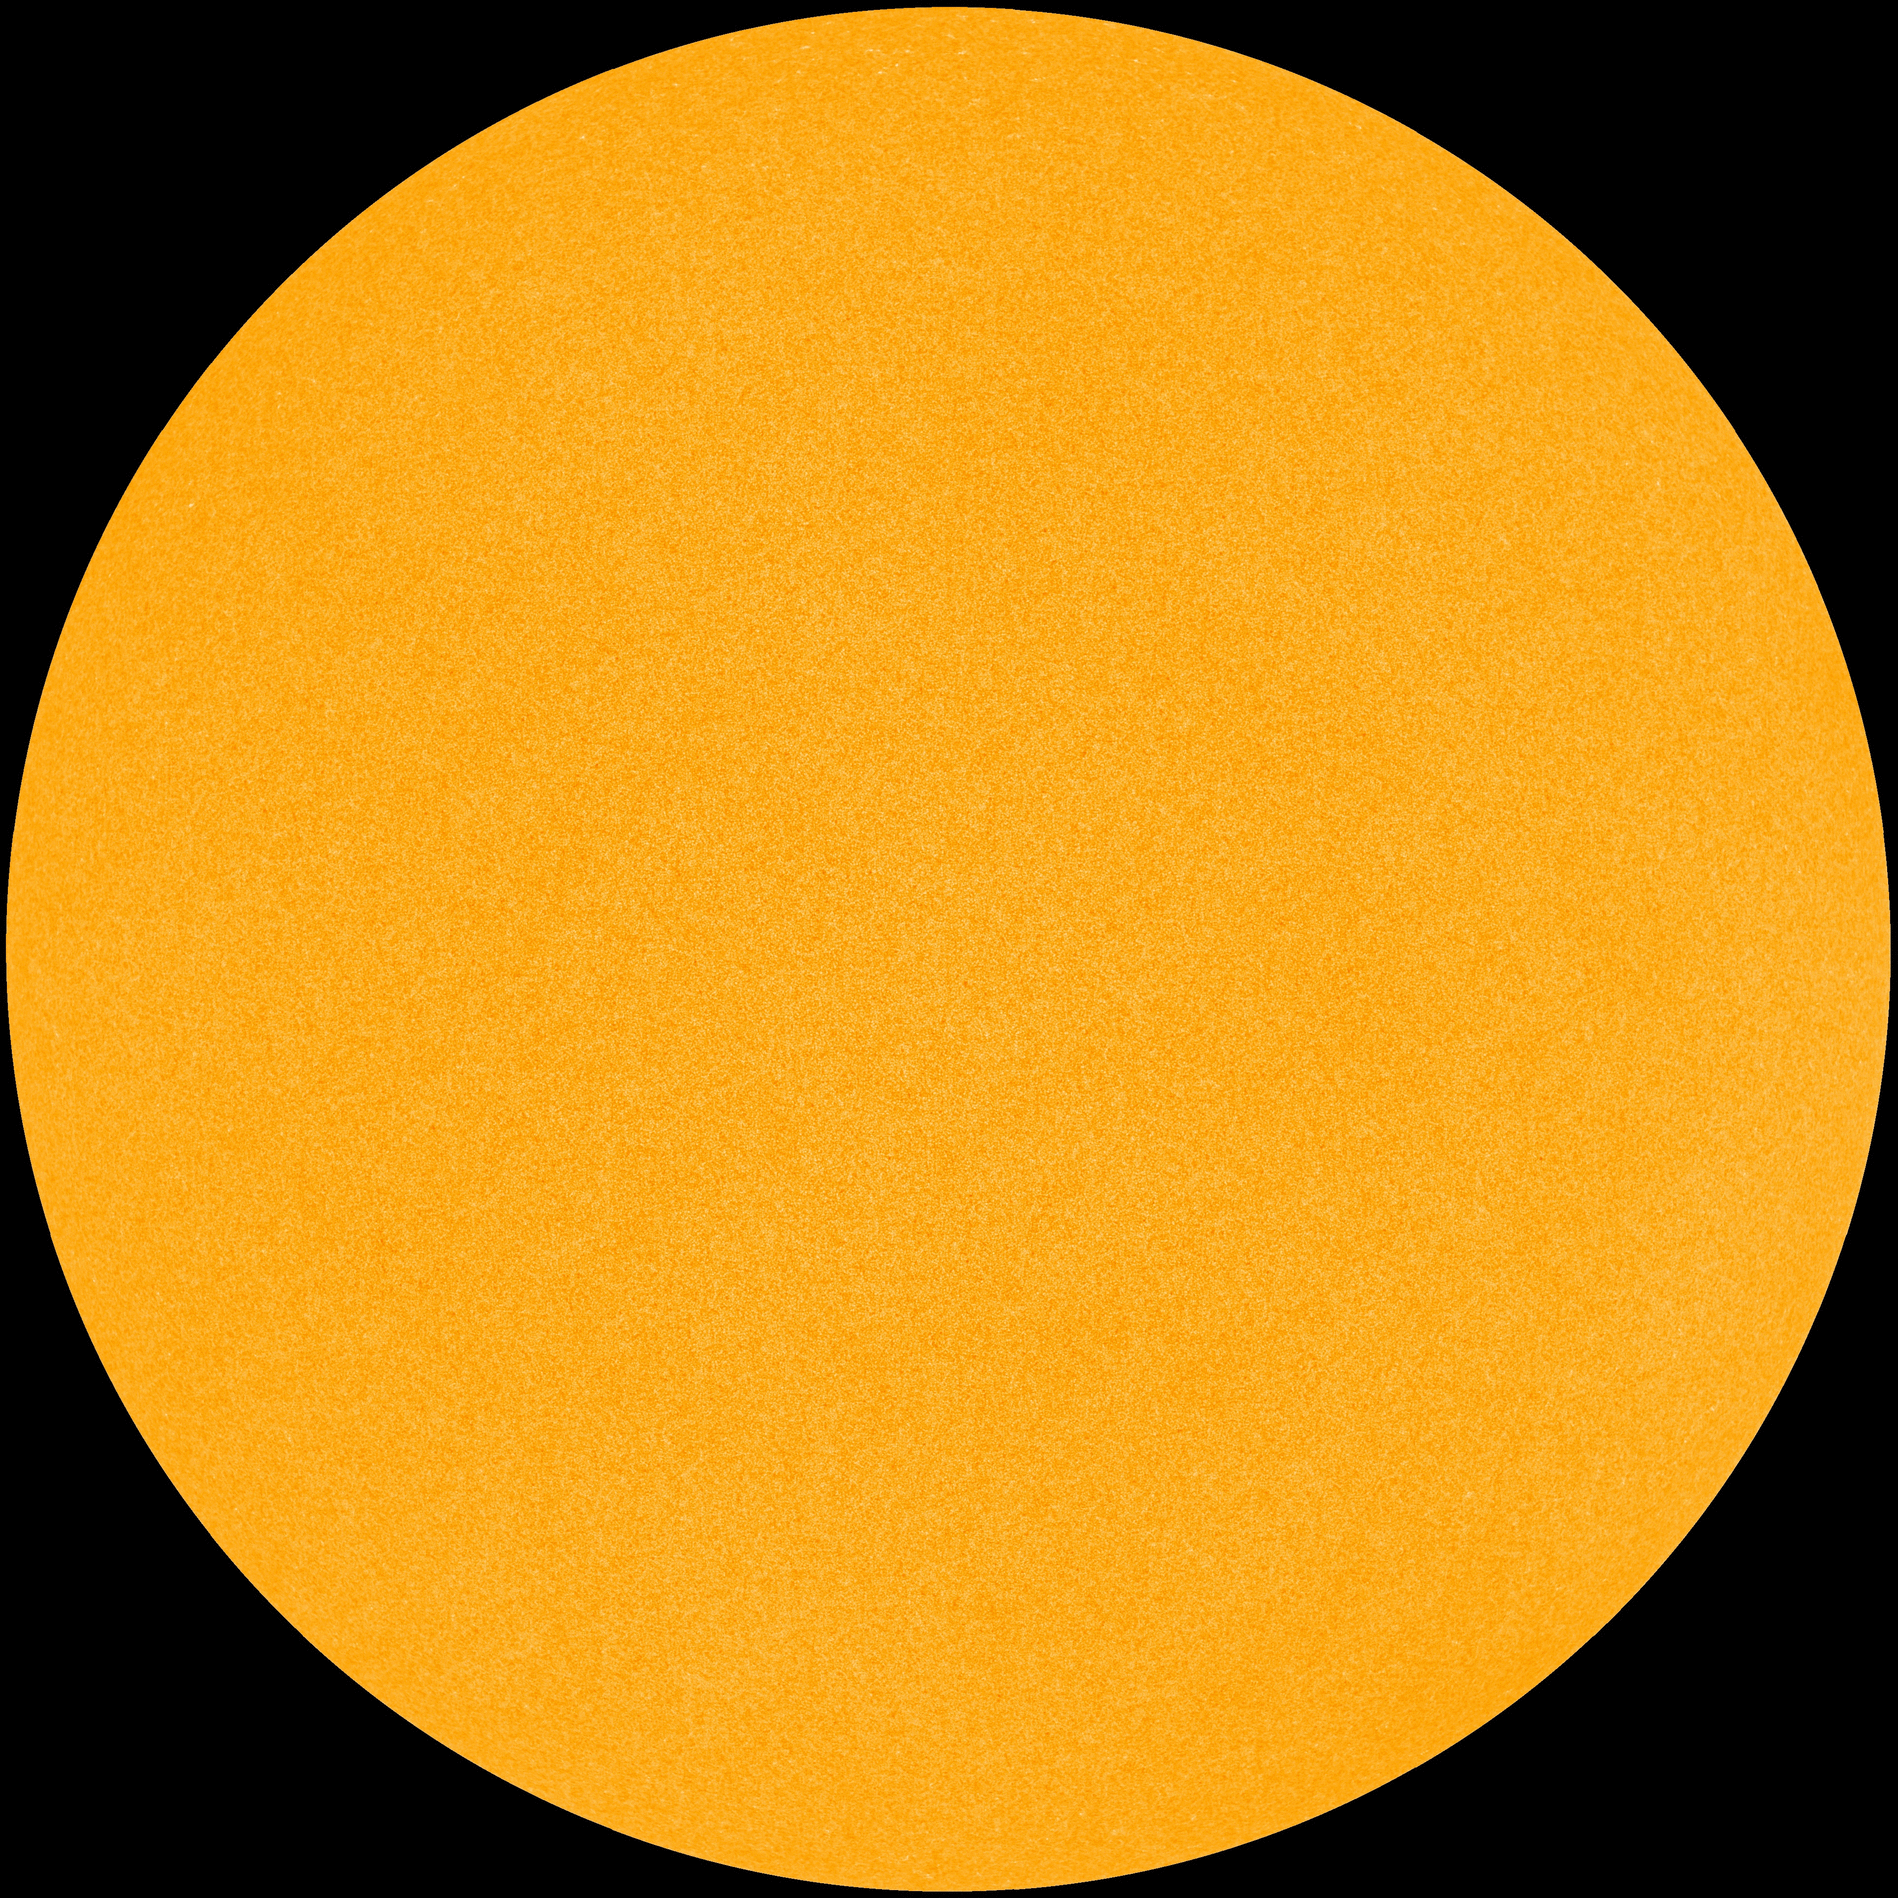
    10 days blank again now, SFU down to a nice 67.

    hmi1898.gif?PHPSESSID=kjohevkm4cqdfct0q3a3hpf8n5


  • Registered Users, Registered Users 2 Posts: 3,633 ✭✭✭Pa ElGrande


    Here is an article published 60 years ago this month about a theory of how Ice Ages get started.

    The Coming Ice Age (PDF version)

    September 1958
    This is the story of two scientists, who started five years ago — with a single radiocarbon clue from the ocean bottom and a wild hunch — to track down one of the earth’s great unsolved mysteries: What caused the ancient ice ages? Their search led over many continents and seas, to drowned rivers and abandoned mountain caves, into far-removed branches of science. It took them down through recorded history, from the stone tablets of primitive man to contemporary newspaper headlines.
    Maurice Ewing and the schooner Vema. Image from Neptune's Needle


    These two serious, careful scientists — geophysicist Maurice Ewing, director of Columbia University’s Lamont Geological Observatory, and geologist-meteorologist William Donn believe they have finally found the explanation for the giant glaciers, which four times during the past million years have advanced and retreated over the earth. If they are right, the world is now heading into another Ice Age. It will come not as sudden catastrophe, but as the inevitable culmination of a process that has already begun in northern oceans.

    As Ewing and Donn read the evidence, an Ice Age will result from a slow warming and rising of the ocean that is now taking place. They believe that this ocean flood — which may submerge large coastal areas of the eastern United States and western Europe — is going to melt the ice sheet which has covered the Arctic Ocean through all recorded history. Calculations based on the independent observations of other scientists indicate this melting could begin, within roughly one hundred years.

    It is this melting of Arctic ice which Ewing and Donn believe will set off another Ice Age on earth. They predict that it will cause great snows to fall in the north — perennial unmelting snows which the world has not seen since the last Ice Age thousands of years ago. These snows will make the Arctic glaciers grow again, until their towering height forces them forward. The advance south will be slow, but if it follows the route of previous ice ages, it will encase in ice large parts of North America and Europe. It would, of course, take many centuries for that wall of ice to reach New York and Chicago, London and Paris. But its coming is an inevitable consequence of the cycle which Ewing and Donn believe is now taking place.

    more


    More on Maurice Ewing

    More on Willliam L Donn

    Net Zero means we are paying for the destruction of our economy and society in pursuit of an unachievable and pointless policy.


  • Registered Users Posts: 52 ✭✭damino


    9 days without sunspots. 151 days spotless so far this year. A few days with sunspots were questionable.


  • Registered Users, Registered Users 2 Posts: 6,184 ✭✭✭Elmer Blooker


    damino wrote: »
    A few days with sunspots were questionable.
    Very questionable, the days when there was activity were described as either "barely visible" or "almost invisible" sunspots.
    still blank


  • Posts: 31,118 ✭✭✭✭ [Deleted User]


    https://spaceweatherarchive.com/2018/09/27/the-chill-of-solar-minimum/
    Sept. 27, 2018: The sun is entering one of the deepest Solar Minima of the Space Age. Sunspots have been absent for most of 2018, and the sun’s ultraviolet output has sharply dropped. New research shows that Earth’s upper atmosphere is responding.
    “We see a cooling trend,” says Martin Mlynczak of NASA’s Langley Research Center. “High above Earth’s surface, near the edge of space, our atmosphere is losing heat energy. If current trends continue, it could soon set a Space Age record for cold.”


    tci.png?w=676
    Look at the values in 2010, the year with two severe winters, could we see a repeat this year?


  • Posts: 31,118 ✭✭✭✭ [Deleted User]


    Interesting article providing evidence of a correlation between weak sunspot cycle and the jet stream causing drought in parts of Europe.
    https://www.dropbox.com/s/75mt4j1ekadg370/The%20Solar%20Cycle%20is%20responsible%20for%20extreme%20weather%20and%20Climate%20change.pdf?dl=0
    ABSTRACT

    Recent discovery of the relationship between the location of the North American Jet Stream and extreme weather is a breakthrough in the understanding of solar forced climate change

    .

    Five episodes of extreme weather over a periodof 282 years deduced from tree ring datashow meandering of the North Atlantic Jet stream.

    It is fair to say that the summers of 2017 and 2018 qualify as a sixth event because of world-wide extreme weather in the northern hemisphere and also globally, resulting in flooding, wildfires and drought on every temperate continent

    .

    The monsoon has truly gone global.

    The tree ring data is the only time series data available that determines the position of a jet stream.

    Moreover, tree ring extremes correspond to weak portions of the solar minimum of the sunspot cycle, a cycle that is a proxy for the magnetic shield of the sun.

    The so-called ‘Hunger Stones’ also mark notorious years of extreme drought in Central Europe. The emergence of the Hunger Stones and the tree ring data independently support each other and support a solar cycle climate hypothesis.

    These extreme weather events correspond (75%) to years of sunspot minima.

    Therefore, it is likely the extreme weather is a function of the solar cycle.

    Solar forcing is an important factor in causing extreme weather.

    It follows that the sun controls Earth’s climate.


  • Advertisement
  • Registered Users Posts: 1,985 ✭✭✭BLIZZARD7


    10 days blank again, SFU sitting at 69.

    hmi1898.gif?PHPSESSID=ratom8bdlarfrbbpdkumb437m1


  • Registered Users Posts: 700 ✭✭✭bazlers


    BLIZZARD7 wrote: »
    10 days blank again, SFU sitting at 69.

    hmi1898.gif?PHPSESSID=ratom8bdlarfrbbpdkumb437m1

    And now 11 days. Does the same apply for North America. In that have winters been colder in solar minimum? Going back to Dalton and even Mauder. I know statistics would not have been taken back Mauser times but has there been tree ring studies or even heard stories from generations of natives maybe? Or are we in the British isles more effected by a weaker jet stream than America?


  • Registered Users Posts: 33,752 ✭✭✭✭RobertKK


    Met Eireann in 2010 released a piece saying there is a correlation between a lack of sunspots and colder winters in North Western Europe.


  • Registered Users Posts: 1,985 ✭✭✭BLIZZARD7


    13 days blank, SFU down to 68. 179 blank days so far in 2018, We should easily hit the 200 days blank mark by end of December. The good old days are back...


  • Registered Users Posts: 1,985 ✭✭✭BLIZZARD7


    17 day's blank, 183 for 2018. Blank 60% of the time.

    Solar flux 68.


  • Advertisement
  • Registered Users Posts: 196 ✭✭A Shropshire Lad


    Redsunset wrote: »


    Are we approaching a mini iceage folks? history does have a habit of repeating itself.its definately bein colder of late.bring it on i say.here's some info on current state of our shining orb.all comments and thoughts welcome folks.
    THE SUN IS DEAD,SHOULD WE WARN OF APPROACHING MINI ICEAGE?

    Its just called winter dude


  • Registered Users, Registered Users 2 Posts: 3,633 ✭✭✭Pa ElGrande


    Professor Valentina Zharkova gave a presentation of her Climate and the Solar Magnetic Field hypothesis at the Global Warming Policy Foundation in October, 2018.

    Net Zero means we are paying for the destruction of our economy and society in pursuit of an unachievable and pointless policy.


  • Registered Users Posts: 1,985 ✭✭✭BLIZZARD7


    We've hit 20 consecutive Spotless Days now
    2018 total: 186 days (60%)

    Might hit 200 for the year before the end of November.

    SFU @ 69.


  • Registered Users Posts: 52 ✭✭damino


    187 spotless days so far. 21 consecutive spotless days. Could exceed 200 days by years end.


  • Registered Users Posts: 721 ✭✭✭Defaulter1831


    Its just called winter dude

    No dude it's not winter. We're still in autumn until December.

    Posters are commenting on the number of days with ho sun spots throughout 2018. It can be a pointer to a colder than average winter on the way.


  • Registered Users Posts: 700 ✭✭✭bazlers


    Not sure sure if this was posted before but is an excellent table of the mean sunspots numbers from 1700 to 2014. It also shows years of min and Max.

    http://www.sws.bom.gov.au/Educational/2/3/6


  • Registered Users, Registered Users 2 Posts: 9,510 ✭✭✭runawaybishop


    No dude it's not winter. We're still in autumn until December.

    Get away, November will always be the start of winter!


  • Registered Users Posts: 33,752 ✭✭✭✭RobertKK


    Get away, November will always be the start of winter!

    November is the last month of Autumn.

    This is backed up by meteorological data.


  • Registered Users Posts: 52 ✭✭damino


    23 consecutive spotless days. 189 spotless days so far for 2018.


  • Registered Users, Registered Users 2 Posts: 9,971 ✭✭✭spookwoman


  • Advertisement
  • Registered Users, Registered Users 2 Posts: 16,958 ✭✭✭✭nacho libre


    What were the number of spotless days back in 2010? Is this year looking like it will surpass that number?


  • Registered Users, Registered Users 2 Posts: 13,666 ✭✭✭✭sryanbruen


    What were the number of spotless days back in 2010? Is this year looking like it will surpass that number?

    51 spotless days, we have gone well over that mark since the Spring/early Summer.


  • Posts: 31,118 ✭✭✭✭ [Deleted User]


    What were the number of spotless days back in 2010? Is this year looking like it will surpass that number?
    2008 was the year with the least spots.


    spaceweather.com

    Spotless Days
    Current Stretch: 0 days
    2018 total: 190 days (61%)
    2017 total: 104 days (28%)
    2016 total: 32 days (9%)
    2015 total: 0 days (0%)
    2014 total: 1 day (<1%)
    2013 total: 0 days (0%)
    2012 total: 0 days (0%)
    2011 total: 2 days (<1%)
    2010 total: 51 days (14%)
    2009 total: 260 days (71%)
    2008 total: 268 days (73%)
    2007 total: 152 days (42%)
    2006 total: 70 days (19%)
    Updated 11 Nov 2018


  • Registered Users, Registered Users 2 Posts: 16,958 ✭✭✭✭nacho libre


    sryanbruen wrote: »
    51 spotless days, we have gone well over that mark since the Spring/early Summer.

    So what you're telling me is we will have 3 months of endless blocking this winter:D


  • Registered Users, Registered Users 2 Posts: 16,958 ✭✭✭✭nacho libre


    2008 was the year with the least spots.

    Interesting. If i'm not mistaken, the table you posted seems to suggest that sometimes, it's the following year after a large number of spotless days that ends up being notable wintry.


  • Posts: 31,118 ✭✭✭✭ [Deleted User]


    Interesting. If i'm not mistaken, the table you posted seems to suggest that sometimes, it's the following year after a large number of spotless days that ends up being notable wintry.
    I suppose that there is a delay between a reduction in solar activity and active weather, a bit like turning down the heat on an electric cooker.


  • Registered Users Posts: 1,525 ✭✭✭SeaBreezes


    https://watchers.news/2018/11/11/valentina-zharkova-solar-magnet-field-and-terrestrial-climate-presentation/?utm_source=dlvr.it&utm_medium=facebook

    Valentina zarkhov a solar physicist has predicted That we are going into a grand solar minimum beginning 2020 which will last three solar cycles for this one so only 30 (ish) years. She predicts severe weather, hot summers for northern hemisphere but intense cold winters with a shorter growing season. No summers for the Southern Hemisphere. She says, we will have food shortages by 2028. She has run the same equation over the past years and claims 97% accuracy. She says the sun moves in its own mini orbit and it will be furthest away from us when this happens. She explains this is not a linear graph but happens in oscillations each one getting more and more severe and ice not retreating. Interesting stuff!


  • Closed Accounts Posts: 1,997 ✭✭✭gally74


    SeaBreezes wrote: »

    Wow, lot more compelling with UK universities involved, Russian or Ukraine scientists are very impressive


  • Posts: 31,118 ✭✭✭✭ [Deleted User]


    Valentina-Zharkova-The-Solar-Magnet-Field-and-the-Terrestrial-Climate.jpg

    I just watched the entire video, very interesting that the mathematical theory can be mapped almost exactly to the recent historic data.
    We will probably find out within a decade whether this theory is correct ot not.


  • Advertisement
  • Closed Accounts Posts: 1,997 ✭✭✭gally74


    Valentina-Zharkova-The-Solar-Magnet-Field-and-the-Terrestrial-Climate.jpg

    I just watched the entire video, very interesting that the mathematical theory can be mapped almost exactly to the recent historic data.
    We will probably find out within a decade whether this theory is correct ot not.

    I'm not a scientist. Engineer by profession. But she does a real good job explaining the cycles etc. I never believe d the carbon story, but don't agree with carbon fuels. The cycles at is so interesting. Here's to alpine winters in 5 to 10 years time


  • Registered Users Posts: 1,525 ✭✭✭SeaBreezes


    She gives an interview here which I found easier to understand and made me edit my original post https://m.youtube.com/watch?v=_wB46mgJrzI
    this modern minimum to last from 2020 to 2055...


  • Posts: 31,118 ✭✭✭✭ [Deleted User]


    SeaBreezes wrote: »
    She gives an interview here which I found easier to understand and made me edit my original post https://m.youtube.com/watch?v=_wB46mgJrzI
    this modern minimum to last from 2020 to 2055...
    Please put the original back as it has all the graphics she used.
    Keep both videos.


  • Registered Users, Registered Users 2 Posts: 314 ✭✭NMB


    Please put the original back as it has all the graphics she used.
    Keep both videos.

    Thank you


  • Registered Users Posts: 1,525 ✭✭✭SeaBreezes


    Please put the original back as it has all the graphics she used.
    Keep both videos.

    Didn't remove anything. Just my summary. Also I see Pa Elgrande had posted the same video before me in the thread, apologies for posting it twice.

    I liked the summary of expected changes in this link(sorry no idea of the validity of science behind it)
    https://abruptearthchanges.com/2018/01/14/climate-change-grand-solar-minimum-and-cosmic-rays/

    And was surprised by the fact the spotless years take 10 years to affect earth weather mentioned here (again not a scientific paper)
    http://joannenova.com.au/2011/05/the-brutal-cold-of-the-maunder-minimum-and-the-great-irish-frost/


  • Registered Users, Registered Users 2 Posts: 14,584 ✭✭✭✭M.T. Cranium


    It has to be kept in mind that the long-term solar downturns have a large impact on temperatures over decades but trying to use them to pinpoint year to year differences is not any sort of guarantee, there's no particular reason why 2018-19 should be the grand occasion for cold rather than last winter or next winter.

    The Dalton minimum lasted from about the mid-1790s to the mid-1830s. During that time (and well into the 1840s) there were numerous cold winters but between them some average or even mildish ones.

    Even the absolutely spotless Maunder (roughly 1670 to 1710) had the occasional mild winter.

    The averages for 30-year periods in the Dalton and Maunder were 2 degrees lower than what was considered normal half a century ago before the AGW further rise took place. But the range remained about 10 degrees from coldest to warmest, so the variability overlaps the normal range we have now, in those colder periods.

    This winter is full of promise for cold though, the Atlantic is already dying a slow death and it's not even winter yet.


  • Advertisement
  • Registered Users Posts: 700 ✭✭✭bazlers


    Interesting stuff. We have had the Maunder and Dalton minimum. If this is the start of a new minimum will it have a name?


  • Registered Users, Registered Users 2 Posts: 14,584 ✭✭✭✭M.T. Cranium


    I think some are referring to it as the Gleissberg minimum or some similar name, after the researcher who first proposed that it might be coming along (or second proposed it, seems to me that I heard about it somewhere back in the early 90s from some guy who knew a guy).

    By the way, it's not really "if" but how long at this point, we are already into a fairly pronounced downturn with this last cycle being the weakest since the 1905 maximum, and 2001 not being as strong as most of the seven or eight before it.

    There was another minimum in the latter half of the 15th century according to Schove, and it's known as the Sporer minimum.

    Before that, the records are less dramatic but two or three weak cycles in a row seems to happen about every century or so.


  • Registered Users Posts: 700 ✭✭✭bazlers


    Very good. I thought there were still debating on it. Maybe its affect on climate is what the real debating is about.


  • Registered Users Posts: 700 ✭✭✭bazlers


    Back to a spotless sun for the past 3 days.


  • Registered Users, Registered Users 2 Posts: 3,633 ✭✭✭Pa ElGrande


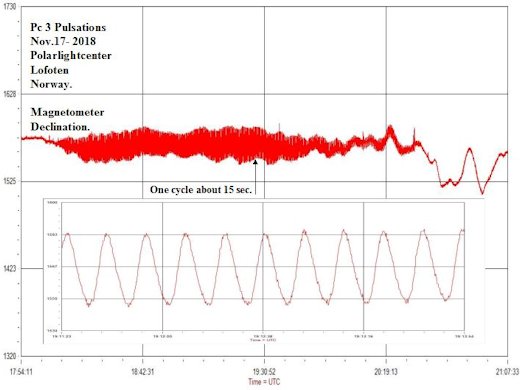
    A RARE WAVE IN EARTH'S MAGNETIC FIELD
    When a stream of solar wind hits Earth, magnetometers around the Arctic Circle normally go haywire, their needles swinging chaotically as local magnetic fields react to the buffeting of the solar wind. On Nov. 18th, however, something quite different happened. Solar wind hit Earth and produced ... a pure, almost-musical sine wave:

    pc3_strip.png


    source

    Net Zero means we are paying for the destruction of our economy and society in pursuit of an unachievable and pointless policy.


  • Advertisement
Advertisement