Advertisement
If you have a new account but are having problems posting or verifying your account, please email us on hello@boards.ie for help. Thanks :)
Hello all! Please ensure that you are posting a new thread or question in the appropriate forum. The Feedback forum is overwhelmed with questions that are having to be moved elsewhere. If you need help to verify your account contact hello@boards.ie

The sun is dead!! Mini iceage???

Options
17810121332

Comments

  • Registered Users Posts: 14,331 ✭✭✭✭M.T. Cranium


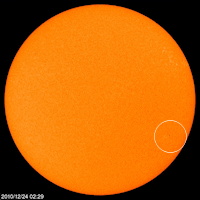
    Sun watchers are noting today the formation of a large dark ring (in relative terms) that connects two active sunspot zones in both hemispheres, bearing in mind that overall activity is still rather low -- and watching this area for flares or even a CME event before it rotates around to the limb in five days time. The size of this ring is about half the diameter of the Sun and is not far from being centrally located at this time. In about three days it would (if intact) start to intersect with the east limb so that its western extreme would be near the Sun's central point. (this just to give you an idea how it's proceeding, I have no idea if it's going to let loose or just dissipate harmlessly).


  • Closed Accounts Posts: 2,693 ✭✭✭Redsunset


    Thanks M.T,

    Looking through my list of sun filters,this is the best i can find to illustrate what your saying.
    I think this is what your referring to.

    131489.JPG


    Also i haven't post this graph up before but it really shows how quiet the sun has been.

    131490.JPG


  • Posts: 0 [Deleted User]


    That's one grumpy looking sun! ;)


  • Registered Users Posts: 14,331 ✭✭✭✭M.T. Cranium


    I was reading a thread on another weather forum (easternuswx.com) that had some references to this ring formation. Not sure if it would amount to much but there was a more perfectly formed ring earlier than I see now at this site:

    http://sohowww.nascom.nasa.gov/

    by the way that's a good site to bookmark for up-to-date solar imagery. Perhaps it has been referenced on this thread already.


  • Registered Users Posts: 347 ✭✭desolate sun


    I don't know if this link is of any benefit to any of the experts here but I found it interesting.

    http://www.skepticalscience.com/heading-into-new-little-ice-age-intermediate.htm

    BTW It DOESN'T think we will be heading into an Ice Age


  • Advertisement
  • Closed Accounts Posts: 2,693 ✭✭✭Redsunset


    Effect of solar activity


    A substantial portion of the climate variability in the Atlantic sector is associated with the North Atlantic Oscillation (NAO), with variations occurring on a wide range of scales. The influence of solar activity (expressed by various indices) on the NAO has been studied by a number of authors. Having reviewed the information available to him, Lamb (1972, p. 252) noticed several tendencies in the surface parameters in relation to solar activity. These tendencies included:
    • Strong development of the mid-latitude westerlies, Icelandic low and Azores high around the middle of the declining phase of solar activity;
    • Strong meridional and cellular circulation systems at some stage during the more rapid rises of solar disturbance and greatest frequency of very strong anomalies of pressure and temperature (intense systems);
    • Also (perhaps later) during the ascent, a phase of strong middle latitudes westerlies, strong Icelandic low and Azores high, seems particularly liable to occur.
    More recently, Bucha and Bucha (1998) found a correlation between geomagnetic activity and sea level pressure variations similar to the NAO for the period 1970 to 1996. They suggested a mechanism based on winds generated in the polar thermosphere following geomagnetic storms.

    Bochnicek and Hejda (2005) demonstrated that during the winter periods (January–March) of the years 1963–2001 high geomagnetic activity was nearly always associated with a positive phase of the NAO, whereas low geomagnetic activity tended to couple with the negative phase. Palamara and Bryant (2004) and Fujita and Tanaka (2007) found a similar relationship with the Northern Annular Mode (NAM). According to Thejll et al. (2003), who studied the relationship between the geomagnetic index Ap and the NAO for the period 1949-2000, the correlation was high and significant only since about 1972.

    Ap.gif

    However, for the period 1949–1972 no significant correlations were found at the surface while significant correlations still existed in the stratosphere. This might indicate that the solar forcing, primarily acting in the stratosphere, is propagating its influence downward in the later period but not in the earlier.

    A robust relationship between solar cycle variations, proxied by the 10.7 cm solar radio flux, and the NAM has been found by Ruzmaikin and Feynman (2002). In particular, the NAM index was found to be systematically more negative (corresponding to a weaker polar jet) during low solar activity (Ruzmaikin et al., 2004).
    f10.gif

    Kodera (2002, 2003) showed that the spatial structure of the NAO varies significantly according to the phase of the solar cycle. During solar maximum phases, the NAO covers the Northern Hemisphere and extends into the stratosphere, which is similar to the Arctic Oscillation (AO) (Thompson and Wallace, 1998), except for the Pacific sector. By contrast, for minimum solar phases, the NAO is confined to the Atlantic sector and to the troposphere.

    Boberg and Lundstedt (2002, 2003) showed that variations of the NAO index could be correlated with the electric field strength of the solar wind. Using geopotential height data they found a strong correlation between the electric field strength of the solar wind and pressure variations in the stratosphere and troposphere. For the tropospheric pressure the influence is confined to the North Atlantic and resembles the action of the NAO.

    On a secular time scale, Kirov and Georgieva (2002) found a negative correlation between the NAO index and sunspot activity: the index had a maximum during the period of low solar activity in the late 19th and early 20th century and a minimum during the period of high solar activity in the 1950s and 1960s.

    However, since the data covers only one secular cycle, their conclusion is not statistically sound. In their later work, addressing the issue of instability in solar terrestrial relationships, Georgieva et al. (2007) underscored the importance of asymmetry between sunspot numbers in the northern and southern solar hemispheres.

    They hypothesize that when the southern solar hemisphere is more active, increasing solar activity in the secular solar cycle leads to strengthening of the zonal atmospheric circulation, and when the northern solar hemisphere is more active, increasing solar activity in the secular solar cycle leads to weakening of the zonal circulation.

    There are also a number of works that have examined the effect of solar activity on climatic variables other than the NAO (but often closely related to the NAO). Here, for brevity, we will mention just one of those works, because it underscores the importance of the 22-year Hale cycle, which manifests itself in reversal of polarity of sunspots from one 11-year cycle to another.

    According to Bochkov (1978), during even cycles of solar activity and on its ascending branch, the Barents Sea is characterized by suppressed cyclonic activity, negative anomalies of sea and air temperature and increased ice cover. In contrast, during the decreasing branch of solar activity (2-5 years after its maximum), the Barents Sea tends to be warmer than normal. The situation during the odd cycles of solar activity is less clear.
    NAO_sm.png

    Fig. 1. The winter (DJF) NAO index from CPC, 1951-2008.

    Despite the complexity of solar effect on North Atlantic climate, most of the authors seem to agree that negative (positive) NAO phases tend to occur during low (high) levels of solar activity. This simplified relationship refers to both the 11-year and secular solar cycles.
    Currently, the solar activity is at the beginning of its 24th cycle. Also, it seems to be on a declining phase of the secular cycle, but still remains relatively high. The behaviour of the NAO ([URL="file:///C:/Documents%20and%20Settings/Sergei/My%20Documents/ClimateLogic/WebSite/pub/STTA/NAO.png"]Fig. 1[/URL]) and AO ([URL="file:///C:/Documents%20and%20Settings/Sergei/My%20Documents/ClimateLogic/WebSite/pub/STTA/AO.png"]Fig. 2[/URL]) indices in recent decades seem to be consistent with the above relationship: both indices reached their maximum values in the early 1990s and now tend to stay close to their average values.

    AO_sm.png

    Fig. 2. The winter (DJF) AO index from CPC, 1951-2008.

    As the 24th solar cycle progresses, entering into its ascending phase, one can expect a weakening of the subpolar low and developing of a meridional type of atmospheric circulation, with an increasing frequency of the negative NAO.

    Closer to the maximum of solar activity, and on the descending branch of the cycle, zonal atmospheric circulation (positive NAO) may become prevalent again.

    Much will depend on whether the 24th cycle will be weak or strong. If it is going to be a weak cycle (which is somewhat more likely), the NAO may become strongly negative, resulting in a substantial cooling in the Northeast Atlantic, Norwegian and Barents Seas.


  • Registered Users Posts: 6,935 ✭✭✭SuprSi


    redsunset wrote: »
    131489.JPG

    That's an amazing photo. I'd love to get one like this formatted for my desktop - do you know anywhere that would have some?


  • Posts: 0 [Deleted User]


    SuprSi wrote: »
    That's an amazing photo. I'd love to get one like this formatted for my desktop - do you know anywhere that would have some?

    Just right click on it and save as background.


  • Registered Users Posts: 6,935 ✭✭✭SuprSi


    Just right click on it and save as background.

    Yeah it's the wrong size and looks wonky when I do it that way. I'm being fussy but I'd like get a widescreen one if possible.


  • Posts: 0 [Deleted User]


    SuprSi wrote: »
    Yeah it's the wrong size and looks wonky when I do it that way. I'm being fussy but I'd like get a widescreen one if possible.

    Google and your favorite image editor is the way to go. ;)


  • Advertisement
  • Posts: 0 [Deleted User]


    sunspot.gif

    Still quiet, not sure if the predicted path is following the number of sunspots recorded or the other way round.

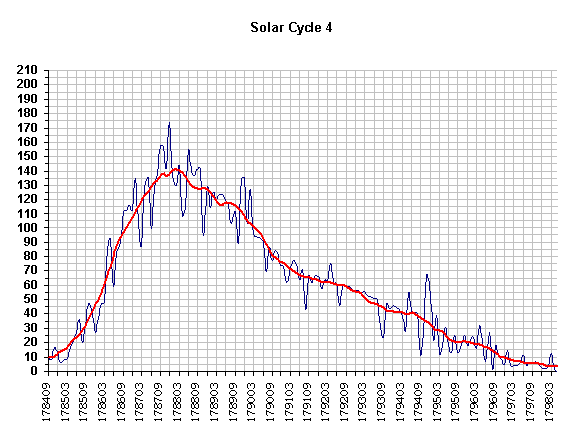
    Compared with cycle 4 & 5

    http://www.solen.info/solar/cycl4.html

    cycl4.gif
    cycl5.gif
    http://www.solen.info/solar/cycl5.html

    Time to bump this page, we still seem to be following a "Dalton minimum" type of trend. Also worth noting that so far this winter appears to be emulating those of the mini ice age.


  • Closed Accounts Posts: 2,693 ✭✭✭Redsunset


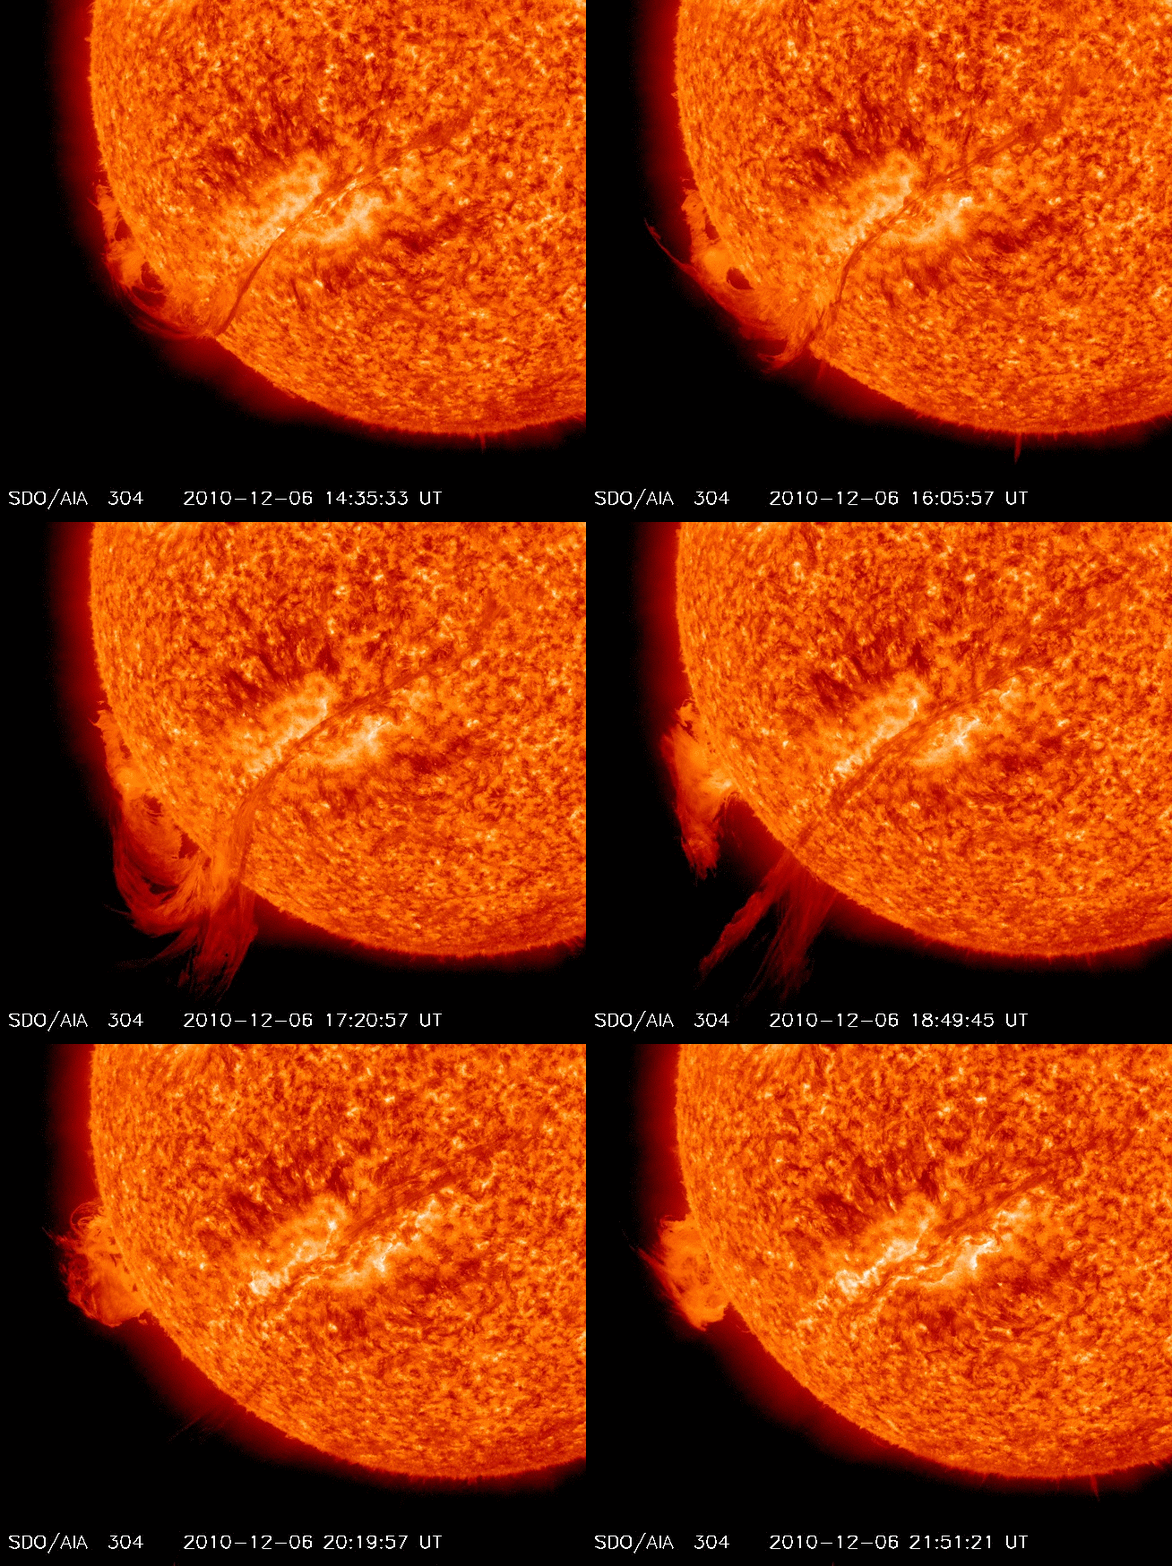
    a "mega-filament" of solar magnetism erupted on Dec. 6th, producing a blast of epic proportions. NASA's Solar Dynamics Observatory recorded the action as the 700,000-km long structure lifted off the stellar surface and--snap!!--hurled itself into space.
    http://spaceweather.com/


    epicblast2.gif?PHPSESSID=o0m695geks2d1uc79fcpjjtd60


    pmapN.gif

    The statistical pattern depicting the auroral oval is appropriate to the auroral activity level determined from the power flux observed during the most recent polar satellite pass. The power fluxes in the statistical pattern are color coded on a scale from 0 to 10 ergs .cm-2.sec-1 according to the color bar on the right.


    f10.gif

    Still no major jump in activity


  • Closed Accounts Posts: 5,234 ✭✭✭thetonynator


    The predicted values starting to get contradicted by the actual values . . .could change of course!!!


  • Closed Accounts Posts: 2,693 ✭✭✭Redsunset


    The predicted values starting to get contradicted by the actual values . . .could change of course!!!


    Oh of course ,sure there always changing that to suit when the actual refuses to marry


  • Posts: 0 [Deleted User]


    Anyone know where to get a map of the extents of the monsoons?
    Thinking being that if the negative NAO is caused by a weakened sun then the monsoon wont extend as far north in June/July and as far south in December/January.

    The alternative view is that its caused by global warming etc - for this to be true the north pole high pressures would need to cover a smaller area and the sea ice would not be recovering.

    The monsoon is directly driven by the sun.


  • Closed Accounts Posts: 1,997 ✭✭✭gally74


    http://dld.bz/Apvx

    Good read .....


  • Posts: 0 [Deleted User]


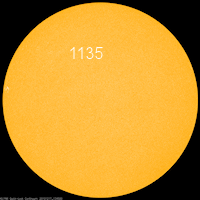
    Spotless again. well almost!

    hmi200.gif


  • Closed Accounts Posts: 2,693 ✭✭✭Redsunset


    Indeed,well Mr wolf would not have been able to see this in the past as technology would not allow so in my view its spotless.


    18 Dec 10


    Sunspot 1135 is so small, it can only be seen in a very high-resolution image


    I really believe that this period of low solar activity is having an influence on our winter seasons.Its not the only factor but really needs to be recognised more.It not all about trade winds and the like.


  • Posts: 0 [Deleted User]


    redsunset wrote: »
    It not all about trade winds and the like.

    The monsoon is the one thing on earth most directly driven by the sun....the inter tropical convergence zone is all weather - its not climate. Where north and south of it you have continental and maritime influences that delay changes to climate do to changes in solar output the tropical low is directly driven by the sun. I think its a key to proving or disproving whether the north atlantic oscillation turns negative due to a decrease in solar activity such as sunspots.

    We need to know more about things like:

    How low the tropical low is relative to other years
    How high it reaches into the atmosphere this year compared with other years

    We already know the jet stream is placed differently than normal - a tell tale sign I believe.

    Here is some tangentially relevant reading:
    http://en.wikipedia.org/wiki/Sudden_stratospheric_warmings
    http://en.wikipedia.org/wiki/QBO

    and for those new to this
    http://en.wikipedia.org/wiki/ITCZ

    Another thing to note is the gulf stream - surface oceanic currents are driven by winds......the south westerly low pressures drive the warmer waters our way...turn the wind easterly up here and the gulf stream will loop back around Portugal. This happened during the little ice age.

    So the shift south of the gulf stream is a result not cause of the little ice age. Its all very interesting and i thought I`d throw all this into the thread :)


  • Closed Accounts Posts: 5,234 ✭✭✭thetonynator


    redsunset wrote: »
    Indeed,well Mr wolf would not have been able to see this in the past as technology would not allow so in my view its spotless.


    18 Dec 10


    Sunspot 1135 is so small, it can only be seen in a very high-resolution image


    I really believe that this period of low solar activity is having an influence on our winter seasons.Its not the only factor but really needs to be recognised more.It not all about trade winds and the like.


    It's not really a very accurate system of measurement, if newer technology is being used to see sunspots that wouldn't have been recorded before. Does anyone have stats for sunspot numbers using older measurements?


  • Advertisement
  • Posts: 0 [Deleted User]


    Yes, it can sometimes be difficult to correctly line up the chain of events leading to a change in climatic conditions, the only thing that should be without doubt at this stage what to put at the very front of this chain, namely the changes in the suns magnetic activity.

    Edit: from Galleys74's link above. http://www.landscheidt.info/?q=node/189
    A Massive Winter Heading for the Northern Hemisphere?
    Posted Sun, 07/25/2010 - 01:25 by Geoff Sharp

    PART 1

    The winters of the past two years have been noticeably colder. The northern hemisphere in particular has experienced record cold, record snow and a rebuilding of the Arctic sea ice extent. The southern hemisphere this winter has also seen record low temperatures in South America which is resulting in many hundreds of deaths (human and livestock).

    There are a number of players involved which can be attributed to this cooling trend and when they come together they are capable of dropping the world's temperatures by a significant amount.

    with an update,
    PART 3.

    December 16 2010: All indicators forecast last July are on track. The La Nina is shaping up to be one of the deepest on record, the PDO continues its negative phase, and the AO is in strong negative territory with NOAA predicting a further strong decline. The NAO is also strongly negative and the predicted masses of south flowing polar air is already occurring. This has translated to low northern hemisphere temperatures not seen since the Little Ice Age. The NAO will determine the rest of winter which I think will remain negative, but there is also a chance that blocking highs will remain even if the NAO reverses as we have seen in the southern hemisphere recently.

    edit:

    now spotless
    Sunspot number: 0
    What is the sunspot number?
    Updated 18 Dec 2010

    Spotless Days
    Current Stretch: 1 day
    2010 total: 46 days (13%)
    2009 total: 260 days (71%)
    Since 2004: 813 days
    Typical Solar Min: 486 days
    Updated 18 Dec 2010


  • Posts: 0 [Deleted User]


    http://www.telegraph.co.uk/news/worldnews/australiaandthepacific/australia/8213932/Wintry-weather-brings-snow-to-Australia-in-midsummer.html
    Freezing winds from Antarctica, blown up to Australia by a low-pressure system in the Southern Ocean, gave the country a taste of the conditions that are causing havoc across Europe.

    Some 11 inches of snow fell at the ski fields in New South Wales, raising the prospect that parts of the country could experience a white Christmas.

    Very unusual for Australia during summer!!!! Sometimes they dont even get snow in the winter season!


  • Banned (with Prison Access) Posts: 337 ✭✭Sacred_git


    http://www.telegraph.co.uk/news/worldnews/australiaandthepacific/australia/8213932/Wintry-weather-brings-snow-to-Australia-in-midsummer.html


    Very unusual for Australia during summer!!!! Sometimes they dont even get snow in the winter season!

    lol, its started i tell yiz, suppose id pick the cold rather than burn alive etc. so be it!


  • Posts: 0 [Deleted User]


    http://www.sciencemag.org/content/294/5549/2149.abstract

    Solar Forcing of Regional Climate Change During the Maunder Minimum
    We examine the climate response to solar irradiance changes between the late 17th-century Maunder Minimum and the late 18th century. Global average temperature changes are small (about 0.3° to 0.4°C) in both a climate model and empirical reconstructions. However, regional temperature changes are quite large. In the model, these occur primarily through a forced shift toward the low index state of the Arctic Oscillation/North Atlantic Oscillation as solar irradiance decreases. This leads to colder temperatures over the Northern Hemisphere continents, especially in winter (1° to 2°C), in agreement with historical records and proxy data for surface temperatures.

    http://science.nasa.gov/science-news/science-at-nasa/2009/01apr_deepsolarminimum/
    "For the first time in history, we're getting to see what a deep solar minimum is really like."
    "We're experiencing a very deep solar minimum," says solar physicist Dean Pesnell of the Goddard Space Flight Center.

    "This is the quietest sun we've seen in almost a century," agrees sunspot
    expert David Hathaway of the Marshall Space Flight Center.
    The current solar minimum is part of that pattern. In fact, it's right on time. "We're due for a bit of quiet—and here it is," says Pesnell.

    We should have been paying more attention to this thread and the NASA scientists and prepared better for this.....looks like we could have this for a few years

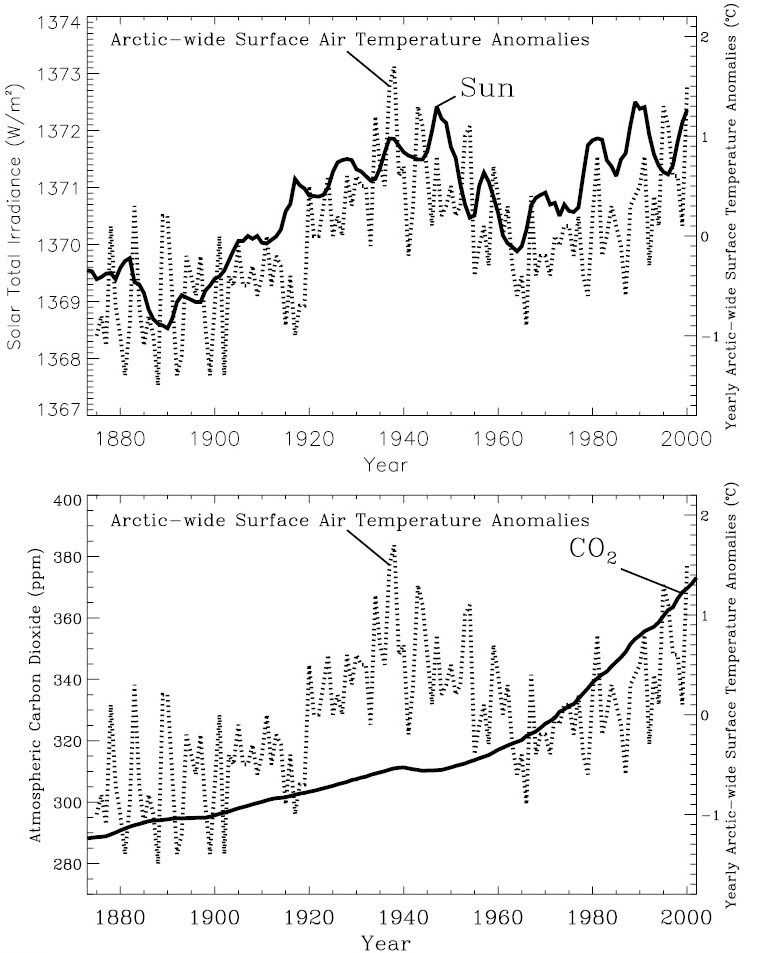
    and pardon me but the increase in solar activity matches the rise in temps since the 1850s supposedly due to CO2
    http://upload.wikimedia.org/wikipedia/commons/5/5c/Carbon14_with_activity_labels.svg

    There are other papers to back this up:

    https://www.cfa.harvard.edu/~wsoon/myownPapers-d/Soon05-SolarArcticTempGRLfinal.pdf

    SolarIrradiance.jpg


  • Posts: 0 [Deleted User]


    Still quiet up there!

    I think they have the number wrong though, that's a very small spot?

    mdi200.gif
    Sunspot number: 28
    What is the sunspot number?
    Updated 25 Dec 2010

    Spotless Days
    Current Stretch: 7 days
    2010 total: 51 days (14%)
    2009 total: 260 days (71%)
    Since 2004: 819 days
    Typical Solar Min: 486 days
    Updated 25 Dec 2010


  • Closed Accounts Posts: 2,693 ✭✭✭Redsunset


    A Dalton type minimum is still shaping up

    Refreshing the memories
    Posting link again from 2009

    http://www.davidarchibald.info/papers/Archibald2009E&E.pdf

    And now
    Updated graphs from David Archibald.


    [IMG]http://solarcycle25.com/attachments/ftp/Archi 1.jpg[/IMG]


    Figure 1: Solar Polar Magnetic Field Strength

    The Sun’s current low level of activity starts from the low level of solar polar magnetic field strength at the 23/24 minimum. This was half the level at the previous minimum, and Solar Cycle 24 is expected to be just under half the amplitude of Solar Cycle 23.


    [IMG]http://solarcycle25.com/attachments/ftp/Archi 2.jpg[/IMG]


    Figure 2: Heliospheric Current Sheet Tilt Angle

    It is said that solar minimum isn’t reached until the heliospheric current sheet tilt angle has flattened. While the month of minimum for the 23/24 transition is considered to be December 2008, the heliospheric current sheet didn’t flatten until June 2009


    [IMG]http://solarcycle25.com/attachments/ftp/Archi 3.jpg[/IMG]


    Figure 3: Interplanetary Magnetic Field

    The Interplanetary Magnetic Field remains very weak. It is almost back to the levels reached in previous solar minima.


    [IMG]http://solarcycle25.com/attachments/ftp/Archi 4.jpg[/IMG]


    Figure 4: Ap Index 1932 – 2010

    The Ap Index remains under the levels of previous solar minima.


    [IMG]http://solarcycle25.com/attachments/ftp/Archi 5.jpg[/IMG]


    Figure 5: F10.7 Flux 1948 – 2010

    The F10.7 Flux is a more accurate indicator of solar activity than the sunspot number. It remains low.


    [IMG]http://solarcycle25.com/attachments/ftp/Archi 6.jpg[/IMG]


    Figure 6: F10.7 Flux aligned on solar minima

    In this figure, the F10.7 flux of the last six solar minima are aligned on the month of minimum, with the two years of decline to the minimum and three years of subsequent rise. The Solar Cycle 24 trajectory is much lower and flatter than the rises of the five previous cycles.


    [IMG]http://solarcycle25.com/attachments/ftp/Archi 7.jpg[/IMG]


    Figure 7: Oulu Neutron Count 1964 – 210

    A weaker interplanetary magnetic field means more cosmic rays reach the inner planets of the solar system. The neutron count was higher this minimum than in the previous record. Thanks to the correlation between the F10.7 Flux and the neutron count in Figure 8 following, we now have a target for the Oulu neutron count at Solar Cycle 24 maximum in late 2014 of 6,150.


    [IMG]http://solarcycle25.com/attachments/ftp/Archi 8.jpg[/IMG]


    Figure 8: Oulu Neutron Flux plotted against lagged F10.7 flux

    Neutron count tends to peak one year after solar minimum. Figure 8 was created by plotting Oulu neutron count against the F10.7 flux lagged by one year. The relationship demonstrated by this graph indicates that the most likely value for the Oulu neutron count at the Solar Cycle 24 maximum expected to be a F10.7 flux value of 100 in late 2014 will be 6,150.


    [IMG]http://solarcycle25.com/attachments/ftp/Archi 9.jpg[/IMG]


    Figure 9: Solar Cycle 24 compared to Solar Cycle 5

    I predicted in a paper published in March 2006 that Solar Cycles 24 and 25 would repeat the experience of the Dalton Minimum. With two years of Solar Cycle 24 data in hand, the trajectory established is repeating the rise of Solar Cycle 5, the first half of the Dalton Minimum. The prediction is confirmed. Like Solar Cycles 5 and 6, Solar Cycle 24 is expected to be 12 years long. Solar maximum will be in late 2014/early 2015.


    [IMG]http://solarcycle25.com/attachments/ftp/Archi 10.jpg[/IMG]


    Figure 10: North America Snow Cover Ex-Greenland

    The northern hemisphere is experiencing its fourth consecutive cold winter. The current winter is one of the coldest for a hundred years or more. For cold winters to provide positive feedback, snow cover has to survive from one winter to the next so that snow’s higher albedo relative to bare rock will reflect sunlight into space, causing cooler summers. The month of snow cover minimum is most often August, sometimes July. We have to wait another eight months to find out how this winter went in terms of retained snow cover.

    The 1970s cooling period had much higher snow cover minima than the last thirty years. Despite the last few cold winters, there was no increase in the snow cover minima. The snow cover minimum may have to get to over two million square kilometres before it starts having a significant effect.

    David Archibald

    December 2010


  • Registered Users Posts: 3,087 ✭✭✭Duiske


    NASA have again revised downwards their predition for sunspot maxima during solar cycle 24. The following animation shows the revisions from March 2004 to January 2011. Interesting times. http://solarscience.msfc.nasa.gov/predict.shtml

    ssn_predict_nasa_1024.gif
    Animation credit - J Gary Fox @WUWT


  • Registered Users Posts: 2,781 ✭✭✭amen


    redsunset where can I get the raw data for your graphs?


  • Closed Accounts Posts: 2,693 ✭✭✭Redsunset


    Hope these links help.There's loads of stuff in them for everybody.Happy clicking.Loads more info in side bars.I'll post more when i get a chance as im up to my eyes lately. Love that animation Duiske,cheers.

    http://cosmicrays.oulu.fi/ Oulu Neutron Monitor

    http://sidc.oma.be/sunspot-data/dailyssn.php

    http://sidc.oma.be/LatestSWData/LatestSWData.php

    http://www.swpc.noaa.gov/Data/index.html

    http://www.swpc.noaa.gov/ftpdir/weekly/RecentIndices.txt

    http://www.swpc.noaa.gov/ftpmenu/indices/old_indices.html

    http://solarscience.msfc.nasa.gov/greenwch.shtml


    Meanwhile,Here a vid of a prominence from a couple days ago courtasy of http://spaceweather.com/

    rainstop.gif?PHPSESSID=qoaicrmu4c4v6l9sfcg574gpf2


  • Advertisement
  • Registered Users Posts: 925 ✭✭✭wildefalcon


    Redsunset,

    Thank you for posting the information compiled by Mr Archibald. I've read it and I think I understand most of it, but not all. I read about sunspots back in the 1970's and understood that the cycle affects our climate, but that's about it.

    Do you mind if I ask a couple of questions, to confirm my understanding?

    Please note, I'm not trying to pick holes in what you have posted, I'm too ignorant to be able to do that, for the moment!

    First off,

    What is the AP index? How does it interact/correlate to the solar cycle?

    The Oulu Neutron Count is a count of the number of neutrons hitting the earth, right? I presume that the weaker magnetic field of the sun allows more neutrons to escape its gravity. Is this right?

    If there are more neutrons hitting the planet (including atmosphere) does that mean that our magnetic field is boosted? Meaning that less radiation hits the surface of the earth?

    I'm trying to remember the mechanism that causes the interaction, but can't.

    What I'm trying to grasp is the strength of evidence supporting the forecast of a solar minimum, and how it co-relates to the data around the mini-ice age.

    And what impact it will have on global warming/climate change.

    Thank you for your post.


Advertisement