Advertisement
Help Keep Boards Alive. Support us by going ad free today. See here: https://subscriptions.boards.ie/.
https://www.boards.ie/group/1878-subscribers-forum

Private Group for paid up members of Boards.ie. Join the club.
Hi all, please see this major site announcement: https://www.boards.ie/discussion/2058427594/boards-ie-2026

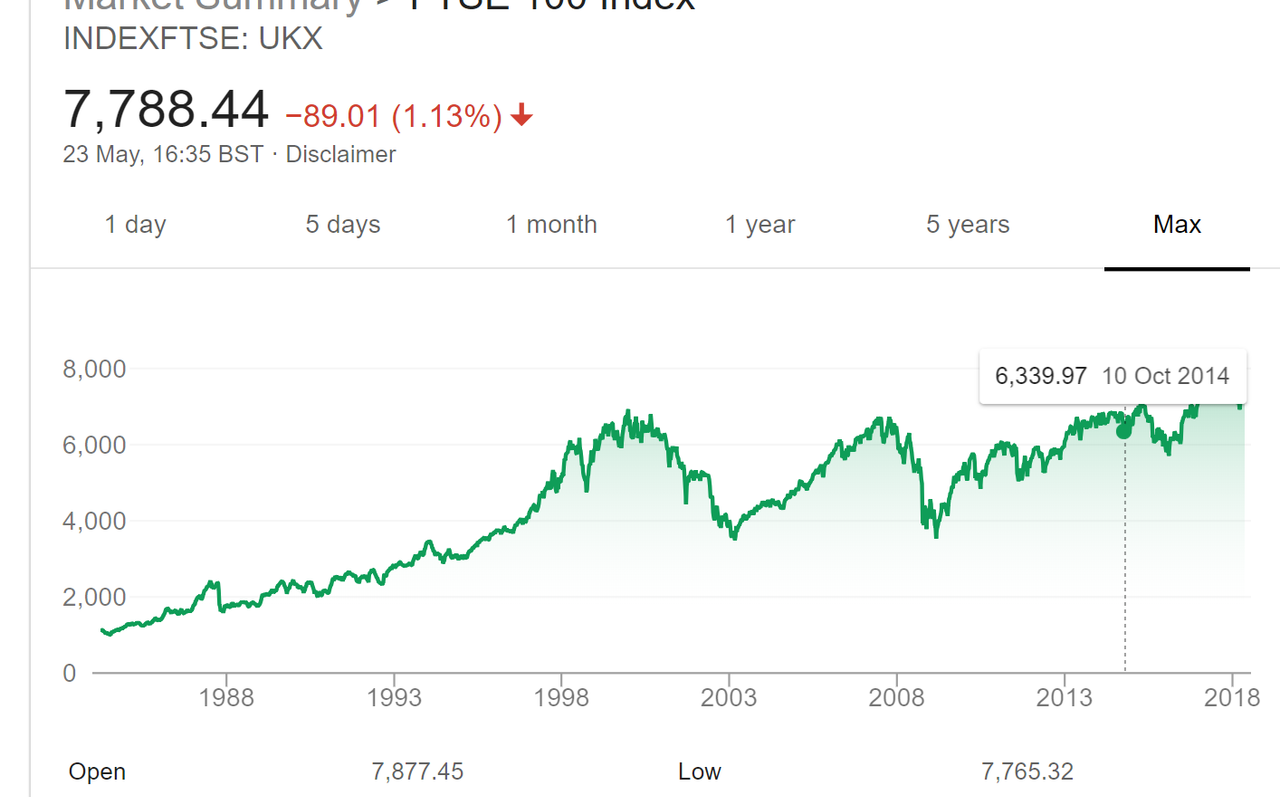
How can you interpret this FTSE100 chart since 1988?

  • 23-05-2018 06:38PM
    #1
    Registered Users, Registered Users 2 Posts: 1,995 ✭✭✭


    Capture.pngwindows screen capture

    Considering the value is now - it's a constant steep curve? Is this caused by banks lending with using FIAT, where there is no physical commodity to back it up?


Comments

  • Registered Users, Registered Users 2 Posts: 1,435 ✭✭✭TiGeR KiNgS


    euser1984 wrote: »
    Capture.pngwindows screen capture

    Considering the value is now - it's a constant steep curve? Is this caused by banks lending with using FIAT, where there is no physical commodity to back it up?

    The graph is anything but a constant steep curve.

    Its full of booms and busts with a trend upward. This is the trend of growth for all capitalist countries.


Advertisement
Advertisement