Advertisement
If you have a new account but are having problems posting or verifying your account, please email us on hello@boards.ie for help. Thanks :)
Hello all! Please ensure that you are posting a new thread or question in the appropriate forum. The Feedback forum is overwhelmed with questions that are having to be moved elsewhere. If you need help to verify your account contact hello@boards.ie

Irish weather station info thread

  • 07-07-2018 11:42pm
    #1
    Registered Users, Registered Users 2 Posts: 8,219 ✭✭✭


    There is already a thread on the Shannon station due to the question over its suspiciously high temperature readings lately. This started a debate on the quality of the siting of this and other stations, so here is one thread aimed at providing a reference to as many stations as possible (coordinates, aerial imagery, etc.).

    Met Éireann have a page on all of their synoptic stations (excluding Airports) here, and one for their airports here. Here's a table summarising all, including the regional airports. The coordinates shown are the centre of the instrument enclosure, taken from the Bing aerial image.

    Stations should be sited in such a way as they can represent conditions of the general area. The station enclosure should be level and covered in short grass, well away from buildings, walls, paved areas, etc. The temperature sensors should be free from extraneous heat and radiation, and for this reason the they are housed in a Stevenson Screen, which allows natural ventilation of the air through its louvred sides while protecting the sensors from direct solar radiation. Rain gauges are usually sunk into circular pits in the ground to minimise the effects of undercatching due to wind turbulence. Anemometers are located on masts 10 metres above the ground, located several times that distance away from buildings and large trees to minimise turbulence effects.

    Departure from the above guidlelines can lead to biases in longterm climate trends for that station. In the case of Shannon, it's been discovered that it was relocated to an enclosure close to a large carpark some time after 2005. This has possibly led to false high temperature readings in times of sunny weather and easterly winds. A recent record temperature in Motherwell, Scotland, was since rejected by the Met Office as it was found that a vehicle had its engine running too close to the temperature sensor.

    Station|Coordinates|Elevation|Bing Aerial image
    Athenry|53.289136, -8.785543|40 m|https://binged.it/2MVmwqB
    Ballyhaise|54.053106, -7.313924|78 m|https://binged.it/2KFxSm9
    Belmullet|54.227524, -10.006817|9 m|https://binged.it/2MSzBRB
    Casement|53.305314, -6.441191|92 m|https://binged.it/2MZiX2T
    Claremorris|53.710646, -8.992343|68 m|https://binged.it/2MY0rYF
    Cork Airport|51.848130, -8.479649|160 m|https://binged.it/2MYIYiT
    Donegal Airport|55.043981, -8.339231|3 m|https://binged.it/2KCQxic
    Dublin Airport|53.421522, -6.297867|75 m|https://binged.it/2KHsxL2
    Dunsany|53.516082, -6.660575|83 m|https://binged.it/2MUzAws
    Finner|54.493887, -8.242865|33 m|https://binged.it/2MYemhf
    Gurteen|53.036297, -8.008522|75 m|https://binged.it/2KBLDlL
    Johnstown Castle|52.297632, -6.496774|62 m|https://binged.it/2KHk4HK
    Kerry Airport|52.180085, -9.537721|23 m|https://binged.it/2KEkVZv
    Mace Head|53.326435, -9.904225|14 m|https://binged.it/2MUdvhK
    Knock Airport|53.912811, -8.810569|203 m|https://binged.it/2N0a0X8
    Malin Head|55.371969, -7.339275|22 m|https://binged.it/2KFLca9
    Markree Castle|54.178403, -8.462420|34 m|https://binged.it/2KEUXFq
    Mount Dillon|53.726989, -7.980986|39 m|https://binged.it/2MY3Jee
    Mullingar|53.537184, -7.361872|101 m|https://binged.it/2MZQXMC
    Newport|53.923623, -9.572674|22 m|https://binged.it/2KE0FYi
    Oak Park|52.861242, -6.914991|62 m|https://binged.it/2N0FL2d
    Phoenix Park|53.363653, -6.349598|48 m|https://binged.it/2KJkmOs
    Roche's Point|51.798242, -8.250207|43 m|https://binged.it/2KHmF4v
    Shannon Airport|52.695279, -8.929433|6 m|https://binged.it/2KEtN1o
    Sherkin Island|51.476803, -9.428732|21 m|https://binged.it/2KJkuxq
    Sligo Airport|54.279412, -8.598905|3 m|https://binged.it/2KH4MTl
    Valentia|51.938301, -10.241029|25 m|https://binged.it/2KEX5wU
    Waterford Airport|52.189734, -7.087253|31 m|https://binged.it/2KE4xZk
    Weston Airport|53.355568, -6.487387|48 m|https://binged.it/2KF4Bb6


«1

Comments

  • Registered Users, Registered Users 2 Posts: 8,219 ✭✭✭Gaoth Laidir


    Do the Bing links work?


  • Registered Users, Registered Users 2 Posts: 2,681 ✭✭✭Rougies


    Do the Bing links work?


    Not for me, just bring me to the search front page. Maybe you have to be signed in?


  • Registered Users Posts: 3,427 ✭✭✭ZX7R


    Do the Bing links work?

    Bing links work as in it brings you there but not sure what I am ment to be searching for when there


  • Registered Users, Registered Users 2 Posts: 8,704 ✭✭✭Speak Now


    No not for me either.

    I've been trying recently to find a full list of stations they use for climatic data. Is that the
    full list above? Was Mount Juilet dropped?

    Also the only data I can get from Waterford airport is the latest reports which only covers the most recent couple of hours. Is this published somewhere else?

    BTW anyone know who runs the Killarney National park weather station. I was only looking at it yesterday wondering if it was still active.

    http://www.geograph.ie/photo/260173


  • Registered Users, Registered Users 2 Posts: 2,681 ✭✭✭Rougies


    Gaoth Laidir, the problem with the bing links is they add "</td><td>" to the end of the url for some reason. If I copy and paste the text they work fine.

    It looks like you have an empty column at the end of the table (thin grey vertical bar with a "_" at the top), so probably some formatting issues causing the problem.


  • Advertisement
  • Registered Users, Registered Users 2 Posts: 8,219 ✭✭✭Gaoth Laidir


    Rougies wrote: »
    Gaoth Laidir, the problem with the bing links is they add "</td><td>" to the end of the url for some reason. If I copy and paste the text they work fine.

    It looks like you have an empty column at the end of the table (thin grey vertical bar with a "_" at the top), so probably some formatting issues causing the problem.

    Spot on, thanks! Fixed now.


  • Registered Users, Registered Users 2 Posts: 8,219 ✭✭✭Gaoth Laidir


    Speak Now wrote: »
    No not for me either.

    I've been trying recently to find a full list of stations they use for climatic data. Is that the
    full list above? Was Mount Juilet dropped?

    Also the only data I can get from Waterford airport is the latest reports which only covers the most recent couple of hours. Is this published somewhere else?

    BTW anyone know who runs the Killarney National park weather station. I was only looking at it yesterday wondering if it was still active.

    http://www.geograph.ie/photo/260173

    The above list is only the hourly stations on their website plus a few more regional airports. You can see reports for the airports here. Airport codes are four letters, EI**, where the ** is the individual identifier.

    DL=Donegal
    SG=Sligo
    KN=Knock
    NN=Dublin
    ME=Casement
    DW=Dublin
    KY=Kerry
    CK=Cork
    WF=Waterford


  • Registered Users, Registered Users 2 Posts: 8,219 ✭✭✭Gaoth Laidir


    I took a few photos of the various weather instrumentation at Dublin Airport yesterday. There are two 10-metre anemometers, the main one is located midfield, south of the main runway, but I notice a new one further east, at the touchdown zone of R28. It's beside the Glidescope antenna array and therefore probably used by the tower when issuing landing clearances on that runway (I assume).

    At the midpoint of the runway there is another RVR sensor array with its own automatic weather station and 2-metre anemometer. These would most likely be part of the RVR system and used as a more precise indicator of conditions right at that point.

    455235.png


    https://farm1.staticflickr.com/925/41447348560_081dc8fb3c_z.jpg
    https://farm2.staticflickr.com/1823/41447329270_8b2b2ed25f_z.jpg
    https://farm1.staticflickr.com/924/41447357080_5719149f92_z.jpg


  • Registered Users, Registered Users 2 Posts: 8,219 ✭✭✭Gaoth Laidir


    Here's all the info on that refected record at Motherwell. Look at the stevenson's screen and the crap that's surrounding it. Ironically it was an ice cream van that was the source of extra heat.

    https://wattsupwiththat.com/2018/07/06/friday-funny-scottish-record-high-temperature-caused-by-ice-cream-truck/


  • Registered Users, Registered Users 2 Posts: 8,219 ✭✭✭Gaoth Laidir


    There is some more detailed info on some of the synoptic stations in the Subsets in the Ireland BUFR files, such as this one. It gives the height altitude of east station and its barometer, which in the case of the airports seems to be in a building several floors above ground level, but just 1 metre at the automatic stations. Exception: Casement's barometer is 4 metres BELOW station level (obviously some other part of the airfield).

    Station|WMO ID|Station altitude (m amsl)|Barometer altitude (m amsl)|Temperature sensor height (m agl)
    Sherkin Island|03951|20|21|1.25
    Valentia|03953|23|25|1.25
    Cork Airport|03955|153|162|1.25
    Johnstown Castle|03956|62|63|1.25
    Shannon Airport|03962|14|20|1.25
    Mace Head|03963|21|23|1.25
    Gurteen|03966|75|76|1.25
    Casement|03967|97|93|1.25
    Dublin Airport|03969|74|85|1.25
    Knock|03973|203|210|1.25
    Belmullet|03976|9|10|1.25
    Malin Head|03980|20|21|1.25


  • Advertisement
  • Registered Users Posts: 2,023 ✭✭✭Donegal Storm


    Here's all the info on that refected record at Motherwell. Look at the stevenson's screen and the crap that's surrounding it. Ironically it was an ice cream van that was the source of extra heat.

    https://wattsupwiththat.com/2018/07/06/friday-funny-scottish-record-high-temperature-caused-by-ice-cream-truck/

    I spent ages looking for that station on maps when that was first reported, suspected it was near tarmac but never would have even thought to look there, ridiculous location :rolleyes:


  • Registered Users, Registered Users 2 Posts: 1,115 ✭✭✭compsys


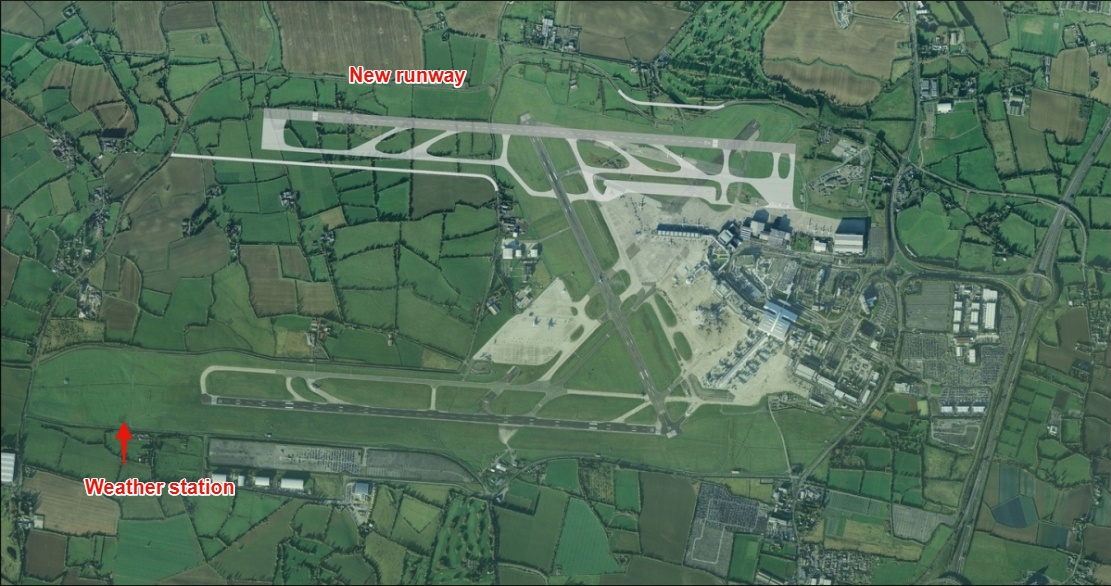
    Does anyone know how the proposed new runway at Dublin Airport could affect the Airport station?

    Will it have to be moved again or will it remain in the same place but potentially be affected by the new building works?


  • Registered Users, Registered Users 2 Posts: 2,681 ✭✭✭Rougies


    compsys wrote: »
    Does anyone know how the proposed new runway at Dublin Airport could affect the Airport station?

    Will it have to be moved again or will it remain in the same place but potentially be affected by the new building works?


    Not at all, the new runway would be about 2km away from the met station at it's closest point.


  • Registered Users, Registered Users 2 Posts: 1,775 ✭✭✭Bsal


    Should have no affect on the current position

    6d7317e8dd5634fe4c4633817000a6c1.jpg


  • Registered Users, Registered Users 2 Posts: 8,219 ✭✭✭Gaoth Laidir


    I wonder will the anemometer move, though. It's south of the midpoint of the current runway in bsal's image above. I suppose the solution is to install new independent anemometers at either end of the new runway for ATC to report local wind conditions to traffic using that runway. There already is one such anemometer at the threshold of the current runway (I posted it above). In that case the station meteorological and climatalogical wind data will remain unchanged as they can still come from the main anemometer.


  • Registered Users, Registered Users 2 Posts: 22,496 ✭✭✭✭Akrasia


    I received a reply from Met Eireann regarding the email I sent about Shannon airport. I've asked permission to post the contents here and he's ok with it so here's the response
    Hi David,


    Regarding the exposure at synoptic sites:


    Synoptic sites are chosen carefully to ensure compliance with WMO guidelines, both for realtime ‘synoptic’ observations and with a view to maintaining long term records. One of the factors take into account is the likelihood of future development within the locality of the site.


    At airports, sites can become encroached by development works which are outside our control and have not been foreseen. We aim to achieve a balance between the continuation of record taking in a unique location versus relocating an observing site– both of which can cause inhomogeneity in the historic datasets. We are currently upgrading the observing infrastructure at all the State’s airports, this is a major project which has been in planning since 2013, civil works have just commenced, this will result in the relocation and modernisation of most of the observing infrastructure at these airports, including at Shannon. As regards Shannon the current enclosure has been in use since 2004, while some changes in the environment of the enclosure have occurred since then, we still regard the location as within WMO guidelines. The prevailing synoptic conditions during early July meant that the highest temperatures occurred in the west of the country.


    Kind regards,
    Andrew

    I asked as a follow up question if there are any adjustments to the raw data to take account of changes to the site location or any changes to the environment and he said
    In relation to the raw data, there are standard qc processes but as I am not directly involved in that, I wouldn’t have all the details so I will request a response from the climate department and will forward it on to you when I get it.


  • Registered Users, Registered Users 2 Posts: 8,913 ✭✭✭Danno


    An aerial view of the Durrow climate station: (forgot to label the Manual Rain Gauge which is to the right of the Grass thermometer enclosure)

    457059.jpg


    Countryside to the east:

    457060.jpg


  • Registered Users, Registered Users 2 Posts: 8,219 ✭✭✭Gaoth Laidir


    The Irish Aviation Authority have this Excel file of temperature data for all airports/airfields in the country, based on both actual data measurements (where available) and interpolated values.

    Max and min refer to the average max and min of the warmest and coldest month, respectively, for the period 2015-2019. Casement's Min actually came in 0.1 lower than Dublin Airport (1.4 v 1.5 C).
    The temperatures are calculated as follows: For each of the past 5 years (2015-2019), for each location, the month with the lowest mean Max and Min was obtained and averaged. For locations with climate stations (Dublin, Shannon, Cork, Knock and Casement) the actual measurements were used, for other locations the temperatures were interpolated from 1km Max/Min temperature grids derived using all available observations for each month. Max and min temperature refer to the 0900 to 0900 period.

    https://www.iaa.ie/commercial-aviation/airspace/aeronautical-data

    551818.jpg


  • Registered Users, Registered Users 2 Posts: 8,219 ✭✭✭Gaoth Laidir


    I've generated this chart of the distance pairs between the sensor enclosures of all the Met Éireann stations and regional airports (in km). It's not such a small island after all, with 455 km between the two most distant stations (Malin Head and Sherkin Island).

    Most central station: Gurteen (average 131.2 km from other stations)
    Most remote station: Malin Head (average 249.9 km from other stations)
    Average station separation: 173.4 km

    Closest stations:
    1. Dublin Airport <-> Phoenix Park (7.3 km)
    2. Casement <-> Phoenix Park (8.9 km)
    3. Markree Castle <-> Sligo Airport (14.3 km)

    Most distant stations:
    1. Malin Head <-> Sherkin Island (455 km)
    2. Malin Head <-> Valentia (427 km)
    3. Donegal Airport <-> Sherkin Island (403 km)

    51170992230_e880149abd_b.jpg


  • Registered Users, Registered Users 2 Posts: 584 ✭✭✭axe2grind


    This page on the Met Eireann site has a map of their 82 temperature (Climate +Synoptic) stations as of 2017.

    On their rainfall page they mention just under 500 gauges, but the map is the same 82 sites as the temperature one.


  • Advertisement
  • Registered Users, Registered Users 2 Posts: 1,484 ✭✭✭Jpmarn


    I've generated this chart of the distance pairs between the sensor enclosures of all the Met Éireann stations and regional airports (in km). It's not such a small island after all, with 455 km between the two most distant stations (Malin Head and Sherkin Island).

    Most central station: Gurteen (average 131.2 km from other stations)
    Most remote station: Malin Head (average 249.9 km from other stations)
    Average station separation: 173.4 km

    Closest stations:
    1. Dublin Airport <-> Phoenix Park (7.3 km)
    2. Casement <-> Phoenix Park (8.9 km)
    3. Markree Castle <-> Sligo Airport (14.3 km)

    Most distant stations:
    1. Malin Head <-> Sherkin Island (455 km)
    2. Malin Head <-> Valentia (427 km)
    3. Donegal Airport <-> Sherkin Island (403 km)

    51167824113_666ae141a9_b.jpg

    Some of the distances are confusing. From Shannon Airport it states 185 KM to Belmullet and 218 Km to Claremorris. From Claremorris it states it is 218km to both Roche’s Point and Shannon Airport. There maybe more errors on this table with regards to distances between weather stations.


  • Registered Users, Registered Users 2 Posts: 8,219 ✭✭✭Gaoth Laidir


    Jpmarn wrote: »
    Some of the distances are confusing. From Shannon Airport it states 185 KM to Belmullet and 218 Km to Claremorris. From Claremorris it states it is 218km to both Roche’s Point and Shannon Airport. There maybe more errors on this table with regards to distances between weather stations.

    Correct. It should have read 113 km Shannon <-> Claremorris. I've corrected the image above now.


  • Registered Users Posts: 1,570 ✭✭✭Tyrone212


    I've generated this chart of the distance pairs between the sensor enclosures of all the Met Éireann stations and regional airports (in km). It's not such a small island after all, with 455 km between the two most distant stations (Malin Head and Sherkin Island).

    As the crow flies Malin head is closer to
    John o' Groats than it is to Mizen head.


  • Registered Users, Registered Users 2 Posts: 8,219 ✭✭✭Gaoth Laidir


    A weird observation on the Newport, Co. Mayo station. It is sited in slightly raised ground to the back (north) of the Marine Institute buildings, however that seems to be just the wind mast and precipitation pits (A below). The Stevenson screen seems to be located in a residential driveway around 90 metres to the east (B). Zooming in on Streetview shows this to be an awful site for a temperature sensor. Sitting on a tarmac driveway, close to larger bushes and trees. If this is the actual screen of the Newport station then it's more ridiculous than Shannon. Anyone able to confirm if this is really the same screen?

    Aerial view


  • Registered Users, Registered Users 2 Posts: 8,913 ✭✭✭Danno


    It looks to be on a gravel base at the end of a large enough tarmac driveway/walkway. Unreal! 😮

    Kilkenny was closed for less than that!


  • Registered Users, Registered Users 2 Posts: 1,151 ✭✭✭tphase


    [QUOTE] Mace Head|53.326435, -9.904225|14 m|https://binged.it/2MUdvhK [\QUOTE]

    minor correction to your list, the co-ordinates for Mace Head point to the research labs close to the shore (altitude 8 m)

    The met station is at 53.325745, -9.900745 (altitude 21 m)


  • Registered Users, Registered Users 2 Posts: 8,219 ✭✭✭Gaoth Laidir


    Maybe that's actually the old climate station that's there since 1959. Met.ie's photo below shows the wind and precipitation site but doesn't show any temperature sensor there (doesn't mean it's not there, just not in the photo...). I see the radiation sensor alright.


  • Registered Users, Registered Users 2 Posts: 8,219 ✭✭✭Gaoth Laidir


    Met Éireann have two stations listed as Newport Furnace on their Historical Data page; the main automated one in the hourly reports (with data starting from 2005) and the climate one (data since 1959). I compared the data for both stations (Auto and Clim) from 22 Feb 2005 to 31 Nov 2021 and filtered out the top twenty-six Maximum Temperature values of the whole set to see which station tends to read higher on the hottest days.

    In pretty much all cases (25 out of 26 shown below) the Climate station read the same or higher, with an average bias of 0.6 degrees, but in 11 cases it was 1 degree or more higher. If that station in the driveway above is in fact the original climate station then it really does call into question the quality of some of our long-term climate datasets.

    Over the whole dataset for all weathers, the climate station seems to be reading higher than the Auto (green) more times than not (red). Bars=Climate-Auto.

    Overall, these are the average daily max and min values for the whole dataset.

    Average daily max:

    Auto: 13.60 C

    Climate: 13.88 C


    Average daily min:

    Auto: 7.42 C

    Climate: 7.85 C

    Post edited by Gaoth Laidir on


  • Registered Users, Registered Users 2 Posts: 8,219 ✭✭✭Gaoth Laidir


    And just to close it out, here is a close-up of the climate station sitting over a gravel surface. The Marine Institute confirm on their Facebook page that it's the original climate station


  • Advertisement
  • Registered Users, Registered Users 2 Posts: 8,913 ✭✭✭Danno


    Is that a Davis rain bucket? The nearer black one...


Advertisement