Advertisement
If you have a new account but are having problems posting or verifying your account, please email us on hello@boards.ie for help. Thanks :)
Hello all! Please ensure that you are posting a new thread or question in the appropriate forum. The Feedback forum is overwhelmed with questions that are having to be moved elsewhere. If you need help to verify your account contact hello@boards.ie

Cold Spell Late Feb/ Early March Technical Discussion only MOD NOTE POST #1

Options
1111214161755

Comments

  • Closed Accounts Posts: 6,751 ✭✭✭mirrorwall14


    Can I ask a technical question as we are unsure in the chat thread?

    TOTAL SNOWFALLS PREDICTED OVER PERIOD 27 February to 3 March 2018 (cms)

    LOCATION ______ Least __ 25% __ 50% __ 75% __ Most


    Does this read like a bell curve where the 50% values are the most likely? Or is the "most" end totals the most likely?


  • Registered Users Posts: 5,033 ✭✭✭Snowbie


    highdef wrote: »
    We should be able to get some forewarning of what to expect in advance, based on how intense showers are when they land in Eastern England. The North Sea is a degree or two cooler than the Irish Sea so in theory, showers for be more intense for Ireland, assuming similar upper air temperatures.

    Bit more of a longer sea track for eastern UK and also 850mb temps could be colder over the North Sea so be similar in theory. However, the shallow Low moving down in the NE flow could pep up activity in the Irish Sea regardless for later Tuesday so maybe something more organised but that be a nowcast. We both saw this late nov 2010 if you remember and also Feb 9th 1991 had a significant event for Dublin, Wicklow and Kildare with a similar feature that wasnt forecast due to a surface shallow low in a NE flow.


  • Registered Users Posts: 9,233 ✭✭✭sdanseo


    Can I ask a technical question as we are unsure in the chat thread?

    TOTAL SNOWFALLS PREDICTED OVER PERIOD 27 February to 3 March 2018 (cms)

    LOCATION ______ Least __ 25% __ 50% __ 75% __ Most


    Does this read like a bell curve where the 50% values are the most likely? Or is the "most" end totals the most likely?

    Correct I think. Essentially a small chance of least / most column occuring, 25% chance of either the 25% or 75% colums occuring, and 50% chance column most probable outcome.


  • Registered Users Posts: 422 ✭✭Popeleo


    Can I ask a technical question as we are unsure in the chat thread?

    TOTAL SNOWFALLS PREDICTED OVER PERIOD 27 February to 3 March 2018 (cms)

    LOCATION ______ Least __ 25% __ 50% __ 75% __ Most


    Does this read like a bell curve where the 50% values are the most likely? Or is the "most" end totals the most likely?

    This will probably be moved or deleted but here goes...
    Those figures look like a standard bell curve, so the 50% is the top of the curve.
    Imagine you have a nerdy Dungeons and Dragons-type dice with 101 sides on it. Roll the dice and the higher the number, the higher the snowfall.
    Roll a 0 and you get the minimum. Roll a 100 and you get the maximum.
    The average roll will be a 50. You can roughly work out the other numbers from the figures given.

    This far out, there is a big spread between high and low. Nearer the time, the min and max figures should be nearer to each other.


  • Moderators, Science, Health & Environment Moderators Posts: 11,829 Mod ✭✭✭✭Meteorite58


    Chart for Fri showing the developing Storm. Where it tracks will have a major influence no doubt . Models differing quite a bit on track at this stage.

    KmV8FLH.png

    GFS

    tempresult_ril7.gif


  • Advertisement
  • Registered Users Posts: 23,822 ✭✭✭✭Larbre34


    I'd thought it meant 100% is certainty, or at least MT forecasting his favoured outcome, 25% only having 1 chance in 4 of being the outcome?


  • Registered Users Posts: 5,033 ✭✭✭Snowbie


    @Meteorite58

    We dont want it to approach on a Sw to NE motion as it will marginalise things a lot and could be sleety mess on lower levels with more maritime air in the mix. South to north is good but SE to NW motion is best


  • Registered Users Posts: 14,339 ✭✭✭✭M.T. Cranium


    Those are confidence intervals and the result is a bell curve type probability, in other words 50% interval is equally likely to be high or low when compared to outcome. The zero per cent represents what I believe to be the lowest total snowfall possible in the model consensus scenario and the 100% value is the most snowfall reasonably likely given the guidance. Of course you could argue for a zero cm outcome being the zero per cent and some astronomical amount being the 100% value, but these 0 and 100 are probably more like 0.1% and 99.9% confidence intervals if you want to get technical.

    As to what I would personally predict, my hunch is that outcomes may be closer to the 75% column than the 50% column but that is in part because I think the more extreme model scenarios will verify. The Arpege and UKMO 50% would be closer to the consensus 75% if you see what I mean. The milder members of the ensembles would be closer to the 25% column.

    With a scenario like that ECM, a strong low without much frontal development, edging in towards a cold, snow-covered land mass, it should be realized that (a) the most permissive values of 850 mb and thickness will sustain further snow and (b) the interaction may not be well modelled and lower values will persist longer.

    Verbatim, at the lowest point of pressure trend, I would expect reports like this: Cork city and airport reports of heavy sleet, or alternating periods of heavy wet snow and rain, coastal reports of rain, inland reports of heavy wet snow, higher elevation to west reports of massive snow accumulations. Then this mix would move along with the filling low but all forms would become less intense over time.


  • Registered Users Posts: 12,778 ✭✭✭✭ninebeanrows


    FWIW the ICON would have the east coast buried.


  • Registered Users Posts: 23,481 ✭✭✭✭Kermit.de.frog


    ICON follows more the UKMO setup.

    icon-0-111.png?25-18


  • Advertisement
  • Registered Users Posts: 18,113 ✭✭✭✭JCX BXC


    All eyes on the pub run 18Z GFS.

    My current thinking is these showers could make it further inland than we'd normally expect thanks to the driving easterly winds. Some models are suggesting that the snow could make it as far as West Clare, such as the GFS. Any similar thinking on this?


  • Registered Users Posts: 1,333 ✭✭✭Saganist


    Larbre34 wrote: »
    I'd thought it meant 100% is certainty, or at least MT forecasting his favoured outcome, 25% only having 1 chance in 4 of being the outcome?

    The % is the scale / measure of snowdepth. Not certainty. The forecast is in the numbers.


  • Registered Users Posts: 9,233 ✭✭✭sdanseo


    FWIW the ICON would have the east coast buried.

    8 to 15cm widespread

    30 to 50cm to low levels along the east coast

    60 to 70cm over wicklow, local drifts would be measured in metres

    iconeu_uk1-45-120-0.png?25-22


  • Registered Users Posts: 12,778 ✭✭✭✭ninebeanrows


    JCX BXC wrote: »
    All eyes on the pub run 18Z GFS.

    My current thinking is these showers could make it further inland than we'd normally expect thanks to the driving easterly winds. Some models are suggesting that the snow could make it as far as West Clare, such as the GFS. Any similar thinking on this?

    I think when we get the more ESE flow, they can scoot right across to Mayo... long fetch from Lpool to Balbriggan.


  • Registered Users Posts: 9,233 ✭✭✭sdanseo


    OK so granted an unrealiable chart, but if nothing whatsoever melted over the next 5 days and we assumed a multiplier of 25x this shows 2 metres / 7 feet of snow over Wicklow

    The drifts would be taller than houses

    (I'm ramping uncontrollably, but at a pedantic level, this is what the chart shows)

    iconeu_uk1-25-120-0.png?25-22


  • Registered Users Posts: 23,481 ✭✭✭✭Kermit.de.frog


    iconeu_uk1-1-111-0.png?25-22

    takemymoney.jpg


  • Moderators, Science, Health & Environment Moderators Posts: 7,146 Mod ✭✭✭✭pistolpetes11


    wakka12 wrote: »
    Im so excited :) Feel like we finally know its definitely coming and can just look forward to it now. The amount of people Ive argued with telling them theres loads of snow coming after them saying not a chance is many so it better be bad so I don't look like a tool

    PLEASE POST IN THE CORRECT THREADS ,THIS IS FOR TECHNICAL MODEL DISCUSSION


  • Registered Users Posts: 2,023 ✭✭✭Donegal Storm


    Bizarre forecast on RTE just there, showed cloud and temperatures for tomorrow afternoon then just finished with no info beyond that :confused:


    Anyway, a few showers showing up on the radar now east of Scotland, encouraging considering pressure & heights are high there at the moment.

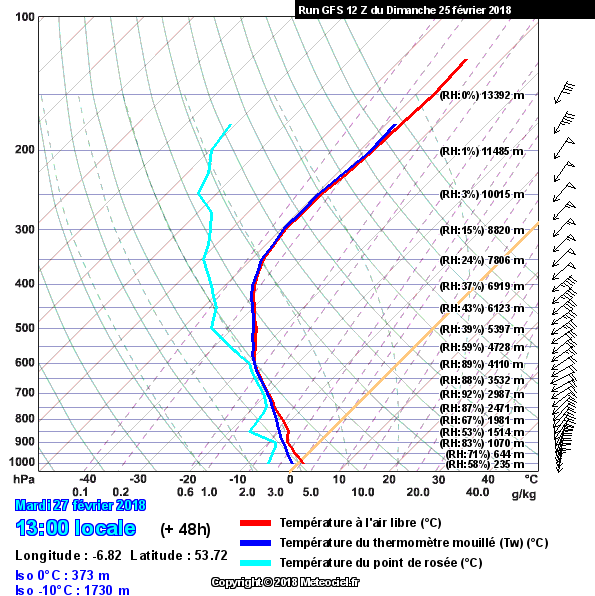
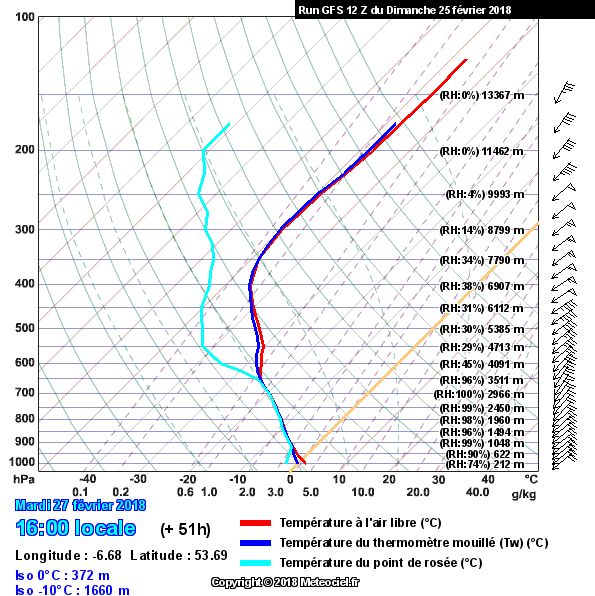
    Upper temps should start to fall away from now on though largely dry tomorrow, Tuesday afternoon looks to be the turning point as far as favourable conditions for convection go. At 1pm still a bit of a cap in place but by 4pm its been eroded away

    sondagegfs_98_11_48_1_1519594643.png

    sondagegfs_102_13_51_1_1519594456.png


  • Registered Users Posts: 9,233 ✭✭✭sdanseo


    iconeu_uk1-1-111-0.png?25-22


    Crikey...25mm in 3hrs

    Multiply by 25...you do the maths


  • Registered Users Posts: 7,119 ✭✭✭pad199207


    sdanseo wrote: »
    8 to 15cm widespread

    30 to 50cm to low levels along the east coast

    60 to 70cm over wicklow, local drifts would be measured in metres

    iconeu_uk1-45-120-0.png?25-22

    That’s 40-50cm for the Naas Area. I’m sorry that’s just too good to be true lol


  • Advertisement
  • Registered Users Posts: 9,233 ✭✭✭sdanseo


    pad199207 wrote: »
    That’s 40-50cm for the Naas Area. I’m sorry that’s just too good to be true lol

    Kermit's chart shows Naas (along with basically all of Leinster) getting potentially 60cm in 3 hours

    I keep having to convince myself that I'm not reading it wrong

    The country would just completely shut down


  • Registered Users Posts: 4,677 ✭✭✭SleetAndSnow


    sdanseo wrote: »
    Kermit's chart shows Naas (along with basically all of Leinster) getting potentially 60cm in 3 hours

    I keep having to convince myself that I'm not reading it wrong

    The country would just completely shut down

    I assume thats just ICON being ICON and over-estimating things. But who knows.


  • Posts: 0 [Deleted User]


    Kick off time would appear to be Tuesday afternoon for the East.

    45-779UK_hvx5.GIF


  • Registered Users Posts: 14,339 ✭✭✭✭M.T. Cranium


    Those charts are total accumulations from the start of the model run. Still, a lot of snow depicted there.


  • Registered Users Posts: 9,233 ✭✭✭sdanseo


    Would 60cm in 3 hours not be equivalent to 60mm of rain? That would be extreme if it were to come off. I wont be believing the outcome until Tuesdays Ecm 12z

    I don't for a second think it will actually be that intense. Plus GL pointed out earlier that ICON in particular tends to way overestimate precip rate.

    But if it did come off the multiplier from mm rain to to mm snow is anywhere from 10 to 40 and those much more knowledgeable have suggested we should be seeing around 25x so that's the calculation I used.


  • Registered Users Posts: 910 ✭✭✭downwiththatsor


    sdanseo wrote: »
    I don't for a second think it will actually be that intense. Plus GL pointed out earlier that ICON in particular tends to way overestimate precip rate.

    But if it did come off the multiplier from mm rain to to mm snow is anywhere from 10 to 40 and those much more knowledgeable have suggested we should be seeing around 25x so that's the calculation I used.

    I used 10x so that explains the large amount so, 24mm in 3 hours not too extreme.

    Edit: Gfs 18z seems to be bringing milder air into the mix at 114hrs. Not buying it.


  • Registered Users Posts: 4,677 ✭✭✭SleetAndSnow


    Here it comes. isobars look a bit tighter at 102hrs

    102-21UK_xfy9.GIF


  • Registered Users Posts: 8,219 ✭✭✭Gaoth Laidir


    Snowfall in northern Germany today ranged from 2-7 cm, with liquid-equivalent ratios of around 25:1. Not as high as I had imagined for that area, so it begs the question what the ratio will be here. It is unlikely to be higher than that, and most likely lower, probably 15-20:1 initially anyway.

    The snow depth forecast charts are based on a 10:1 ratio, so in reality they may be showing a little low. Having said that, I find it hard to believe we'll see 40 or 60 cm totals in places like Dublin. I reckon the highest depths reported at Dublin and Casement airports will be 15 cm.


  • Registered Users Posts: 4,677 ✭✭✭SleetAndSnow


    108hrs

    108-21UK_ehp7.GIF

    Seems very circular and defined at 114hrs and its more west then it was the previous run it seems and it goes west after the 108hr run

    114-21UK_rou1.GIF


  • Advertisement
  • Registered Users Posts: 23,481 ✭✭✭✭Kermit.de.frog


    Not the easiest commute on Friday. Snow and very strong winds.

    108-574UK.GIF?25-18


This discussion has been closed.
Advertisement