Advertisement
If you have a new account but are having problems posting or verifying your account, please email us on hello@boards.ie for help. Thanks :)
Hello all! Please ensure that you are posting a new thread or question in the appropriate forum. The Feedback forum is overwhelmed with questions that are having to be moved elsewhere. If you need help to verify your account contact hello@boards.ie

Climate Change - General Discussion : Read the Mod Note in post #1 before posting

Options
1212224262744

Comments

  • Registered Users Posts: 8,219 ✭✭✭Gaoth Laidir


    Akrasia wrote: »
    Look, Just because you can't understand something doesn't make it wrong. That's called the 'argument from ignorance'. You should know perfectly well that rainfall is not evenly distributed within a storm. Some places will get much more rain than others, so a x% increase in overall precipitation within a storm could be much higher local event while other places will be unscathed. Storm dynamics are complex, you of all people know this so it is disappointing that you are bringing up such facile points to counter a scientific finding.

    There are many scientific studies that discuss how relatively small increases in atmospheric water content have led to disproportionately high rainfall. The moisture in any given rainfall event is drawn in from a much larger footprint than the actual area of rainfall itself. A 5% increase of atmospheric water content can translate into an increased intensity that is much greater than 5%.

    You of all people know that increases in one factor can result in exponentially greater effects. You know that hurricane force wind speeds increase the power of the storm by the square of the velocity of the winds, so that a category 5 storm with min winds of 157mph is 5 times more powerful than a cat 1 storm with winds of min 74mph. So a doubling of the wind speed results in a 5 fold increase in power. Similarly, as atmospheric water content goes up, the effects can be much greater than the nominal increase in water content.

    Instead of dismissing these flooding events that are clearly increasing, you could critically apply the knowledge you clearly have on weather and precipitation events and if you do so honestly, I have no doubt that you will figure out how it is perfectly plausible that a global average temperature increase of 1 degree C could lead to a large increase in flood events.

    I'm not disputing the theory, I'm just questioning the dimensions of the effect and asking for some evidence of the fourfould increase in short-term flooding events, that's all. Nothing to do with annual totals.
    Regarding vapour pressure, you haven't shown that specific humidity is not increasing as expected in line with temperature increases. There has been increased evaporation and we have measured increased atmospheric water vapour content globally
    specific_relativehumidity1970-2013_610.gif?itok=nzYcGV99

    And you havent' shown anything about the opposite effect of increased cloudiness. The increase in mixing ratio above is miniscule (~0.3 g/kg) out of an average of around 9-10 g/kg. I'd still like to know more on the details of how such a small increase can cause the drastic changes you mention. Again, not sure where you're going with the storm dynamics theory. Nothing has changed with things like local enhancement of rainfall, etc. It's always been the case.
    Akrasia wrote: »
    It is both.
    and for the millionth time, there doesn't have to be a 4 fold increase in rainfall to cause 4 times as many floods

    If there are 12 heavy rainfall days spread evenly around the year, that's one day of heavy rain a month which could be well within the capacity of the rivers to drain. If the summers are drier and the winters are wetter, that could be 12 heavy rainfall days spread over 3 or 4 months, and if several of those heavy rainfall days happen within the same week, then you have a big flood caused by exactly the same amount of annual rainfall that would have posed no issues at all under the previous rainfall pattern.

    And you don't need to have 4 times as much rain to cause 4 times as many floods. If a river rises to just below the top of the river bank, there is no flood. If that river rises a few percent so that it comes over the riverbank/flood wall, then suddenly there is a flood. A small bit of extra water above the capacity of the river system.

    And again, where's the evidence of all these different patterns?

    of course everywhere hasn't. but a lot of places have been. Ennis for example used to flood regularly but they raised the walls on the Fergus and put in bilge pumps and and it hasn't flooded in years. if you think the massive increases in flood damage is because of reckless development then it is up to you to prove that claim. In Europe, generally developments have to go through planning processes that include flood risk assessments. If there have been new developments that have flooded, you have to ask why the flood risk assessments didn't pick this up during planning? Is it because these areas weren't a flood risk until climate change increased the intensity of storms and rainfall events?

    In the Irish case it's been well-documented the problems with local planning authorities' granting of permission to develop flood plains along the Shannon, etc., and of course their failure when it comes to dredging, etc. Further afield, places like New Orleans, Manhattan, etc., are hugh developments in the worst possible place. A Katrina was always bound to happen. It was never a question of if but when. Harvey too. Hurricanes stall over the same spot all the time, so it's not surprising that in this case it happened to occur just over the coast. Had the eye made it just a few miles further west it would have made landfall, breaking up the storm much sooner and not giving several days of rainfall over land. It's the fine margins.
    Akrasia wrote: »
    Firstly, we had this exact conversation before using these exact graphs. Do you not remember insisting that the graphs didn't show an increasing rainfall trend until you finally admitted that you were reading them wrong?

    And please stop calling it 'my theory'. It is not 'my theory' that climate change leads to more intense rainfall, it is established scientific fact, established in both models and observations

    I was replying to Oneiric, not you, when I said about "your theory".

    Yes, I remember that conversation now, I was reading it wrong. I also remember you admitting in reply that there are no real data you could find to prove increases in flash-flood events, as there are so many other factors involved, so I suppose I'll stop asking you now.


  • Registered Users Posts: 22,348 ✭✭✭✭Akrasia


    Well, I have shown evidence but you just refuse to accept it. Your standard of evidence for increased flooding is absolute certainty while your standard of evidence for no increase in flooding is 1% uncertainty

    When rainfall patterns are proven to be changing, insurance claims are increasing massively, the number of reported floods increases massively... Your answer to all of these is that they're not happening or the studies have uncertainty attached to them or they're all natural events and we're just unlucky in their impact on human settlements.

    Ireland, wettest decade in 300 years, UK, wettest winters on record have been mostly since 1998, record breaking rainfalls in Paris a few weeks ago, pick a country and records are tumbling


  • Registered Users Posts: 6,235 ✭✭✭Oneiric 3


    I think that was the data for Claremorris you posted? Nationally, there is little trend in seasonal totals since 1940.

    I'm not even going to dare challenge your argument since my understanding of what 'vapour pressure' is is close to zilch. :o. However, if we take a look at the trend in year on year 'precipitable water', over the region of the North Atlantic in which most of our weather comes from, there is a notable rise since the turn of the century:

    J94apI3.png

    Again, however, my understanding of what 'precipitable water' actually is is poor, but what little I do know is that higher amounts tend to occur within moist frontal warm sectors, with the graph above suggesting that perhaps these are becoming more of a feature over the specified region over the last decade or so.

    New Moon


  • Registered Users Posts: 8,219 ✭✭✭Gaoth Laidir


    Oneiric 3 wrote: »
    I'm not even going to dare challenge your argument since my understanding of what 'vapour pressure' is is close to zilch. :o. However, if we take a look at the trend in year on year 'precipitable water', over the region of the North Atlantic in which most of our weather comes from, there is a notable rise since the turn of the century:

    J94apI3.png

    Again, however, my understanding of what 'precipitable water' actually is is poor, but what little I do know is that higher amounts tend to occur within moist frontal warm sectors, with the graph above suggesting that perhaps these are becoming more of a feature over the specified region over the last decade or so.

    Precipitable water is the total water content in a vertical column of the atmosphere, i.e. if all of the water were to "rain out" of the atmosphere at one point, how much rain would be measured? 1 kg/m²=1 mm.

    I would say that the slight increase in PW is due to the AMO turning positive around the same time.

    446811.png

    Vapour pressure is the fraction of total atmospheric pressure exerted by the water vapour content, itself being gas, just like Nitrogen and Oxygen. The more water vapour, the higher the vapour pressure. The warmer the air, the more water vapour it can hold and therefore the higher the potential vapour pressure. That can be seen in the annual increase measured in the summer months in Valentia.


  • Registered Users Posts: 8,219 ✭✭✭Gaoth Laidir


    Akrasia wrote: »
    Well, I have shown evidence but you just refuse to accept it. Your standard of evidence for increased flooding is absolute certainty while your standard of evidence for no increase in flooding is 1% uncertainty

    When rainfall patterns are proven to be changing, insurance claims are increasing massively, the number of reported floods increases massively... Your answer to all of these is that they're not happening or the studies have uncertainty attached to them or they're all natural events and we're just unlucky in their impact on human settlements.

    Ireland, wettest decade in 300 years, UK, wettest winters on record have been mostly since 1998, record breaking rainfalls in Paris a few weeks ago, pick a country and records are tumbling

    The evidence you've shown me is from a non-peer-reviewed paper, the authors of which readily point out that reporting of such severe events has been influenced by the advent of technology. I haven't found any credible meteorological or climatological data to back up the fourfold claim, only data from the insurance industry, which I don't fully trust as a climatological basis, due to increases in population and material goods.


  • Advertisement
  • Registered Users Posts: 22,348 ✭✭✭✭Akrasia


    The evidence you've shown me is from a non-peer-reviewed paper, the authors of which readily point out that reporting of such severe events has been influenced by the advent of technology. I haven't found any credible meteorological or climatological data to back up the fourfold claim, only data from the insurance industry, which I don't fully trust as a climatological basis, due to increases in population and material goods.

    The non peer reviewed statement took the 4x claim from a peer reviewed paper Kundzewicz et al., 2017 which was based on Dartmouth Flood Observatory (USA) records. If you want to find the credible meteorological or climatological data, I suggest you look there. They'll send you their data if you email them.

    And you are overstating their uncertainty. Maybe there is a small proportion of under reporting on the smaller scale floods, but nobody suggests that large severity and high magnitude floods went unreported in 1980.

    But even allowing for some under reporting in the past, even if it instead of a 400% and 200% increase in flooding over 38 years, if it was only half that, a 200% and 100% increase in flooding, that would still be a major cause for concern given that we are only at about half the amount of warming we expect to see this century (if we're lucky)


  • Closed Accounts Posts: 2,175 ✭✭✭dense


    Akrasia wrote: »
    The non peer reviewed statement took the 4x claim from a peer reviewed paper Kundzewicz et al., 2017 which was based on Dartmouth Flood Observatory (USA) records.

    This one?

    "It has not been possible to detect ubiquitous changes in flood characteristics in observation records in Europe, so far."

    Zbigniew W. Kundzewicz, Iwona Pińskwar, G. Robert Brakenridge
    Available Online 26 May 2017, nh2017016; DOI: 10.2166/nh.2017.016


    http://hr.iwaponline.com/content/early/2017/05/26/nh.2017.016


  • Registered Users Posts: 8,219 ✭✭✭Gaoth Laidir


    Akrasia wrote: »
    The non peer reviewed statement took the 4x claim from a peer reviewed paper Kundzewicz et al., 2017 which was based on Dartmouth Flood Observatory (USA) records. If you want to find the credible meteorological or climatological data, I suggest you look there. They'll send you their data if you email them.

    And you are overstating their uncertainty. Maybe there is a small proportion of under reporting on the smaller scale floods, but nobody suggests that large severity and high magnitude floods went unreported in 1980.

    But even allowing for some under reporting in the past, even if it instead of a 400% and 200% increase in flooding over 38 years, if it was only half that, a 200% and 100% increase in flooding, that would still be a major cause for concern given that we are only at about half the amount of warming we expect to see this century (if we're lucky)

    They stated more than "a small proportion" of under-reporting in 1980.

    I don't have access to the full Kundewicz paper, but the abstract below would appear to paint a different picture than you're making out, and does indeed state the uncertainty as "considerable". I would take considerable to mean fairly big, and therefore not that prone to overstatement.

    Some key phrases from the abstract:
    It is difficult to disentangle the climatic change component from strong natural variability and direct human impacts...
    The climate change impact on flood hazard is complex and depends on the river flood generation mechanism...
    It has not been possible to detect ubiquitous changes in flood characteristics in observation records in Europe, so far...

    While it does find
    an increasing tendency in the number of floods with large magnitude and severity, even if year-to-year variability is strong...
    it doesn't mention a fourfold increase in this trend, and highlights wide variations in future projections, depending on assumptions.
    Abstract
    Despite costly flood risk reduction efforts, material damage and death toll caused by river floods continue to be high in Europe. In the present review paper, after outlining a process-based perspective, we examine observed and projected changes in flood hazard. Spatial and temporal variability of large floods is analyzed, based on a time series of flood information, collected by the Dartmouth Flood Observatory in 1985–2016. Model-based projections of future flood hazard are critically reviewed. It is difficult to disentangle the climatic change component from strong natural variability and direct human impacts. The climate change impact on flood hazard is complex and depends on the river flood generation mechanism. It has not been possible to detect ubiquitous changes in flood characteristics in observation records in Europe, so far. However, we found an increasing tendency in the number of floods with large magnitude and severity, even if year-to-year variability is strong. There is a considerable spread of river flood hazard projections in Europe among studies, carried out under different assumptions. Therefore, caution must be exerted by practitioners in charge of climate change adaptation, flood risk reduction, risk insurance, and water resources management when accommodating information on flood hazard projections, under considerable uncertainty.

    Then there's Stephan Thober et al, 2018 , which summarises reduced flood projections for both the Med and northern Europe. This would appear to contradict the other paper and wouldn't be near the cause for concern that you make out.
    The magnitude of climate change has diverse impacts on European river high flows (10% exceedance probability of streamflow) and floods (annual maximum). Decreases are projected for both high flows (up to −31%) and floods (up to −17%) in the Mediterranean and Eastern Europe mostly related to decreases in total annual precipitation. In Northern regions, high flows are projected to increase due to increasing precipitation, but floods are projected to decrease due to less snowmelt. In these regions, adaptation to climate change thus has to be designed explicitly for the metric in mind, which has to be chosen according to stakeholder requirements.


  • Registered Users Posts: 2,855 ✭✭✭Nabber


    Page 59, have we figured it out?

    Rainfall as an indicator of global warming?

    AGW suffers it’s own success. The theory was posed, it was accepted, now it has to continue its existence.
    Any data that confirms its probability is used, regardless of AGW probability of affect.
    Indicators are born when they support the theory.

    This has always been my issue.

    Ice melt = submerged coast lines
    Ice melts, coast lines are not submerged
    Ice melt no longer an immediate danger but now an indicator.

    The largest influence to our climate, the sun is the one we know the least about. As the sun cannot factor in AGW it’s largely ignored.
    I have yet to see a Theory on AGW that accepts the Sun in itself does not provide an exact constant radiation towards Earth.

    Disputing a warming Earth is irrelevant. Disputing Human made warming is futile and pointless as the Theory is man made :)

    Recycling, reducing waste... I’m all for it.
    Going green, all for it too.


  • Registered Users Posts: 8,219 ✭✭✭Gaoth Laidir


    Oneiric 3 wrote: »
    However, if we take a look at the trend in year on year 'precipitable water', over the region of the North Atlantic in which most of our weather comes from, there is a notable rise since the turn of the century:

    J94apI3.png

    Taking that data and putting it on an absolute vertical scale shows the actual magnitude of the rise relative to the total. Doesn't look so striking now in the overall scheme of things for a 40-year period.

    446832.png


  • Advertisement
  • Registered Users Posts: 22,348 ✭✭✭✭Akrasia


    dense wrote: »
    This one?

    "It has not been possible to detect ubiquitous changes in flood characteristics in observation records in Europe, so far."

    Zbigniew W. Kundzewicz, Iwona Pińskwar, G. Robert Brakenridge
    Available Online 26 May 2017, nh2017016; DOI: 10.2166/nh.2017.016


    http://hr.iwaponline.com/content/early/2017/05/26/nh.2017.016
    Yes, and the exact next line???
    "However, we found an increasing tendency in the number of floods with large magnitude and severity, even if year-to-year variability is strong. "


  • Closed Accounts Posts: 2,175 ✭✭✭dense


    Akrasia wrote: »
    Yes, and the exact next line???
    "However, we found an increasing tendency in the number of floods with large magnitude and severity, even if year-to-year variability is strong. "

    Where's this 400% increase you're talking about?


  • Registered Users Posts: 22,348 ✭✭✭✭Akrasia


    They stated more than "a small proportion" of under-reporting in 1980.

    I don't have access to the full Kundewicz paper, but the abstract below would appear to paint a different picture than you're making out, and does indeed state the uncertainty as "considerable". I would take considerable to mean fairly big, and therefore not that prone to overstatement.
    I think I will accept the analysis of the EASAC who have actually read the study rather than just the abstract on this matter.
    Then there's Stephan Thober et al, 2018 , which summarises reduced flood projections for both the Med and northern Europe. This would appear to contradict the other paper and wouldn't be near the cause for concern that you make out.
    This paper relates to projections, the other paper relates to observed impacts. There is more uncertainty with projections than with observed impacts. But regardless, this study says dry areas will have fewer floods, but it still projects more instances of heavy precipitation in much of europe.

    It is just as much a cause for concern as the other report given that it suggests a large reduction in precipitation levels in semi arid regions of Europe. Flooding is the least of their concerns. In areas that rely on snowpack for river flow, the amount of winter precipitation affects the likelyhood of flooding. In these countries, on average winter precipitation might decrease, but floods aren't average events, they're extreme events, so in a year with above average winter precipitation, more intense rainfall will combine with meltwater to cause worse floods.
    This is closer to the picture that Donnelly paints in his 2017 paper
    'Impacts of climate change on European hydrology at 1.5, 2 and 3 degrees mean global warming above preindustrial level'

    Thober's study also says that precipitation will increase sharply in other parts of Europe and that only a small increase in high river flow can have a large impact on the severity of flood events.
    . It is worth noting that a relatively small
    change of 15% in annual maximum may lead to
    substantial changes in flood return periods with
    strong effects on adaptation planning


  • Registered Users Posts: 22,348 ✭✭✭✭Akrasia


    dense wrote: »
    Where's this 400% increase you're talking about?

    in the paper, not in the extract.


  • Registered Users Posts: 8,219 ✭✭✭Gaoth Laidir


    Akrasia wrote: »
    I think I will accept the analysis of the EASAC who have actually read the study rather than just the abstract on this matter.

    Well the findings of the paper must be very different to the abstract then. Have you read the whole paper? If so, do you have a link to it?

    Re. Thober
    This paper relates to projections, the other paper relates to observed impacts. There is more uncertainty with projections than with observed impacts. But regardless, this study says dry areas will have fewer floods, but it still projects more instances of heavy precipitation in much of europe.

    It is just as much a cause for concern as the other report given that it suggests a large reduction in precipitation levels in semi arid regions of Europe. Flooding is the least of their concerns. In areas that rely on snowpack for river flow, the amount of winter precipitation affects the likelyhood of flooding. In these countries, on average winter precipitation might decrease, but floods aren't average events, they're extreme events, so in a year with above average winter precipitation, more intense rainfall will combine with meltwater to cause worse floods.
    This is closer to the picture that Donnelly paints in his 2017 paper
    'Impacts of climate change on European hydrology at 1.5, 2 and 3 degrees mean global warming above preindustrial level'

    But Donnelly's study contradicts several other papers too
    Recently, Donnelly et al (2017) reported higher impacts of climate change on median annual maximum runoff with increasing global temperatures (1.5, 2, and 3 K). Their projected increases in the Mediterranean disagree with Rojas etal(2012),Alfierietal(2015),andGoslingetal(2016) that estimated decreases in floods. These differences may be explained by the employed bias correction of the climate model data, i.e. trend-preserving bias correction in Gosling et al (2016) versus quantile-mapping in Donnelly et al (2017). An European assessment of changes in floods for different warming levels using consistent trend-preserving bias corrected dataset has, however, not been conducted so far.
    Akrasia wrote:
    Thober's study also says that precipitation will increase sharply in other parts of Europe and that only a small increase in high river flow can have a large impact on the severity of flood events.

    Well, I'm not sure where it says sharply. For much of Europe, including the British Isles, changes are limited to <10% either way. Higher flow in northern regions, but less floods. How can this trend translate to an increase in the number of severe floods, as you say?

    That paper also doesn't seem to be seeing any four-, three- or even two-fold increase in floods for many parts of Europe.
    Decreases in flood peaks are reported for Northern Europe in Andréasson et al (2004), Arheimer and Lindstrom (2015), Alfieri et al (2015), Roudier et al (2016) and Donnelly et al (2017). These reductions are caused by increased temperatures that reduce snow accumulation in winter leading to less melting water in spring. Strong decreases in annual precipitation in the
    Mediterranean (Rajczak et al 2013, Alfieriet al 2015) also diminish the magnitude of floods in this region (Rojas et al 2012, Alfieriet al 2015).
    A decrease of floods in this region (Northern region) has been observed in several studies (Arheimer and Lindstrom 2015, Alfieriet al 2015, Roudieretal 2016). Increased temperature in snow dominated regions will alter snow dynamics, in particular decreases in snow pack are projected (Roudier et al 2016,Donnelly et al 2017) that will lead to less spring melt and consequently reduce spring floods. In the past decades, earlier snowmelt lead to a shift in timing of floods in this region (Bloeschl et al 2017).


  • Registered Users Posts: 22,348 ✭✭✭✭Akrasia


    Well the findings of the paper must be very different to the abstract then. Have you read the whole paper? If so, do you have a link to it?

    Re. Thober


    But Donnelly's study contradicts several other papers too


    Well, I'm not sure where it says sharply. For much of Europe, including the British Isles, changes are limited to <10% either way. Higher flow in northern regions, but less floods. How can this trend translate to an increase in the number of severe floods, as you say?

    That paper also doesn't seem to be seeing any four-, three- or even two-fold increase in floods for many parts of Europe.

    The increase in floods reported by EASAC relates to high magnitude and high severity floods. These papers seem to be talking about average flood peaks. Its the extreme events that cost lives and property, normal annual floods are manageable, but if climate change causes increases in the intensity of precipitation events, the number of extreme floods goes up.

    It takes a number of ducks to line up in a row, but if one of those is heavy rainfall, then climate change increases the likelihood of that rainfall happening during the wrong tides. After a period where soil is already saturated.


  • Registered Users Posts: 6,235 ✭✭✭Oneiric 3


    Taking that data and putting it on an absolute vertical scale shows the actual magnitude of the rise relative to the total. Doesn't look so striking now in the overall scheme of things for a 40-year period.

    446832.png

    Widening the scale of the y-axis can be done with pretty much any data in the attempt to show it to be less significant than it is. I agree though, the 'AMO' state clearly has some input into Atlantic air mass moister content, which I did hint at in my original post.

    Anyways, 'vapour pressure' or 'precipitable water' or not, this graph clearly shows that annual rainfall totals are steadily on the rise at Valentia, as they are pretty much over most of the west of Ireland at least, and we have already seen the dire consequences of this, not once, but twice within the last 10 years.

    rCIkE4c.png

    New Moon


  • Registered Users Posts: 8,219 ✭✭✭Gaoth Laidir


    Akrasia wrote: »
    The increase in floods reported by EASAC relates to high magnitude and high severity floods. These papers seem to be talking about average flood peaks. Its the extreme events that cost lives and property, normal annual floods are manageable, but if climate change causes increases in the intensity of precipitation events, the number of extreme floods goes up.

    It takes a number of ducks to line up in a row, but if one of those is heavy rainfall, then climate change increases the likelihood of that rainfall happening during the wrong tides. After a period where soil is already saturated.

    I still haven't seen any actual numbers of these high-impact events. Is it in the hundreds per year or are we talking single figures? A 400% increase in either leads to very different outcomes. I suppose I'll never see these numbers.

    Reduced rainfall southern Europe, a <10% change in a large part of the rest, and some increase in northern parts (but with less flood risk) all leading to an overall increase in flood risk? These are some ducks.


  • Registered Users Posts: 8,219 ✭✭✭Gaoth Laidir


    Oneiric 3 wrote: »
    Widening the scale of the y-axis can be done with pretty much any data in the attempt to show it to be less significant than it is.

    And in the same way, zooming in can exaggerate the trend. In the case of the graph above it's correct to see any changes in light of the overall magnitude of the variable. I agree that e.g. using an absolute Kelvin scale to show a 1-degree temperature change would be useless as we'd just see a straight line.


  • Registered Users Posts: 22,348 ✭✭✭✭Akrasia


    I still haven't seen any actual numbers of these high-impact events. Is it in the hundreds per year or are we talking single figures? A 400% increase in either leads to very different outcomes. I suppose I'll never see these numbers.

    Reduced rainfall southern Europe, a <10% change in a large part of the rest, and some increase in northern parts (but with less flood risk) all leading to an overall increase in flood risk? These are some ducks.
    The numbers are in the graph on that EASAC report. The number of high magnitude floods went from 4 a year to on average to 7 a year on average (large annual variability saw 2010 with 17 events and 2011 with 1 event, the trend is still clear)
    In high severity floods events, it went from 1 flood a year on average to 5 events a year between 1980 and 2016


  • Advertisement
  • Registered Users Posts: 22,348 ✭✭✭✭Akrasia


    And in the same way, zooming in can exaggerate the trend. In the case of the graph above it's correct to see any changes in light of the overall magnitude of the variable. I agree that e.g. using an absolute Kelvin scale to show a 1-degree temperature change would be useless as we'd just see a straight line.

    This is why these graphs usually have the scale set relative to standard deviation rather than an arbitrary selection.


  • Registered Users Posts: 6,235 ✭✭✭Oneiric 3


    Perhaps with regarding climate data, using averages & the deviations surrounding it, rather than the actual values themselves would be more efficient to pick out long term trends.

    New Moon


  • Registered Users Posts: 22,348 ✭✭✭✭Akrasia


    Oneiric 3 wrote: »
    Perhaps with regarding climate data, using averages & the deviations surrounding it, rather than the actual values themselves would be more efficient to pick out long term trends.

    Its a very useful method of analysis. Here's a really clear article showing how these changes have been happening relative to the 1951 to 1981 period

    http://csas.ei.columbia.edu/2016/02/29/regional-climate-change-and-national-responsibilities/

    Fig.-1.2-768x149.png
    Fig.-1.2-768x149.pngFig. 1. Frequency of occurrence of local temperature anomalies (relative to 1951-80 mean) divided by local standard deviation (horizontal axis) for Northern Hemisphere land. Upper row is for summer (Jun-Jul-Aug) and lower row is winter (Dec-Jan-Feb). Further discussion in our 2012 and 2016 papers.[\size]


    Its not peer reviewed but is from a reputable source and the data above comes from peer reviewed papers


  • Registered Users Posts: 8,219 ✭✭✭Gaoth Laidir


    Of course scaling it to the mean and standard deviation is necessary to see the change. Without it we get no information at all. What I was saying was that it's also necessary to see the scale of this change in relation to magnitude of the variable itself. For example, the widely-shown global temperature rise of around 0.85 degrees translates to an actual increase in temperature of only 0.31% (using the absolute temperature scale). A small number mathematically, but of course it does have an effect on the ground. The question is how this 0.31% is split up between natural and man-made drivers.

    An example of where the general public may get a false picture is the Arctic sea ice decline. When scaled to only the level of variation most commonly shown (e.g. here) it may appear that we are reaching an ice-free scenario as the curve reaches the bottom of the chart, which of course is not the case. I have seen this mistake been made several times in the past, though.

    As shown

    446922.png

    Full scale

    446924.png

    The trendline in that reaches zero at around the year 2070. Overall, of course, this makes not one bit of difference to the ice, but my point is that it's not enough only to know the size of the variation but also the overall significance of it.


  • Registered Users Posts: 8,219 ✭✭✭Gaoth Laidir


    Just on the European flood paper above. This is from the original factsheet from the Norwegian Met (Factsheet 3 from here).
    Key messages
    The future magnitude and frequencies of floods are very uncertain, partly because information about the future evolution of the underlying causes is uncertain but also because of other confounding factors, including the effects of human intervention.
    Damage from floods has increased in the past, but evidence linking this to changes in the physical conditions is weak, partly because of a lack of data and partly because of the role of past flood risk management. It seems that there has been a measure of adaptation but that vulnerability has increased economic losses because there is now more and higher-value stock at risk.
    Owing to a large uncertainty of projections for the future, it is currently not possible to devise a scientifically sound procedure for redefining design floods, for example 100-year floods
    According to model-based projections for the future, intense precipitation will increase in much of Europe, accompanying the warming. However, model-based projections of intense precipitation are loaded with much uncertainty.
    Past floods
    A universal increase in flood maxima is not evident in Europe, and observations at individual river gauges in the region provide no conclusive and general proof as to how climate change has affected flood risk in Europe so far. There is evidence, however, that the number of large floods has increased (see Figure 2). Flood damage has risen strongly, but there are multiple factors explaining this. Flood risk and vulnerability tend to increase over many areas in Europe because of a range of climatic and non-climatic impacts whose relative importance is site-specific.
    there are problems with the availability of precipitation data, in general, and with data homogeneity and accuracy, in particular in less developed countries, worldwide. These problems with data are even more severe for heavy precipitation.

    From the latest paper, it's evident that, even if we do take the insurance figures at face value, the original non-normalised losses are not showing such a large increase as has been made out. A slight increasing trend when normalised, but again, this could be down to the switch to a positive AMO, the majority of floods occurring through the central UK. How much is due to agw and not the AMO? That's the question that isn't answered.

    446927.PNG


    446928.PNG

    446929.PNG


  • Registered Users Posts: 6,235 ✭✭✭Oneiric 3


    Just using averages and deviations, this is how the trend in sea ice extent looks for the period Jan 1 - Mar 29 for every year up since 1980 up to the present. Mean used in this case is that of the 1980s:

    y0muEz8.png


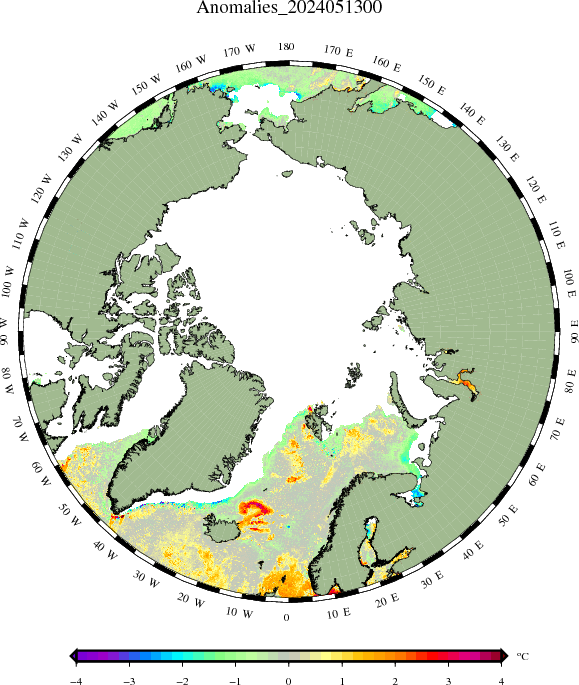
    While this image shows the SST anomalies over the Arctic as of yesterday.

    satanom.arc.d-01.png

    Warmer than average over the greater part, in spite of the fact that colder than average air has been the largely dominant theme in the region over the last couple of weeks.

    Sources: Arctic Data Archive System / DMI.

    New Moon


  • Registered Users Posts: 22,348 ✭✭✭✭Akrasia


    Of course scaling it to the mean and standard deviation is necessary to see the change. Without it we get no information at all. What I was saying was that it's also necessary to see the scale of this change in relation to magnitude of the variable itself. For example, the widely-shown global temperature rise of around 0.85 degrees translates to an actual increase in temperature of only 0.31% (using the absolute temperature scale). A small number mathematically, but of course it does have an effect on the ground. The question is how this 0.31% is split up between natural and man-made drivers.
    I'm not sure why anyone would use the absolute temperature scale to measure global average temperatures given that the very coldest temperature ever recorded in Ireland is around 183k
    Scales need to be relevant to what is being measured. It would make no sense to measure the height of my children on a Kilometer scale

    The average global temperature on any given year is about 14 degrees and there is very little fluctuation year on year, so a 1 degree increase represents a very significant increase in global energy balance and it makes sense to use the temperature anomaly to measure change rather than an absolute scale, which is arbitrary
    An example of where the general public may get a false picture is the Arctic sea ice decline. When scaled to only the level of variation most commonly shown (e.g. here) it may appear that we are reaching an ice-free scenario as the curve reaches the bottom of the chart, which of course is not the case. I have seen this mistake been made several times in the past, though.
    As shown

    446922.png

    Full scale

    446924.png

    The trendline in that reaches zero at around the year 2070. Overall, of course, this makes not one bit of difference to the ice, but my point is that it's not enough only to know the size of the variation but also the overall significance of it.
    It's an easy mistake to correct though.
    And easily avoided by simply taking care to read the numbers on the graph.

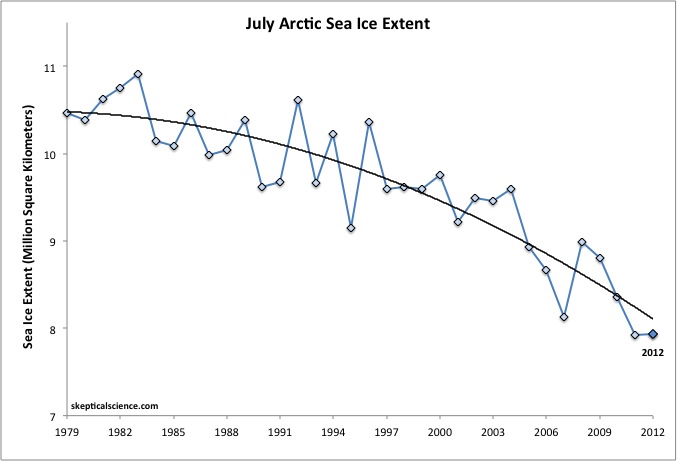
    And on that point, extending the overall trend line to 2070 is also misleading, especially if there is an accelerating change.
    If that trend line was a 5 year average, it would be a downward sloping curve, not a straight line similar to below.
    JulySeaIceExt.jpg
    Extending curve on this trend would show an ice free arctic much earlier than 2070, but of course simply extending the trend isn't a very scientific methodology given the uncertainties in how the arctic region will react to losses in ice


  • Registered Users Posts: 22,348 ✭✭✭✭Akrasia


    Just on the European flood paper above. This is from the original factsheet from the Norwegian Met (Factsheet 3 from here).


    From the latest paper, it's evident that, even if we do take the insurance figures at face value, the original non-normalised losses are not showing such a large increase as has been made out. A slight increasing trend when normalised, but again, this could be down to the switch to a positive AMO, the majority of floods occurring through the central UK. How much is due to agw and not the AMO? That's the question that isn't answered.

    446927.PNG


    446928.PNG

    446929.PNG

    Your post highlights the uncertainty and the non uniform nature of climate change. This doesn't undermine my point. I never said that everywhere would see increases in floods, I just pointed out that increases in the numbers of high magnitude and severity floods have been measured

    The insurance claims graphs show damages increasing, you can argue about the mix affecting the value of claims, we don't have enough data to say for sure one way or another with absolute certainty (although we can infer a link from the data), but high magnitude floods are independently measured and these are increasing too. You can argue about individual events having been exasperated by poor planning decisions, but it seems like a cop out to argue that these factors explain the increase that we're seeing, you'd have to be arguing that flood defenses and planning decisions always serve to make the floods worse, and that flood defenses never protect valuable assets. especially when you acknowledge that moderate and heavy precipitation events are more common than in the past.

    Will climate change cause increased flooding everywhere? No, will it cause reduced flooding in some places and increased flooding in others? That seems to the be consensus from the published research
    Will climate change make the most extreme flooding events more damaging? It seems to be the case from observations, that extreme flood events are more common now than in the past

    Will the places that escape flooding due to climate change benefit from climate change? Not if the trade-off is that they have longer droughts which can be just as devastating as floods are.
    And some unfortunate locations will suffer both more floods, and more drought.

    You mentioned the AMO increasing the risk of UK floods. The AMO is a regional fluctuation which wouldn't explain the changes in flood magnitudes and severity that are affecting asia and pacific regions just as badly as Europe
    If it was just isolated incidents then of course natural variability would be the best explanation, but when these kinds of events happen globally and in line with climate models that predict these changes to precipitation and temperature patterns, than it becomes more than just weather, it is climate change.


  • Registered Users Posts: 8,219 ✭✭✭Gaoth Laidir


    Akrasia wrote: »
    I'm not sure why anyone would use the absolute temperature scale to measure global average temperatures given that the very coldest temperature ever recorded in Ireland is around 183k
    Scales need to be relevant to what is being measured. It would make no sense to measure the height of my children on a Kilometer scale

    The average global temperature on any given year is about 14 degrees and there is very little fluctuation year on year, so a 1 degree increase represents a very significant increase in global energy balance and it makes sense to use the temperature anomaly to measure change rather than an absolute scale, which is arbitrary

    I know, I wasn't recommending showing global temperature in full-scale Kelvin, only showing how small this change is overall. It's obviously an extreme example.

    PS: I don't think anywhere in Ireland has ever recorded 183 K (-90 °C) :pac:
    It's an easy mistake to correct though.
    And easily avoided by simply taking care to read the numbers on the graph.

    And on that point, extending the overall trend line to 2070 is also misleading, especially if there is an accelerating change.
    If that trend line was a 5 year average, it would be a downward sloping curve, not a straight line similar to below.
    JulySeaIceExt.jpg
    Extending curve on this trend would show an ice free arctic much earlier than 2070, but of course simply extending the trend isn't a very scientific methodology given the uncertainties in how the arctic region will react to losses in ice

    I note you conveniently only showed up to 2012, the lowest year on record. We've had 5 more years since, all significantly higher. That would scupper your downward curve somewhat. Here is the chart up to 2017, with the best polynomial fit, showing ice-free not that much earlier than 2070.

    447226.png

    I don't know why sometimes charts are posted deliberately excluding the most up-to-date data.


  • Advertisement
  • Registered Users Posts: 8,219 ✭✭✭Gaoth Laidir


    Akrasia wrote: »
    Your post highlights the uncertainty and the non uniform nature of climate change. This doesn't undermine my point. I never said that everywhere would see increases in floods, I just pointed out that increases in the numbers of high magnitude and severity floods have been measured

    You said that I was overstating the uncertainty. I posted ample evidence to show that I wasn't.
    The insurance claims graphs show damages increasing, you can argue about the mix affecting the value of claims, we don't have enough data to say for sure one way or another with absolute certainty (although we can infer a link from the data), but high magnitude floods are independently measured and these are increasing too. You can argue about individual events having been exasperated by poor planning decisions, but it seems like a cop out to argue that these factors explain the increase that we're seeing, you'd have to be arguing that flood defenses and planning decisions always serve to make the floods worse, and that flood defenses never protect valuable assets. especially when you acknowledge that moderate and heavy precipitation events are more common than in the past.

    The data on flood numbers from that paper are primarily from "news reports", not meteorological data.
    A second figure in the original report (Figure 2.4; updated in Figure 3 below) showed trends in large European floods. As pointed out in that report, severity class 1 includes large flood events, often causing significant human and economic damage, with an estimated (commonly from news reports) mean return period (recurrence interval) of the order of 10–20 years.
    Will climate change cause increased flooding everywhere? No, will it cause reduced flooding in some places and increased flooding in others? That seems to the be consensus from the published research
    Will climate change make the most extreme flooding events more damaging? It seems to be the case from observations, that extreme flood events are more common now than in the past

    Will the places that escape flooding due to climate change benefit from climate change? Not if the trade-off is that they have longer droughts which can be just as devastating as floods are.
    And some unfortunate locations will suffer both more floods, and more drought.

    You mentioned the AMO increasing the risk of UK floods. The AMO is a regional fluctuation which wouldn't explain the changes in flood magnitudes and severity that are affecting asia and pacific regions just as badly as Europe
    If it was just isolated incidents then of course natural variability would be the best explanation, but when these kinds of events happen globally and in line with climate models that predict these changes to precipitation and temperature patterns, than it becomes more than just weather, it is climate change.

    You posted a paper that dealt with European floods, with data based primarily on insurance news reports and insurance figures. If you have papers on these other regions, based on meteorological data, please share them.

    The AMO is a largescale driver throughout much of the North American and European Atlantic regions. Its effects are not only evident in precipitation patterns but also in tropical cyclone activity. It may not directly affect the other side of the world, but it does affect tropical patterns, which could have some indirect effect on monsoons, etc.


Advertisement