Advertisement
If you have a new account but are having problems posting or verifying your account, please email us on hello@boards.ie for help. Thanks :)
Hello all! Please ensure that you are posting a new thread or question in the appropriate forum. The Feedback forum is overwhelmed with questions that are having to be moved elsewhere. If you need help to verify your account contact hello@boards.ie

Global warming slowing down??

Options
1246

Comments

  • Closed Accounts Posts: 1,101 ✭✭✭Weathering


    My initial point was that they didn't foresee for this "pause" when they made their predictions. So when they said it would be x warmer by 2050 they didn't factor in those years when there would be a pause in warming. Just because there was rapid warming after a supposed "pause" before doesn't mean it will happen again.

    For ex if they predicted temperatures would increase by 2 Celsius by 2050 without factoring in x amount of years with a pause in warming/slowing down of warming then I would tend to think the warming by 2050 would be less than the 2 Celsius they previously predicted. As I said before I don't dispute climate change I just don't trust their predictions much any more.


  • Registered Users Posts: 3,055 ✭✭✭Red Nissan


    Akrasia wrote: »
    (Unfortunately)

    It is what it is, we are potentially facing extinction, that's how serious the situation really is.

    It's not unfortunate, it's an opportunity wasted by an experiment, ie mankind, mankind's journey here to today is nothing short of miraculous, the wee wobbles that nearly wiped us out since our journey began some 65 millions years ago after a series of global extinction events allowed us the opportunity [as shrew] to take advantage of the situation.

    To now, perhaps on the cusps of the end of that journey, and what do we do?

    I say go out with dignity. Have a party, we blew it, we should be perhaps 5,000 years more advanced, we are a failure and we all know what nature does with those, we are no different.

    When they shoot the cows, I'll know it's serious. :)


  • Closed Accounts Posts: 922 ✭✭✭FWVT


    Akrasia wrote: »

    The graph above is flat because 2008 was a cold year and this drags down the 5 year average, but 2008 was still hotter than any year prior to 1998, so even an outlier cold year this decade would have broken global temperature records 10 years before.

    No, the graph above is flat because the each year is no warmer than the previous. In other words, there is no net warming.

    The reason why there are so many record-breaking years recently is that the bar has been raised to this new level. This plateau lies above the long-term average, so of course these years are going to be above average, in record-breaking territory. There is nothing alarming about that if the flatline continues. The big question is will it?


  • Closed Accounts Posts: 922 ✭✭✭FWVT


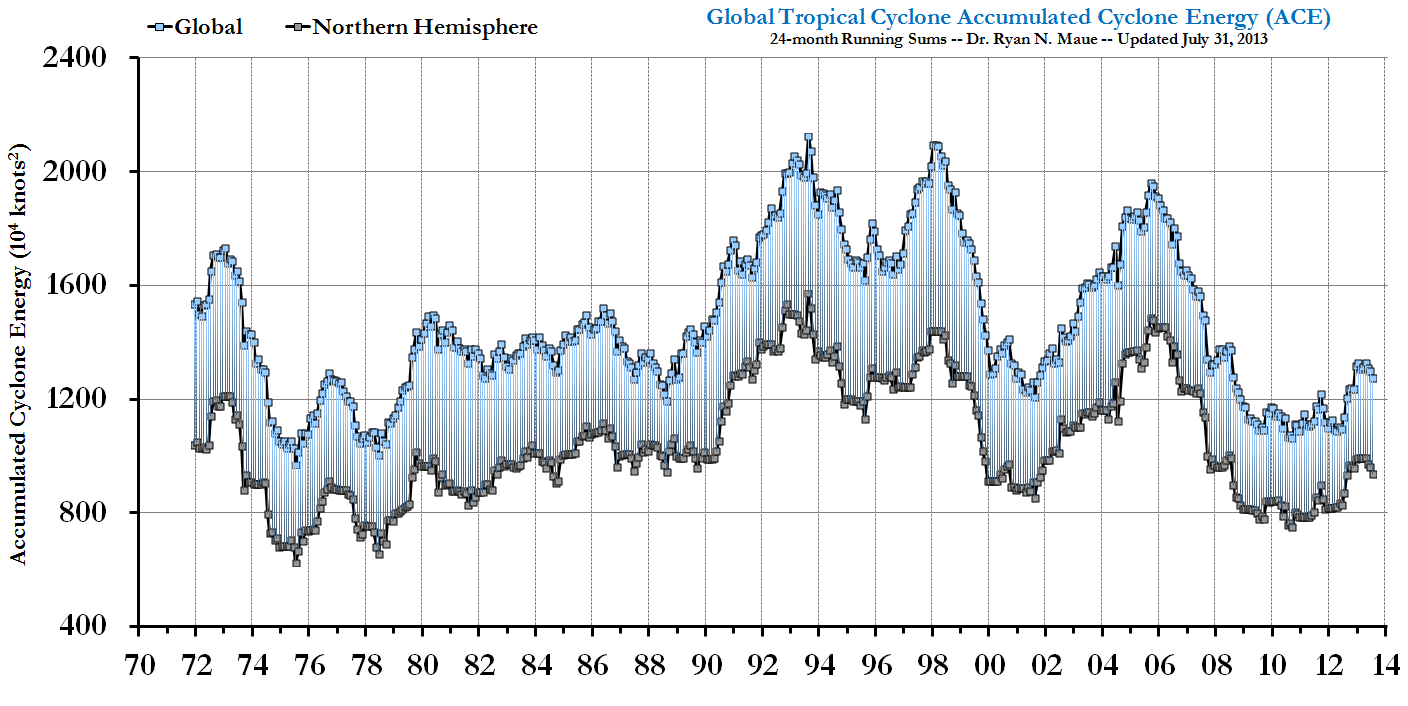
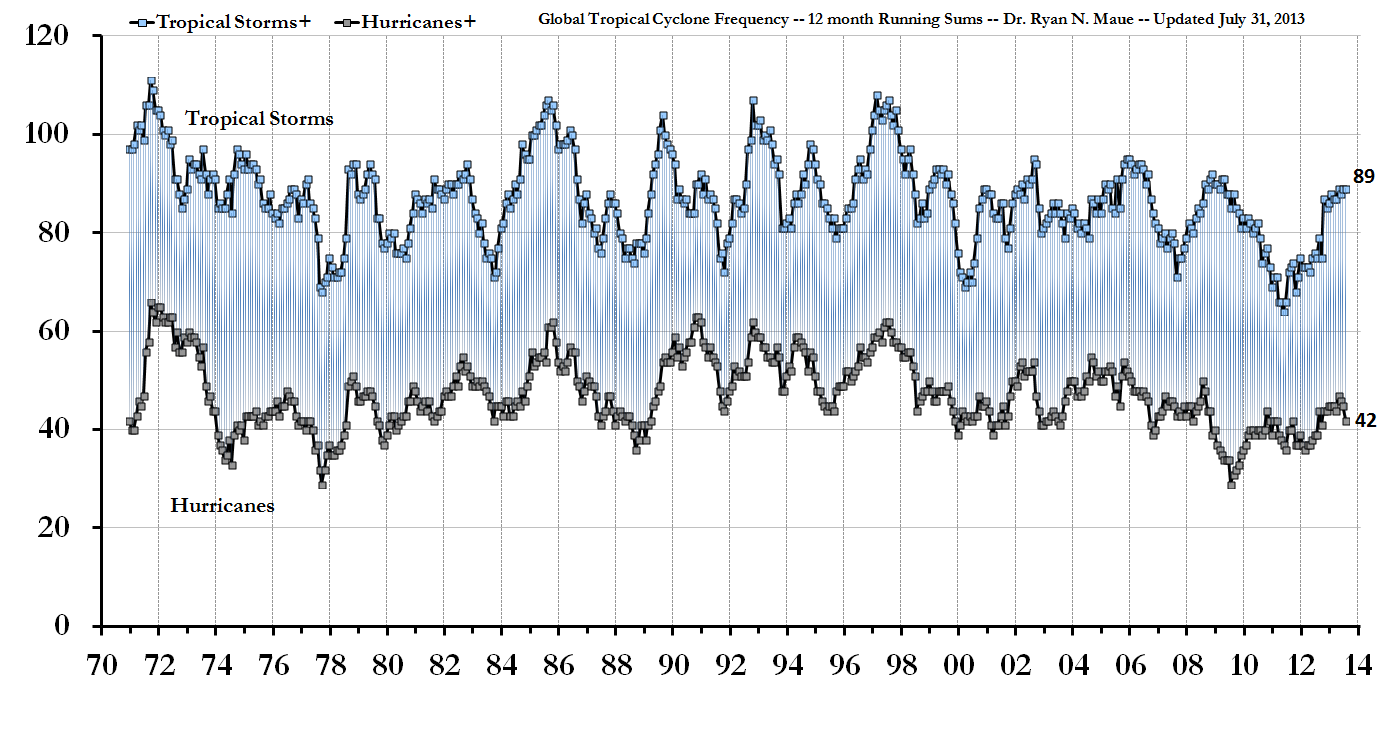
    And getting back to Sparks' claims of increasing tropical activity, for which he could find no up-to-date data, I would like to ask him for his comments on these graphs.

    global_running_ace.jpg

    frequency_12months.png


  • Registered Users Posts: 6,672 ✭✭✭flutered


    scientests seem of the view that the leaking methene gas wells along the east coast of the u.s. do more damaage than china and india, there are more that are not known about scattered about the oceans of the planet.


  • Advertisement
  • Registered Users Posts: 22,243 ✭✭✭✭Akrasia


    Weathering wrote: »
    My initial point was that they didn't foresee for this "pause" when they made their predictions. So when they said it would be x warmer by 2050 they didn't factor in those years when there would be a pause in warming. Just because there was rapid warming after a supposed "pause" before doesn't mean it will happen again.

    For ex if they predicted temperatures would increase by 2 Celsius by 2050 without factoring in x amount of years with a pause in warming/slowing down of warming then I would tend to think the warming by 2050 would be less than the 2 Celsius they previously predicted. As I said before I don't dispute climate change I just don't trust their predictions much any more.

    The models are approximations of reality, a best guess rather than a prediction.

    The predictions are amalgamations of the various different models, and they make their predictions dependent on variables that are uncertain. It is wrong to expect climate models to be weather forecasts. The central message is that increasing CO2 output traps more heat which is distributed within the oceans and atmosphere by various mechanisms, some of which are better understood than others. All climate scientists will emphasise uncertainty in the climate models, and the IPCC only discusses the future climate in terms of how likely they think certain scenarios are, and not how certain they are.

    The consensus is overwhelming that if we carry on the Business as Usual scenario of emissions, we are likely to see catastrophic climate change in the next hundred years and beyond that may be unstoppable once certain positive feedback loops are activated.


  • Registered Users Posts: 22,243 ✭✭✭✭Akrasia


    Red Nissan wrote: »
    It is what it is, we are potentially facing extinction, that's how serious the situation really is.

    It's not unfortunate, it's an opportunity wasted by an experiment, ie mankind, mankind's journey here to today is nothing short of miraculous, the wee wobbles that nearly wiped us out since our journey began some 65 millions years ago after a series of global extinction events allowed us the opportunity [as shrew] to take advantage of the situation.

    To now, perhaps on the cusps of the end of that journey, and what do we do?

    I say go out with dignity. Have a party, we blew it, we should be perhaps 5,000 years more advanced, we are a failure and we all know what nature does with those, we are no different.

    When they shoot the cows, I'll know it's serious. :)
    I presume you're joking?

    I'm actually quite optimistic about our capacity to innovate out of this mess, we have the ingenuity and there are loads of potential technologies that could allow us to move to a post fossil fuel world, but we really really need to move past this climate change denial bullsh1t and work together to find solutions to our problem.


  • Registered Users Posts: 22,243 ✭✭✭✭Akrasia


    FWVT wrote: »
    No, the graph above is flat because the each year is no warmer than the previous. In other words, there is no net warming.

    The reason why there are so many record-breaking years recently is that the bar has been raised to this new level. This plateau lies above the long-term average, so of course these years are going to be above average, in record-breaking territory. There is nothing alarming about that if the flatline continues. The big question is will it?
    Ok, now I know you don't know how to read graphs


  • Registered Users Posts: 17,884 ✭✭✭✭Thargor


    FWVT wrote: »
    No, the graph above is flat because the each year is no warmer than the previous. In other words, there is no net warming.

    The reason why there are so many record-breaking years recently is that the bar has been raised to this new level. This plateau lies above the long-term average, so of course these years are going to be above average, in record-breaking territory. There is nothing alarming about that if the flatline continues. The big question is will it?
    Wow...


  • Registered Users Posts: 22,243 ✭✭✭✭Akrasia


    FWVT wrote: »
    And getting back to Sparks' claims of increasing tropical activity, for which he could find no up-to-date data, I would like to ask him for his comments on these graphs.

    global_running_ace.jpg

    frequency_12months.png

    The first graph shows a significant strengthening of storms on average over the last 40 years

    The second graph shows the frequency of storms diminishing. Both of these graphs are consistent with global warming predictions. There isn't a strong consensus about whether or not there will be more storms, but it definitely predicts that on average, storms will be more powerful (Tropical storms get their energy from the ocean, and warmer oceans feed more energy into the storm systems they create)


  • Advertisement
  • Registered Users Posts: 3,055 ✭✭✭Red Nissan


    Akrasia wrote: »
    I presume you're joking?

    I'm actually quite optimistic about our capacity to innovate out of this mess, we have the ingenuity and there are loads of potential technologies that could allow us to move to a post fossil fuel world, but we really really need to move past this climate change denial bullsh1t and work together to find solutions to our problem.

    We are awash with energy, there never was an oil crisis in the 70s and FULL oil Tankers have been parked off various obscure ports with starving crews until the price of oil increased and then there was no problem with supply juring year 2000 and onwards . I'm a child of the 60's.

    I faced a nuclear missile from the CCCP AND a nuclear missile from the USA as I studied in my classroom in Cork. I suspect you did not.

    Nonetheless, we are facing extinction, I'm not joking, the clue is when they go after the real cause, that's my message.

    If they find it, I'll be as frightened as you.


  • Closed Accounts Posts: 922 ✭✭✭FWVT


    Akrasia wrote: »
    Ok, now I know you don't know how to read graphs

    Really? Please expand?


  • Closed Accounts Posts: 922 ✭✭✭FWVT


    Akrasia wrote: »
    The first graph shows a significant strengthening of storms on average over the last 40 years

    What? The graph is flat overall.
    The second graph shows the frequency of storms diminishing.

    Again, what? That graph is flat too.

    I'm wondering now who it is who can't read graphs!


  • Closed Accounts Posts: 922 ✭✭✭FWVT


    Thargor wrote: »
    Wow...

    You have a problem with that? What is it? Is it incorrect? Spellt out in simple words for all to understand.


  • Closed Accounts Posts: 922 ✭✭✭FWVT


    Oneiric 3 wrote: »
    What kind of 'spectacular' weather events? More spectacular than weather events say a year ago, 23 years ago, 418 year ago, 18,794 years ago?

    Your question was duly ignored.


  • Closed Accounts Posts: 1,101 ✭✭✭Weathering


    Akrasia wrote: »
    The models are approximations of reality, a best guess rather than a prediction.

    The predictions are amalgamations of the various different models, and they make their predictions dependent on variables that are uncertain. It is wrong to expect climate models to be weather forecasts. The central message is that increasing CO2 output traps more heat which is distributed within the oceans and atmosphere by various mechanisms, some of which are better understood than others. All climate scientists will emphasise uncertainty in the climate models, and the IPCC only discusses the future climate in terms of how likely they think certain scenarios are, and not how certain they are.

    The consensus is overwhelming that if we carry on the Business as Usual scenario of emissions, we are likely to see catastrophic climate change in the next hundred years and beyond that may be unstoppable once certain positive feedback loops are activated.

    I didn't say it was a weather forecast. I'm well aware of the co2 argument so please spare me. I also don't dispute climate change. All I'm saying is their predictions can't be taken seriously when they didn't foresee this lull in warming when they made those predictions. Who is to know what else they missed? Time will tell. I can't simplify it any more.


  • Registered Users Posts: 22,243 ✭✭✭✭Akrasia


    FWVT wrote: »
    What? The graph is flat overall.


    Again, what? That graph is flat too.

    I'm wondering now who it is who can't read graphs!
    It's clearly you who cannot read graphs.
    The first graph shows an increase in the power of storms, the second shows a slight decrease in the number of storms.

    It seems you're looking at the start of the graph, and then looking at the end of the graph and comparing them, but ignoring all of the information in between


  • Registered Users Posts: 22,243 ✭✭✭✭Akrasia


    Weathering wrote: »
    I didn't say it was a weather forecast. I'm well aware of the co2 argument so please spare me. I also don't dispute climate change. All I'm saying is their predictions can't be taken seriously when they didn't foresee this lull in warming when they made those predictions. Who is to know what else they missed? Time will tell. I can't simplify it any more.

    Ok, I agree that the future is uncertain. I just disagree with the conclusion that differences between observed climate and the climate models means we should no longer trust the models as a useful indicator of what to expect in the future,

    The climate models are designed for medium to long range climate trends, they don't have the resolution to make predictions about 5 to 10 year periods.

    They are getting better all the time however, and the more data we have the more reliable they will become... but they will never be perfect because the earths climate is a dynamic interaction of multiple complex systems that feed into each other in chaotic unpredictable ways.

    There are still huge gaps in our understanding of what exactly causes the ENSO for example, so until we know more about this, we can not feed those factors into the models to enable better predictions, and even if we do understand how ENSO works today, we can not say that the same mechanisms will still apply given a changed global climate with different ocean and atmospheric currents


  • Closed Accounts Posts: 922 ✭✭✭FWVT


    Akrasia wrote: »
    It's clearly you who cannot read graphs.
    The first graph shows an increase in the power of storms, the second shows a slight decrease in the number of storms.

    It seems you're looking at the start of the graph, and then looking at the end of the graph and comparing them, but ignoring all of the information in between

    Oh please, you're clutching at straws. I am well capable of reading graphs, so your assumption is wrong. First we have Sparks selectively posting an incomplete graph for effect, the we have you claiming trends where there basically are none. Over a 40 year period, where you claim temperature is continually rising along with CO2, the tropical activity is not following. How you can claim that there is any real trend in storm numbers really astounds me. What about the energy? An initial increase, followed by a decrease. Where's all that extra warming showing its teeth?


  • Registered Users Posts: 22,243 ✭✭✭✭Akrasia


    FWVT wrote: »
    Oh please, you're clutching at straws. I am well capable of reading graphs, so your assumption is wrong. First we have Sparks selectively posting an incomplete graph for effect, the we have you claiming trends where there basically are none. Over a 40 year period, where you claim temperature is continually rising along with CO2, the tropical activity is not following. How you can claim that there is any real trend in storm numbers really astounds me. What about the energy? An initial increase, followed by a decrease. Where's all that extra warming showing its teeth?

    The strength of the storms increased by about 20% at their peak. That's a huge impact in only 40 years (but we would need to see a much longer time period to draw conclusions about the long term trend.


  • Advertisement
  • Registered Users Posts: 14,363 ✭✭✭✭M.T. Cranium


    I would have to speculate that the frequency of bland, boring weather patterns is actually the only thing increasing during this era of slight warming. I find the warming signal to be very much of a background thing but it's evident that the diurnal ranges are dropping slowly and that mid-level cloud is increasing; higher level cloud is increasing even faster and that's partly due to changes in technology with increasing air travel over the past half century. This is not a "chemtrails" theory, just the more obvious fact that jets leave behind moisture and some of that quickly forms or at least increases already present expansive cirrus cloud formations.

    I've been watching the weather very closely most of my life and certainly combined with access to extensive historical weather data, my impression (some of it based on actual number crunching) is that severe wind storms are becoming less frequent in the mid-latitudes, tropical storm activity is increasing with a slight uptick in their average intensity, heat waves and warm spells are becoming a bit more frequent and cold spells quite a bit less frequent, in most regions. But the overall impact seems to be largely "marginal" rather than catastrophic, and we're perhaps confusing increased pressures of population (and exposure to risk) with climate change in some cases. For example, no argument that water levels in Lake Mead behind the Hoover Dam (on the Colorado River) are steadily falling but the data show that three quarters of the explanation for that can be found in increased total demand for the water that flows out into aqueducts, whereas one quarter is actually due to ongoing climate change, which in itself may be largely natural cycles at work. The same region saw even more drastic drought cycles back around 1200 AD which led to the mass out-migration of the dominant native tribes at that time and the extinction of their agricultural practices. By the time the climate shifted, they were no longer around to recover, but nobody could plausibly blame any of that on human activity.

    So in short, I tend to be somewhat skeptical about the higher end of climate change alarmist projections and analyses, and figure that it's more of a mixed bag of changes, some of which are actually towards a blander climate.


  • Registered Users Posts: 22,243 ✭✭✭✭Akrasia


    I hope you're right


  • Registered Users Posts: 6,235 ✭✭✭Oneiric 3


    FWVT wrote: »
    Your question was duly ignored.

    Noted.
    Akrasia wrote: »
    but we really really need to move past this climate change denial bullsh1t and work together to find solutions to our problem.

    Do we? Why are the views of a few 'climate deniers' of so much concern to you? Do you need their approval or something in order to seek these solutions?

    New Moon


  • Closed Accounts Posts: 1,101 ✭✭✭Weathering


    I agree wholeheartedly with MT. The point on the increase in the blandness of weather really struck a chord from my own observations. Long spells of complete nothingness seem to be more common nowadays at least for my location. Great post, captured what I was trying to say and more...


  • Registered Users Posts: 22,243 ✭✭✭✭Akrasia


    Weathering wrote: »
    I agree wholeheartedly with MT. The point on the increase in the blandness of weather really struck a chord from my own observations. Long spells of complete nothingness seem to be more common nowadays at least for my location. Great post, captured what I was trying to say and more...

    This comes on the day that Climatologists from NUI Maynooth announced that the winter of 2013/2014 was the stormiest on record in terms of frequency and intensity of storms...


  • Closed Accounts Posts: 1,101 ✭✭✭Weathering


    Akrasia wrote: »
    This comes on the day that Climatologists from NUI Maynooth announced that the winter of 2013/2014 was the stormiest on record in terms of frequency and intensity of storms...

    The highest gust for my location was 65knots. That's pretty standard or lower than normal for any winter for my location. The frequency of gales may have been higher but the severity of winds in relation to the all island highest gust ever recorded in Ireland is low. Plus it's only one Winter. You have to look at overall picture over time and not select one event which suits you. Funny how you didn't quote mt when he mentioned blandness but latched on to my comment.


  • Registered Users Posts: 6,235 ✭✭✭Oneiric 3


    Weathering wrote: »
    The highest gust for my location was 65knots. That's pretty standard or lower than normal for any winter for my location. The frequency of gales may have been higher but the severity of winds in relation to the all island highest gust ever recorded in Ireland is low. .

    Your observation seems to be backed up by the stats Weathering. Plots (from ECA&d) show mean Winter windspeed & max winter gust speed since 1967 at Malin Head.

    320169.png


    320172.png

    And pretty much the same story from other parts of the country. I think what the report focuses is on is not so much the individual strength or frequency of storms, but more the two combined. IE, a high frequency of storms of moderate or reasonable strength.

    Once stand out anomaly last winter would be the consistency of low MSLP values, not just here in Ireland or UK, but over the north Atlantic as well. It was also the wettest winters on record, here locally at least.

    New Moon


  • Closed Accounts Posts: 922 ✭✭✭FWVT


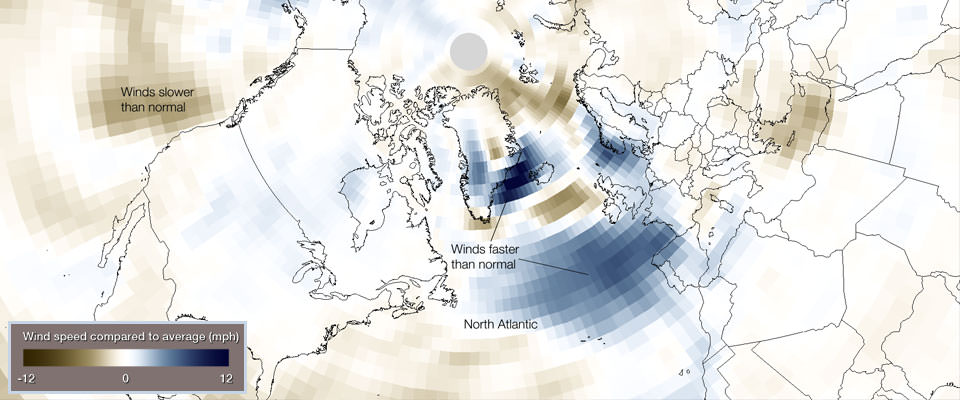
    Here is the wind anomaly chart for the first two months of 2014, during which 14 of the 20 hurricane-force storms developed bombogenetically.

    bombogenesis.jpg

    From here


  • Closed Accounts Posts: 1,101 ✭✭✭Weathering


    Al Gore said in 2007 "The ice cap is falling off a cliff. It could be completely gone in summer in as little as 7 years from now"
    Seven years after former US Vice-President Al Gore's warning, Arctic ice cap has expanded for second year in row. An area twice the size of Alaska - America's biggest state - was open water two years ago and is now covered in ice.

    Various links covering the story


    http://www.dailymail.co.uk/news/article-2738653/Stunning-satellite-images-summer-ice-cap-thicker-covers-1-7million-square-kilometres-MORE-2-years-ago-despite-Al-Gore-s-prediction-ICE-FREE-now.html

    http://www.americanthinker.com/blog/2014/08/arctic_sea_ice_increases_by_43_over_two_years.html

    http://macedoniaonline.eu/content/view/26016/56/


  • Advertisement
  • Posts: 0 [Deleted User]


    Here's a nice graphic of the polar ice cap (the date appears to be skewed though).
    The point is that it is very subjective to decide on what the ice extent actually is, many of the "warmists" who have been having kittens on the minimum ice extent figures in recent years are now saying that this and last year are out of trend, just because the environment isn't following their projected trend!

    arcticictn_nowcast_anim30d.gif


Advertisement