Advertisement
If you have a new account but are having problems posting or verifying your account, please email us on hello@boards.ie for help. Thanks :)
Hello all! Please ensure that you are posting a new thread or question in the appropriate forum. The Feedback forum is overwhelmed with questions that are having to be moved elsewhere. If you need help to verify your account contact hello@boards.ie
Hi there,
There is an issue with role permissions that is being worked on at the moment.
If you are having trouble with access or permissions on regional forums please post here to get access: https://www.boards.ie/discussion/2058365403/you-do-not-have-permission-for-that#latest

An interesting article on the Global warming scandal!

  • 23-01-2010 9:52pm
    #1
    Closed Accounts Posts: 1,530 ✭✭✭


    http://www.americanthinker.com/2010/01/climategate_cru_was_but_the_ti.html
    Climategate: CRU Was But the Tip of the Iceberg
    By Marc Sheppard
    Not surprisingly, the blatant corruption exposed at Britain’s premiere climate institute was not contained within the nation’s borders. Just months after the Climategate scandal broke, a new study has uncovered compelling evidence that our government’s principal climate centers have also been manipulating worldwide temperature data in order to fraudulently advance the global warming political agenda.

    Not only does the preliminary report [PDF] indict a broader network of conspirators, but it also challenges the very mechanism by which global temperatures are measured, published, and historically ranked.

    Last Thursday, Certified Consulting Meteorologist Joseph D’Aleo and computer expert E. Michael Smith appeared together on KUSI TV [Video] to discuss the Climategate -- American Style scandal they had discovered. This time out, the alleged perpetrators are the National Oceanic and Atmospheric Administration (NOAA) and the NASA Goddard Institute for Space Studies (GISS).

    NOAA stands accused by the two researchers of strategically deleting cherry-picked, cooler-reporting weather observation stations from the temperature data it provides the world through its National Climatic Data Center (NCDC). D’Aleo explained to show host and Weather Channel founder John Coleman that while the Hadley Center in the U.K. has been the subject of recent scrutiny, “[w]e think NOAA is complicit, if not the real ground zero for the issue.”

    And their primary accomplices are the scientists at GISS, who put the altered data through an even more biased regimen of alterations, including intentionally replacing the dropped NOAA readings with those of stations located in much warmer locales.

    As you’ll soon see, the ultimate effects of these statistical transgressions on the reports which influence climate alarm and subsequently world energy policy are nothing short of staggering.

    NOAA – Data In / Garbage Out

    Although satellite temperature measurements have been available since 1978, most global temperature analyses still rely on data captured from land-based thermometers, scattered more or less about the planet. It is that data which NOAA receives and disseminates – although not before performing some sleight-of-hand on it.

    Smith has done much of the heavy lifting involved in analyzing the NOAA/GISS data and software, and he chronicles his often frustrating experiences at his fascinating website. There, detail-seekers will find plenty to satisfy, divided into easily-navigated sections -- some designed specifically for us “geeks,” but most readily approachable to readers of all technical strata.

    Perhaps the key point discovered by Smith was that by 1990, NOAA had deleted from its datasets all but 1,500 of the 6,000 thermometers in service around the globe.

    Now, 75% represents quite a drop in sampling population, particularly considering that these stations provide the readings used to compile both the Global Historical Climatology Network (GHCN) and United States Historical Climatology Network (USHCN) datasets. These are the same datasets, incidentally, which serve as primary sources of temperature data not only for climate researchers and universities worldwide, but also for the many international agencies using the data to create analytical temperature anomaly maps and charts.

    Yet as disturbing as the number of dropped stations was, it is the nature of NOAA’s “selection bias” that Smith found infinitely more troubling.

    It seems that stations placed in historically cooler, rural areas of higher latitude and elevation were scrapped from the data series in favor of more urban locales at lower latitudes and elevations. Consequently, post-1990 readings have been biased to the warm side not only by selective geographic location, but also by the anthropogenic heating influence of a phenomenon known as the Urban Heat Island Effect (UHI).

    For example, Canada’s reporting stations dropped from 496 in 1989 to 44 in 1991, with the percentage of stations at lower elevations tripling while the numbers of those at higher elevations dropped to one. That’s right: As Smith wrote in his blog, they left “one thermometer for everything north of LAT 65.” And that one resides in a place called Eureka, which has been described as “The Garden Spot of the Arctic” due to its unusually moderate summers.

    Smith also discovered that in California, only four stations remain – one in San Francisco and three in Southern L.A. near the beach – and he rightly observed that

    It is certainly impossible to compare it with the past record that had thermometers in the snowy mountains. So we can have no idea if California is warming or cooling by looking at the USHCN data set or the GHCN data set.

    That’s because the baseline temperatures to which current readings are compared were a true averaging of both warmer and cooler locations. And comparing these historic true averages to contemporary false averages – which have had the lower end of their numbers intentionally stripped out – will always yield a warming trend, even when temperatures have actually dropped.

    Overall, U.S. online stations have dropped from a peak of 1,850 in 1963 to a low of 136 as of 2007. In his blog, Smith wittily observed that “the Thermometer Langoliers have eaten 9/10 of the thermometers in the USA[,] including all the cold ones in California.” But he was deadly serious after comparing current to previous versions of USHCN data and discovering that this “selection bias” creates a +0.6°C warming in U.S. temperature history.

    And no wonder -- imagine the accuracy of campaign tracking polls were Gallup to include only the replies of Democrats in their statistics. But it gets worse.

    Prior to publication, NOAA effects a number of “adjustments” to the cherry-picked stations’ data, supposedly to eliminate flagrant outliers, adjust for time of day heat variance, and “homogenize” stations with their neighbors in order to compensate for discontinuities. This last one, they state, is accomplished by essentially adjusting each to jive closely with the mean of its five closest “neighbors.” But given the plummeting number of stations, and the likely disregard for the latitude, elevation, or UHI of such neighbors, it’s no surprise that such “homogenizing” seems to always result in warmer readings.

    The chart below is from Willis Eschenbach’s WUWT essay, “The smoking gun at Darwin Zero,” and it plots GHCN Raw versus homogeneity-adjusted temperature data at Darwin International Airport in Australia. The “adjustments” actually reversed the 20th-century trend from temperatures falling at 0.7°C per century to temperatures rising at 1.2°C per century. Eschenbach isolated a single station and found that it was adjusted to the positive by 6.0°C per century, and with no apparent reason, as all five stations at the airport more or less aligned for each period. His conclusion was that he had uncovered “indisputable evidence that the ‘homogenized’ data has been changed to fit someone’s preconceptions about whether the earth is warming.”


    WUWT’s editor, Anthony Watts, has calculated the overall U.S. homogeneity bias to be 0.5°F to the positive, which alone accounts for almost one half of the 1.2°F warming over the last century. Add Smith’s selection bias to the mix and poof – actual warming completely disappears!

    Yet believe it or not, the manipulation does not stop there.

    GISS – Garbage In / Globaloney Out

    The scientists at NASA’s GISS are widely considered to be the world’s leading researchers into atmospheric and climate changes. And their Surface Temperature (GISTemp) analysis system is undoubtedly the premiere source for global surface temperature anomaly reports.

    In creating its widely disseminated maps and charts, the program merges station readings collected from the Scientific Committee on Antarctic Research (SCAR) with GHCN and USHCN data from NOAA.

    It then puts the merged data through a few “adjustments” of its own.

    First, it further “homogenizes” stations, supposedly adjusting for UHI by (according to NASA) changing “the long term trend of any non-rural station to match the long term trend of their rural neighbors, while retaining the short term monthly and annual variations.” Of course, the reduced number of stations will have the same effect on GISS’s UHI correction as it did on NOAA’s discontinuity homogenization – the creation of artificial warming.

    Furthermore, in his communications with me, Smith cited boatloads of problems and errors he found in the Fortran code written to accomplish this task, ranging from hot airport stations being mismarked as “rural” to the “correction” having the wrong sign (+/-) and therefore increasing when it meant to decrease or vice-versa.

    And according to NASA, “If no such neighbors exist or the overlap of the rural combination and the non-rural record is less than 20 years, the station is completely dropped; if the rural records are shorter, part of the non-rural record is dropped.”

    However, Smith points out that a dropped record may be “from a location that has existed for 100 years.” For instance, if an aging piece of equipment gets swapped out, thereby changing its identification number, the time horizon reinitializes to zero years. Even having a large enough temporal gap (e.g., during a world war) might cause the data to “just get tossed out.”

    But the real chicanery begins in the next phase, wherein the planet is flattened and stretched onto an 8,000-box grid, into which the time series are converted to a series of anomalies (degree variances from the baseline). Now, you might wonder just how one manages to fill 8,000 boxes using 1,500 stations.

    Here’s NASA’s solution:

    For each grid box, the stations within that grid box and also any station within 1200km of the center of that box are combined using the reference station method.

    Even on paper, the design flaws inherent in such a process should be glaringly obvious.

    So it’s no surprise that Smith found many examples of problems surfacing in actual practice. He offered me Hawaii for starters. It seems that all of the Aloha State’s surviving stations reside in major airports. Nonetheless, this unrepresentative hot data is what’s used to “infill” the surrounding “empty” Grid Boxes up to 1200 km out to sea. So in effect, you have “jet airport tarmacs ‘standing in’ for temperature over water 1200 km closer to the North Pole.”

    An isolated problem? Hardly, reports Smith.

    From KUSI’s Global Warming: The Other Side:

    “There’s a wonderful baseline for Bolivia -- a very high mountainous country -- right up until 1990 when the data ends. And if you look on the [GISS] November 2009 anomaly map, you’ll see a very red rosy hot Bolivia [boxed in blue]. But how do you get a hot Bolivia when you haven’t measured the temperature for 20 years?”


    Of course, you already know the answer: GISS simply fills in the missing numbers – originally cool, as Bolivia contains proportionately more land above 10,000 feet than any other country in the world – with hot ones available in neighboring stations on a beach in Peru or somewhere in the Amazon jungle.

    Remember that single station north of 65° latitude which they located in a warm section of northern Canada? Joe D’Aleo explained its purpose: “To estimate temperatures in the Northwest Territory [boxed in green above], they either have to rely on that location or look further south.”

    Pretty slick, huh?

    And those are but a few examples. In fact, throughout the entire grid, cooler station data are dropped and “filled in” by temperatures extrapolated from warmer stations in a manner obviously designed to overestimate warming...

    ...And convince you that it’s your fault.

    Government and Intergovernmental Agencies -- Globaloney In / Green Gospel Out

    Smith attributes up to 3°F (more in some places) of added “warming trend” between NOAA’s data adjustment and GIStemp processing.

    That’s over twice last century’s reported warming.

    And yet, not only are NOAA’s bogus data accepted as green gospel, but so are its equally bogus hysterical claims, like this one from the 2006 annual State of the Climate in 2005 [PDF]: “Globally averaged mean annual air temperature in 2005 slightly exceeded the previous record heat of 1998, making 2005 the warmest year on record.”

    And as D’Aleo points out in the preliminary report, the recent NOAA proclamation that June 2009 was the second-warmest June in 130 years will go down in the history books, despite multiple satellite assessments ranking it as the 15th-coldest in 31 years.

    Even when our own National Weather Service (NWS) makes its frequent announcements that a certain month or year was the hottest ever, or that five of the warmest years on record occurred last decade, they’re basing such hyperbole entirely on NOAA’s warm-biased data.

    And how can anyone possibly read GISS chief James Hansen’s Sunday claim that 2009 was tied with 2007 for second-warmest year overall, and the Southern Hemisphere’s absolute warmest in 130 years of global instrumental temperature records, without laughing hysterically? It's especially laughable when one considers that NOAA had just released a statement claiming that very same year (2009) to be tied with 2006 for the fifth-warmest year on record.

    So how do alarmists reconcile one government center reporting 2009 as tied for second while another had it tied for fifth? If you’re WaPo’s Andrew Freedman, you simply chalk it up to “different data analysis methods” before adjudicating both NASA and NOAA innocent of any impropriety based solely on their pointless assertions that they didn’t do it.

    Earth to Andrew: “Different data analysis methods”? Try replacing “analysis” with “manipulation,” and ye shall find enlightenment. More importantly, does the explicit fact that since the drastically divergent results of both “methods” can’t be right, both are immediately suspect somehow elude you?

    But by far the most significant impact of this data fraud is that it ultimately bubbles up to the pages of the climate alarmists’ bible: The United Nations Intergovernmental Panel on Climate Change Assessment Report.

    And wrong data begets wrong reports, which – particularly in this case – begets dreadfully wrong policy.

    It’s High Time We Investigated the Investigators

    The final report will be made public shortly, and it will be available at the websites of both report-supporter Science and Public Policy Institute and Joe D’Aleo’s own ICECAP. As they’ve both been tremendously helpful over the past few days, I’ll trust in the opinions I’ve received from the report’s architects to sum up.

    This from the meteorologist:

    The biggest gaps and greatest uncertainties are in high latitude areas where the data centers say they 'find' the greatest warming (and thus which contribute the most to their global anomalies). Add to that no adjustment for urban growth and land use changes (even as the world's population increased from 1.5 to 6.7 billion people) [in the NOAA data] and questionable methodology for computing the historical record that very often cools off the early record and you have surface based data sets so seriously flawed, they can no longer be trusted for climate trend or model forecast assessment or decision making by the administration, congress or the EPA.

    Roger Pielke Sr. has suggested: “...that we move forward with an inclusive assessment of the surface temperature record of CRU, GISS and NCDC. We need to focus on the science issues. This necessarily should involve all research investigators who are working on this topic, with formal assessments chaired and paneled by mutually agreed to climate scientists who do not have a vested interest in the outcome of the evaluations.” I endorse that suggestion.

    Certainly, all rational thinkers agree. Perhaps even the mainstream media, most of whom have hitherto mistakenly dismissed Climategate as a uniquely British problem, will now wake up and demand such an investigation.

    And this from the computer expert:

    That the bias exists is not denied. That the data are too sparse and with too many holes over time in not denied. Temperature series programs, like NASA GISS GIStemp try, but fail, to fix the holes and the bias. What is claimed is that "the anomaly will fix it." But it cannot. Comparison of a cold baseline set to a hot present set must create a biased anomaly. It is simply overwhelmed by the task of taking out that much bias. And yet there is more. A whole zoo of adjustments are made to the data. These might be valid in some cases, but the end result is to put in a warming trend of up to several degrees. We are supposed to panic over a 1/10 degree change of "anomaly" but accept 3 degrees of "adjustment" with no worries at all. To accept that GISTemp is "a perfect filter". That is, simply, "nuts". It was a good enough answer at Bastogne, and applies here too.

    Smith, who had a family member attached to the 101st Airborne at the time, refers to the famous line from the 101st commander, U.S. Army General Anthony Clement McAuliffe, who replied to a German ultimatum to surrender the December, 1944 Battle of Bastogne, Belgium with a single word: “Nuts.”

    And that’s exactly what we’d be were we to surrender our freedoms, our economic growth, and even our simplest comforts to duplicitous zealots before checking and double-checking the work of the prophets predicting our doom should we refuse.

    Marc Sheppard is environment editor of American Thinker and editor of the forthcoming Environment Thinker
    .

    Hopefully we'll start to get proper research and figures when people realise the crap that was going on!
    Tagged:


«1

Comments

  • Registered Users, Registered Users 2 Posts: 2,604 ✭✭✭200motels


    An exellent read, I've always had my doubts.


  • Closed Accounts Posts: 1,530 ✭✭✭TheInquisitor


    And another one from the times today!!

    http://www.timesonline.co.uk/tol/news/environment/article7000063.ece?token=null&offset=0&page=1
    UN wrongly linked global warming to natural disasters
    Jonathan Leake, Science and Environment Editor


    THE United Nations climate science panel faces new controversy for wrongly linking global warming to an increase in the number and severity of natural disasters such as hurricanes and floods.

    It based the claims on an unpublished report that had not been subjected to routine scientific scrutiny — and ignored warnings from scientific advisers that the evidence supporting the link too weak. The report's own authors later withdrew the claim because they felt the evidence was not strong enough.

    The claim by the Intergovernmental Panel on Climate Change (IPCC), that global warming is already affecting the severity and frequency of global disasters, has since become embedded in political and public debate. It was central to discussions at last month's Copenhagen climate summit, including a demand by developing countries for compensation of $100 billion (£62 billion) from the rich nations blamed for creating the most emissions.

    Ed Miliband, the energy and climate change minister, has suggested British and overseas floods — such as those in Bangladesh in 2007 — could be linked to global warming. Barack Obama, the US president, said last autumn: "More powerful storms and floods threaten every continent."
    Background

    Last month Gordon Brown, the prime minister, told the Commons that the financial agreement at Copenhagen "must address the great injustice that . . . those hit first and hardest by climate change are those that have done least harm".

    The latest criticism of the IPCC comes a week after reports in The Sunday Times forced it to retract claims in its benchmark 2007 report that the Himalayan glaciers would be largely melted by 2035. It turned out that the bogus claim had been lifted from a news report published in 1999 by New Scientist magazine.

    The new controversy also goes back to the IPCC's 2007 report in which a separate section warned that the world had "suffered rapidly rising costs due to extreme weather-related events since the 1970s".

    It suggested a part of this increase was due to global warming and cited the unpublished report, saying: "One study has found that while the dominant signal remains that of the significant increases in the values of exposure at risk, once losses are normalised for exposure, there still remains an underlying rising trend."

    The Sunday Times has since found that the scientific paper on which the IPCC based its claim had not been peer reviewed, nor published, at the time the climate body issued its report.

    When the paper was eventually published, in 2008, it had a new caveat. It said: "We find insufficient evidence to claim a statistical relationship between global temperature increase and catastrophe losses."

    Despite this change the IPCC did not issue a clarification ahead of the Copenhagen climate summit last month. It has also emerged that at least two scientific reviewers who checked drafts of the IPCC report urged greater caution in proposing a link between climate change and disaster impacts — but were ignored.

    The claim will now be re-examined and could be withdrawn. Professor Jean-Pascal van Ypersele, a climatologist at the Universite Catholique de Louvain in Belgium, who is vice-chair of the IPCC, said: "We are reassessing the evidence and will publish a report on natural disasters and extreme weather with the latest findings. Despite recent events the IPCC process is still very rigorous and scientific."


    The academic paper at the centre of the latest questions was written in 2006 by Robert Muir-Wood, head of research at Risk Management Solutions, a London consultancy, who later became a contributing author to the section of the IPCC's 2007 report dealing with climate change impacts. He is widely respected as an expert on disaster impacts.

    Muir-Wood wanted to find out if the 8% year-on-year increase in global losses caused by weather-related disasters since the 1960s was larger than could be explained by the impact of social changes like growth in population and infrastructure.

    Such an increase, coinciding with rising temperatures, might suggest that global warming was to blame. If proven this would be highly significant, both politically and scientifically, because it would confirm the many predictions that global warming will increase the frequency and severity of natural hazards.

    In the research Muir-Wood looked at a wide range of hazards, including tropical cyclones, thunder and hail storms, and wildfires as well as floods and hurricanes.
    Background

    He found from 1950 to 2005 there was no increase in the impact of disasters once growth was accounted for. For 1970-2005, however, he found a 2% annual increase which "corresponded with a period of rising global temperatures,"

    Muir-Wood was, however, careful to point out that almost all this increase could be accounted for by the exceptionally strong hurricane seasons in 2004 and 2005. There were also other more technical factors that could cause bias, such as exchange rates which meant that disasters hitting the US would appear to cost proportionately more in insurance payouts.

    Despite such caveats, the IPCC report used the study in its section on disasters and hazards, but cited only the 1970-2005 results.

    The IPCC report said: "Once the data were normalised, a small statistically significant trend was found for an increase in annual catastrophe loss since 1970 of 2% a year." It added: "Once losses are normalised for exposure, there still remains an underlying rising trend."

    Muir-Wood's paper was originally commissioned by Roger Pielke, professor of environmental studies at Colorado University, also an expert on disaster impacts, for a workshop on disaster losses in 2006. The researchers who attended that workshop published a statement agreeing that so far there was no evidence to link global warming with any increase in the severity or frequency of disasters. Pielke has also told the IPCC that citing one section of Muir-Wood's paper in preference to the rest of his work, and all the other peer-reviewed literature, was wrong.

    He said: "All the literature published before and since the IPCC report shows that rising disaster losses can be explained entirely by social change. People have looked hard for evidence that global warming plays a part but can't find it. Muir-Wood's study actually confirmed that."

    Mike Hulme, professor of climate change at the Tyndall Centre, which advises the UK government on global warming, said there was no real evidence that natural disasters were already being made worse by climate change. He said: “A proper analysis shows that these claims are usually superficial”

    Such warnings may prove uncomfortable for Miliband whose recent speeches have often linked climate change with disasters such as the floods that recently hit Bangladesh and Cumbria. Last month he said: “We must not let the sceptics pass off political opinion as scientific fact. Events in Cumbria give a foretaste of the kind of weather runaway climate change could bring. Abroad, the melting of the Himalayan glaciers that feed the great rivers of South Asia could put hundreds of millions of people at risk of drought. Our security is at stake.”

    Muir-Wood himself is more cautious. He said: "The idea that catastrophes are rising in cost partly because of climate change is completely misleading. "We could not tell if it was just an association or cause and effect. Also, our study included 2004 and 2005 which was when there were some major hurricanes. If you took those years away then the significance of climate change vanished."

    Some researchers have argued that it is unfair to attack the IPCC too strongly, pointing out that some errors are inevitable in a report as long and technical as the IPCC's round-up of climate science. "Part of the problem could simply be that expectations are too high," said one researcher. "We have been seen as a scientific gold standard and that's hard to live up to."

    Professor Christopher Field,director of the Department of Global Ecology at the Carnegie Institution in California, who is the new co-chairman of the IPCC working group overseeing the climate impacts report, said the 2007 report had been broadly accurate at the time it was written.

    He said: “The 2007 study should be seen as “a snapshot of what was known then. Science is progressive. If something turns out to be wrong we can fix it next time around.” However he confirmed he would be introducing rigorous new review procedures for future reports to ensure errors were kept to a minimum.


  • Banned (with Prison Access) Posts: 25,234 ✭✭✭✭Sponge Bob


    Most of the original research on the GISTEMP scandal, including the Bolivian interpolation from Brazil and the Templehof airport fiddling is done by a blogger named Chiefio. I think that is Mr Smith.

    I have been researching it for some time....before I form a really hard opinion. I confess I cannot find any major faults with what Chiefio is saying so far. But I need to so some more research. Here is the blog itself.

    http://chiefio.wordpress.com/

    Here is his an explanation of the deconstruction of GISTEMP, this is the overview article you should start with.

    http://chiefio.wordpress.com/2009/11/09/gistemp-a-human-view/

    Basically he says high altitude and latitude data is being deliberately discarded for low altitude and low latitude temperature series over time and absent this data the world is provably hot.

    Nobody seems to have rebutted Chiefio since he really got in gear some time before Climategate in mid 2009.

    From the latter link.
    Since about 1990, there has been a reduction in thermometer counts globally. In the USA, the number has dropped from 1850 at peak (in the year 1968) to 136 now (in the year 2009). As you might guess, this has presented some “issues” for our thermal quilt. But do not fear, GIStemp will fill in what it needs, guessing as needed, stretching and fabricating until it has a result. In Japan, no thermometers now record above 300 meters. Japan has no mountains now. For California, where we once had thermometers in the mountain snow and in the far north near Oregon; there are now 4 surviving thermometers near the beach and in the warm south. But GIStemp is sure we can use them as a fine proxy for Mount Shasta with it’s glaciers and for the snows and ice of Yosemite winters.

    And there is a LOT of stuff on this blog. Form your own opinion please.


  • Banned (with Prison Access) Posts: 25,234 ✭✭✭✭Sponge Bob


    GISTEMP has a weather station list here

    Each station has a numeric code. However Chiefio maintains that some substitution takes place within the dataset before processes are run.

    This interpolation process is explained vis a vis California in this post here

    The Irish selection of stations looks perfectly good....as long as real data is not discarded and something near Bordeaux is 'interpolated' against Shannon or Malin for some reason.
     39520000 ROCHES POINT                     lat,lon (.1deg)  518   -82 R B cc=621    0
     39530005 VALENTIA OBSE                    lat,lon (.1deg)  519  -102 R A cc=621    0
     39550004 CORK AIRPORT                     lat,lon (.1deg)  519   -85 U C cc=621   12
     39570000 ROSSLARE                         lat,lon (.1deg)  523   -63 R B cc=621   11
     39600002 KILKENNY                         lat,lon (.1deg)  527   -73 S C cc=621   20
     39620005 SHANNON AIRPO                    lat,lon (.1deg)  527   -89 R B cc=621   12
     39650001 BIRR                             lat,lon (.1deg)  531   -79 R A cc=621    0
     39670000 CASEMENT AERO                    lat,lon (.1deg)  533   -64 U C cc=621   24
     39690003 DUBLIN AIRPOR                    lat,lon (.1deg)  534   -62 U C cc=621   33
     39700001 CLAREMORRIS                      lat,lon (.1deg)  537   -90 R B cc=621    7
     39710000 MULLINGAR                        lat,lon (.1deg)  535   -74 R C cc=621   10
     39740001 CLONES                           lat,lon (.1deg)  542   -72 R A cc=621    0
     39760004 BELMULLET                        lat,lon (.1deg)  542  -100 R A cc=621    6
     39800004 MALIN HEAD                       lat,lon (.1deg)  554   -73 R A cc=621    0
    

    The current selection for the UK is pretty catholic to my mind .
    30260001 STORNOWAY                        lat,lon (.1deg)  582   -63 R B cc=651    7
     30380000 FORT WILLIAM                     lat,lon (.1deg)  568   -51 R C cc=651   13
     30380010 BEN NEVIS           UK           lat,lon (.1deg)  568   -51 R B cc=651    0
     30550010 ORKNEY              UK           lat,lon (.1deg)  591   -33 R A cc=651    0
     30680010 GORDON CASTLE       UK           lat,lon (.1deg)  576   -31 R A cc=651    0
     30720010 BRAEMAR             UK           lat,lon (.1deg)  570   -34 R A cc=651    0
     30910001 ABERDEEN/DYCE                    lat,lon (.1deg)  572   -22 U C cc=651   26
     31000001 TIREE                            lat,lon (.1deg)  565   -69 R A cc=651    0
     31400000 GLASGOW AIRPO                    lat,lon (.1deg)  559   -44 U C cc=651   46
     31600001 EDINBURGH AIR                    lat,lon (.1deg)  560   -33 U C cc=651   29
     31600010 EDINBURGH/ROYAL OBS.UK           lat,lon (.1deg)  559   -32 U C cc=651   24
     31620003 ESKDALEMUIR                      lat,lon (.1deg)  553   -32 R A cc=651    0
     32090010 DUMFRIES            UK           lat,lon (.1deg)  551   -31 S A cc=651    0
     32410010 COCKLE PARK         UK           lat,lon (.1deg)  552   -16 R C cc=651   20
     32420010 DURHAM              UK           lat,lon (.1deg)  548   -16 U C cc=651   25
     32570001 LEEMING                          lat,lon (.1deg)  543   -15 R B cc=651    9
     32920010 SCARBOROUGH         UK           lat,lon (.1deg)  542    -4 S B cc=651    0
     33020001 VALLEY                           lat,lon (.1deg)  533   -45 R B cc=651    7
     33160010 BIDSTON             UK           lat,lon (.1deg)  534   -29 U C cc=651   41
     33290010 STONYHURST          UK           lat,lon (.1deg)  538   -25 R C cc=651   15
     33340001 MANCHESTER AI                    lat,lon (.1deg)  534   -23 U C cc=651   22
     33450010 SHEFFIELD           UK           lat,lon (.1deg)  534   -15 U C cc=651   52
     33550010 YORK                UK           lat,lon (.1deg)  539   -11 U A cc=651    7
     33770000 WADDINGTON                       lat,lon (.1deg)  532    -5 U C cc=651   12
     34960010 GORLESTON                        lat,lon (.1deg)  526    17 U C cc=651   21
     35010010 ABERYSTWYTH         UK           lat,lon (.1deg)  524   -41 S A cc=651   13
     35210010 ROSS-ON-WYE         UK           lat,lon (.1deg)  519   -26 R C cc=651    8
     35340001 BIRMINGHAM/AI                    lat,lon (.1deg)  525   -17 U C cc=651   25
     35340010 EDGBASTON           UK           lat,lon (.1deg)  525   -19 U C cc=651   88
     36570010 OXFORD              UK           lat,lon (.1deg)  517   -12 U B cc=651    8
     36700010 ROTHAMSTEAD         UK           lat,lon (.1deg)  517    -3 U C cc=651   22
     36720010 KEW                 UK           lat,lon (.1deg)  515    -3 U C cc=651   53
     36830020 CAMBRIDGE           UK           lat,lon (.1deg)  522     1 U C cc=651   25
     36960010 FELIXSTOWE                       lat,lon (.1deg)  520    13 S C cc=651   18
     37150000 GLAMORGAN/RHOUSE AP              lat,lon (.1deg)  514   -34 U B cc=651   13
     37430000 LARKHILL                         lat,lon (.1deg)  512   -18 R A cc=651   15
     37760001 LONDON/GATWIC                    lat,lon (.1deg)  512    -2 U C cc=651   29
     37790010 GREENWICH/MARITIME MUK           lat,lon (.1deg)  515     0 U C cc=651   67
     38170010 TRURO               UK           lat,lon (.1deg)  503   -51 S B cc=651    7
     38270001 PLYMOUTH WC                      lat,lon (.1deg)  504   -41 U C cc=651   19
     38620001 BOURNEMOUTH A                    lat,lon (.1deg)  508   -18 U C cc=651   14
     38650000 SOUTHAMPTON/                     lat,lon (.1deg)  509   -14 U C cc=651   26
     38740010 OSBORNE             UK           lat,lon (.1deg)  508   -13 R C cc=651    0
     38940000 GUERNSEY AIRP                    lat,lon (.1deg)  494   -26 S B cc=651   13
     39170003 BELFAST/ALDER                    lat,lon (.1deg)  547   -62 U B cc=651   13


  • Registered Users, Registered Users 2 Posts: 26,578 ✭✭✭✭Turtwig


    *Sigh*
    Chiefo's a creationist do I really need to go any further than that? At least, quote from reputable sources, not some online blogger doing his own research with obvious religious agendas.:rolleyes:


  • Advertisement
  • Banned (with Prison Access) Posts: 25,234 ✭✭✭✭Sponge Bob


    Now to the stations that are actually used in Ireland .

    Some weather stations like Galway and Claremorris no longer exist.

    Click on http://data.giss.nasa.gov/cgi-bin/gistemp/findstation.py?lat=53.08&lon=-7.88&datatype=gistemp&data_set=1

    You will note that the stations used for the current GISTemp model series are a subset of all stations for purposes of global warming modelling , that list is everything within 500km of Birr. Note dates on right please.

    The stations from which data is currently extracted is "heavy on the airports" which is one of the serious accusations made against GISTemp.I will address that later in this post.

    Dublin Casement Belfast Aldergrove and Cork airports are used. So are Malin and Valentia and Belmullet and Rosslare was recently discarded but Johnstown Castle nearby was not introduced. The rest are ignored

    The pattern evident there is that ALL stations used for modelling are either coastal or located in an airport.

    No rural stations are used at all.....meaning inland but not airports , they have been DISCARDED.

    Chiefio explains his 'issues' with airports in this post here

    http://chiefio.wordpress.com/2009/08/23/gistemp-fixes-uhi-using-airports-as-rural/

    Do note Chiefios 'issues with CONCRETE, that is essential.


    I also have issues with the overall selection of inland stations USED to model Ireland ...none really with the coastal selection.

    But from now on you must start RUNNING the model to see if stations are substitued for stations on an actual model run ....and when and why...eg whether Casement becomes Orly or Shannon becomes Stansted.

    I have not run the model and am NOT SAYING IT HAPPENS .....but inevitably one must run the model and find out if data is beng substituted out during runs and the effect thereof.

    That is when it gets really complicated and proving anything would be a group effort.

    You do however know that an ideologically fascist green like Eamon Ryan will not fund your efforts or engage with you in any way and so you are on your own against official Ireland which has bought into Global warming and carbon taxes.

    Like the feckin x files, only for real :cool:


  • Closed Accounts Posts: 5,150 ✭✭✭Deep Easterly


    Malty_T wrote: »
    *Sigh*
    Chiefo's a creationist do I really need to go any further than that? At least, quote from reputable sources, not some online blogger doing his own research with obvious religious agendas.:rolleyes:

    'Reputable' is fast becoming a relative term regarding this issue.

    Off topic, I am beginning to wonder lately why the 61-90 average is still being used in most cases today regarded current monthly and yearly figures as a 'normal'. Even our own met eireann still use it to compare current values; surely it is about time it was upped to the 71-00 normal by now? Give another year, and we could be using the 81-10 average.


  • Registered Users, Registered Users 2 Posts: 8,913 ✭✭✭Danno


    That will not happen Pat, we will use the 1991 to 2020 average from year 2021.


  • Closed Accounts Posts: 5,150 ✭✭✭Deep Easterly


    Danno wrote: »
    That will not happen Pat, we will use the 1991 to 2020 average from year 2021.

    Is there a reason as to why the 71-00 average is not being used Dan? as surely it would be a bit more relevent to modern readings? A 76-05 average would be even better!


  • Closed Accounts Posts: 4,279 ✭✭✭Su Campu


    The official reason is that the 61-90 range is the most "representative" of Irish climate, whatever that means? :rolleyes: Before the 60s there was warming, and the same after, but in the 60s, 70s and 80s, there was cooling followed by warming, which cancelled eachother out and gave a level baseline.

    That's the official reason anyway. I don't believe a word we're told anymore. See the real reason is that if we're in a warming period, then the averages will be also on the rise, so any subsequent warm years can't be quoted as being as much above average, therefore people might start to think the warming is slowing down.....:rolleyes: Eg, take the 71-00 averages. They will be a lot higher than the 61-90. Therefore if 2010 turns out to be a warm year, the anomaly won't look so drastic using the 71-00 averages, say only 0.4°C, compared to maybe 1.0°C using the 61-90 (they're just figures out of my head - not sure the actual figures would be). Therefore they lose ground on trying to promote the AGW lie.

    Scandalous


  • Advertisement
  • Registered Users, Registered Users 2 Posts: 26,578 ✭✭✭✭Turtwig


    Su Campu wrote: »
    The official reason is that the 61-90 range is the most "representative" of Irish climate, whatever that means? :rolleyes: Before the 60s there was warming, and the same after, but in the 60s, 70s and 80s, there was cooling followed by warming, which cancelled eachother out and gave a level baseline.

    That's the official reason anyway. I don't believe a word we're told anymore. See the real reason is that if we're in a warming period, then the averages will be also on the rise, so any subsequent warm years can't be quoted as being as much above average, therefore people might start to think the warming is slowing down.....:rolleyes: Eg, take the 71-00 averages. They will be a lot higher than the 61-90. Therefore if 2010 turns out to be a warm year, the anomaly won't look so drastic using the 71-00 averages, say only 0.4°C, compared to maybe 1.0°C using the 61-90 (they're just figures out of my head - not sure the actual figures would be). Therefore they lose ground on trying to promote the AGW lie.

    Scandalous

    The climate of a given region is generally taken as a 30 year period. It's just the way it is, I don't think there is any real reason for it other than keeping accurate statistical trends (and maybe to account for the 10-15 year latency of the oceans? Don't think so though.) . The next period will be 1991-2020. I wouldn't really bother reading any further into than that.

    I'm not sure you understand climate at all, even if Ireland cooled by 15 degrees in the 61-90 30 year period that wouldn't say anything about the Global Climate. Ireland, afterall, is just one localised area in a big sum. What matters is the Global Trend of entire planet as whole. Usually best measured via ocean imbalance. AFAIK different regions using different 30 year periods.:D


  • Posts: 31,118 ✭✭✭✭ [Deleted User]


    Malty_T wrote: »
    The climate of a given region is generally taken as a 30 year period. It's just the way it is, I don't think there is any real reason for it other than keeping accurate statistical trends (and maybe to account for the 10-15 year latency of the oceans? Don't think so though.) . The next period will be 1991-2020. I wouldn't really bother reading any further into than that.

    I'm not sure you understand climate at all, even if Ireland cooled by 15 degrees in the 61-90 30 year period that wouldn't say anything about the Global Climate. Ireland, afterall, is just one localised area in a big sum. What matters is the Global Trend of entire planet as whole. Usually best measured via ocean imbalance. AFAIK different regions using different 30 year periods.:D

    That the entire global temperature change trend is considered so important, now that is a question that needs answering.

    Local variations can and do often cancel each other out, global variations can happen as well, who's to say they are caused by climate or by external sources such as solar activity.

    The current lower (than recent trend) solar activity could provide an answer in the next decade!

    As for trending data, it makes more sense to use a rolling period of say 30 years than to have fixed "windows" otherwise housebuilders in Ireland would look at sales in 2005-7 and decide it's a good time to build!


  • Registered Users, Registered Users 2 Posts: 26,578 ✭✭✭✭Turtwig


    That the entire global temperature change trend is considered so important, now that is a question that needs answering.

    Local variations can and do often cancel each other out, global variations can happen as well, who's to say they are caused by climate or by external sources such as solar activity.

    The current lower (than recent trend) solar activity could provide an answer in the next decade!

    Solar activity does not provide an answer for the last 4 decades of warming. And it looks increasingly unlikely that it will do so for the next decade either. Last year the sun was inactive and weaker than usual. Yet 2009 was the 2nd warmest year on record with much warmer temperatures recorded at night time. (Warming at night is not something you'd expect if the sun was the primary driver of warming.)
    As for trending data, it makes more sense to use a rolling period of say 30 years than to have fixed "windows" otherwise housebuilders in Ireland would look at sales in 2005-7 and decide it's a good time to build!

    You've mixed stuff up here. The 30 year period is just the way we define climate in a region. It's not how you measure or statistically analyse global temperature trends. No one ever said it was. It just purely convention, like the metric system we define climate in a region as the frequency of weather occurrences that occurred over a 30 year period.
    What you have suggested above is nearly always screened when analysing trends in a global climate efforts. One of the criticism in the US. NAS assessment of Mann's Hockey Stick was his failure to consult a statistician to apply a rigorous statistical analysis on the data presented.

    As climate is a largely statistical phenomenon it goes without saying that if they were making such basic errors it would be truly shocking. Although a quick look through the majority of the journals will tell you the opposite. Nearly every paper that is published outlines how the data was analysed and discusses the possible drawbacks to the approach they used - the drawbacks the authors themselves were aware of.


  • Posts: 31,118 ✭✭✭✭ [Deleted User]


    Malty_T wrote: »
    Solar activity does not provide an answer for the last 4 decades of warming. And it looks increasingly unlikely that it will do so for the next decade either. Last year the sun was inactive and weaker than usual. Yet 2009 was the 2nd warmest year on record with much warmer temperatures recorded at night time. (Warming at night is not something you'd expect if the sun was the primary driver of warming.)
    Solar activity has been higher than average (over the the past few centuries of recorded data) during the past few decades, so imho it could still be a factor - time will tell.

    As for nighttime temperatures, I can't comment as I don't have the info.
    Malty_T wrote: »

    You've mixed stuff up here. The 30 year period is just the way we define climate in a region. It's not how you measure or statistically analyse global temperature trends. No one ever said it was. It just purely convention, like the metric system we define climate in a region as the frequency of weather occurrences that occurred over a 30 year period.
    What you have suggested above is nearly always screened when analysing trends in a global climate efforts. One of the criticism in the US. NAS assessment of Mann's Hockey Stick was his failure to consult a statistician to apply a rigorous statistical analysis on the data presented.

    As climate is a largely statistical phenomenon it goes without saying that if they were making such basic errors it would be truly shocking. Although a quick look through the majority of the journals will tell you the opposite. Nearly every paper that is published outlines how the data was analysed and discusses the possible drawbacks to the approach they used - the drawbacks the authors themselves were aware of.

    If I understand you correctly, the last "climate period" was from 1961-1990, a period that started by cooling which was followed by heating and ended up warmer than it started. This is the base line for future warming!! :confused:


  • Registered Users, Registered Users 2 Posts: 26,578 ✭✭✭✭Turtwig


    If I understand you correctly, the last "climate period" was from 1961-1990, a period that started by cooling which was followed by heating and ended up warmer than it started. This is the base line for future warming!! :confused:

    No, it's just a base line for describing the climate of a particular region. Nothing less, nothing more. Analysis of data or trends is done using various different techniques that may or may not incorporate such a set period.
    Solar activity has been higher than average (over the the past few centuries of recorded data) during the past few decades, so imho it could still be a factor - time will tell.

    As for nighttime temperatures, I can't comment as I don't have the info.

    There's practically no correlation there. Solar activity could still be a factor but there's no evidence that really asserts or supports the claim that it is. Solar activity is always going to get higher and higher than average, just really slowly - Stars tend to do that.:)


  • Posts: 31,118 ✭✭✭✭ [Deleted User]


    Malty_T wrote: »
    Solar activity is always going to get higher and higher than average, just really slowly. Stars do that.:)
    Millions of years time, way beyond human activity of any kind that is! ;)
    Sunspot activity on the other hand has been recorded and activity can be corelated* to climate changes in north western Europe, as to whether it can related to changes elsewhare... I don't have the data.

    *proven, I don't know!!!


  • Registered Users, Registered Users 2 Posts: 26,578 ✭✭✭✭Turtwig


    Millions of years time, way beyond human activity of any kind that is! ;)
    Sunspot activity on the other hand has been recorded and activity can be corelated* to climate changes in north western Europe, as to whether it can related to changes elsewhare... I don't have the data.

    *proven, I don't know!!!

    Yeah, I know. Solar activity has definitely correlated well with some past climate changes: It doesn't always. C02, Milankovitch Cycles, etc are all the same : sometimes they affect climate other times it's something else. The problem is that the last 40 or more years does not correspond to what you'd expect from primary solar forcing. It corresponds better, alot better, with anthropogenic forcing.

    As I blame Durkin (not a scientist, thank God!) for the common misconception of this, I'm going to let him explain himself.(An old video but worth it:))
    It goes without saying that you shouldn't trust either Durkin or Mr Gore. Though, I would have to give Gore more credit for accuracy:).


  • Posts: 31,118 ✭✭✭✭ [Deleted User]


    Malty_T wrote: »
    Yeah, I know. Solar activity has definitely correlated well with some past climate changes: It doesn't always. C02, Milankovitch Cycles, etc are all the same : sometimes they affect climate other times it's something else. The problem is that the last 40 or more years does not correspond to what you'd expect from primary solar forcing. It corresponds better, alot better, with anthropogenic forcing.

    As I blame Durkin (not a scientist, thank God!) for the common misconception of this, I'm going to let him explain himself.:)
    400 years of approximate corellation as opposed to 40 years of non-correlation, which do you prefer?


  • Registered Users, Registered Users 2 Posts: 26,578 ✭✭✭✭Turtwig


    400 years of approximate corellation as opposed to 40 years of non-correlation, which do you prefer?

    Neither, unless you've got plausible causation. You've also got millions of years of C02 correlation, millions of years of Orbital Shifts, thousands of years of impact correlations, ice movements, continental drifts etc etc.
    The climate has being influenced by many things, that was the challenged climatologists faced when assessing whether manmade GHGs were really that influential. Afterall, they're such a minute amount compare natural processes. Amount isn't everything though; a tiny cyanide pill will kill you.

    (Interesting article on the history of the development of the theory available here if you're interested.)


  • Closed Accounts Posts: 2,693 ✭✭✭Redsunset


    Malty_T wrote: »
    Neither, unless you've got plausible causation. You've also got millions of years of C02 correlation, millions of years of Orbital Shifts, thousands of years of impact correlations, ice movements, continental drifts etc etc.
    The climate has being influenced by many things, that was the challenged climatologists faced when assessing whether manmade GHGs were really that influential. Afterall, they're such a minute amount compare natural processes. Amount isn't everything though; a tiny cyanide pill will kill you.

    (Interesting article on the history of the development of the theory available here if you're interested.)


    Beryllium-10 is an isotope that is a proxy for the sun’s activity. Be10 is produced in the atmosphere by cosmic ray collisions with atoms of oxygen and nitrogen. Beryllium 10 concentrations are linked to cosmic ray intensity which can be a proxy for solar strength.

    One way to capture earth’s record of that proxy data is to drill deep ice cores. Greenland, due to having a large and relatively stable deep ice sheet is often the target for drilling ice cores.

    Isotopic analysis of the ice in the core can be linked to temperature and global sea level variations. Analysis of the air contained in bubbles in the ice can reveal the palaeocomposition of the atmosphere, in particular CO2 variations. Volcanic eruptions leave identifiable ash layers.


    Plotted up and annotated, the Dye 3 B10 data shows the strong relationship between solar activity and climate. Instead of wading through hundreds of papers for evidence of the Sun’s influence on terrestrial climate, all you have to do is look at this graph.

    be10-climate.png?w=510&h=272

    All the major climate minima are evident in the Be10 record, and the cold period at the end of the 19th century. This graph alone demonstrates that the warming of the 20th century was solar-driven.

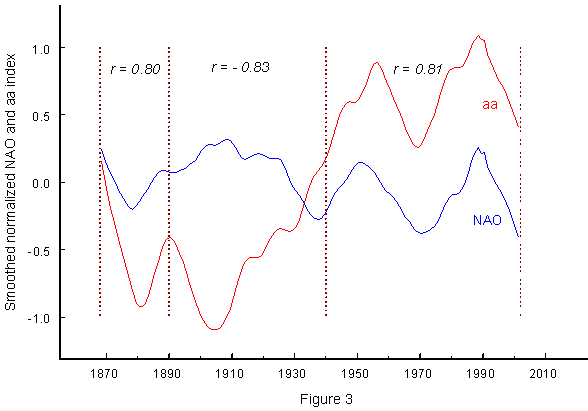
    The end of the Little Ice Age corresponded with a dramatic decrease in the rate of production of Be10, due to fewer galactic cosmic rays getting into the inner planets of the solar system. Fewer galactic cosmic rays got into the inner planets because the solar wind got stronger. The solar wind got stronger because the Sun’s magnetic field got stronger, as measured by the aa Index from 1868.
    naonew3.gif From john-daly.com

    Thus the recent fall of aa Index and Ap Index to lows never seen before in living memory is of considerable interest. This reminds me of a line out of Aliens: “Stay frosty people!” Well, we won’t have any choice – it will get frosty.

    ap_index_2008-520.png?w=520&h=289&h=289 The Ap magentic index to the end of 2008


    so to cap in my own words, THE MORE COSMIC RAYS YOU HAVE ,THE MORE B 10 THERE IS,AS HIGHLIGHTED AT THE TIME OF THE 3 SOLAR MINIMUMS ON CHART,NOW THATS INTERESTING.


    Have you read the thread,

    http://www.boards.ie/vbulletin/showthread.php?t=2055544236&highlight=dead+mini


  • Advertisement
  • Closed Accounts Posts: 2,693 ✭✭✭Redsunset


    Timothy Patterson is professor and director of the Ottawa-Carleton Geoscience Centre, Department of Earth Sciences, Carleton University

    Appearing before the Commons Committee on Environment and Sustainable Development , Carleton University paleoclimatologist Professor Tim Patterson testified, "There is no meaningful correlation between CO2 levels and Earth's temperature over this [geologic] time frame. In fact, when CO2 levels were over ten times higher than they are now, about 450 million years ago, the planet was in the depths of the absolute coldest period in the last half billion years." Patterson asked the committee, "On the basis of this evidence, how could anyone still believe that the recent relatively small increase in CO2 levels would be the major cause of the past century's modest warming?"


    Patterson concluded his testimony by explaining what his research and "hundreds of other studies" reveal: on all time scales, there is very good correlation between Earth's temperature and natural celestial phenomena such changes in the brightness of the Sun.


    This shows one of the highest-quality climate records available anywhere today and in it we see obvious confirmation that natural climate change can be dramatic.


    My research team began to collect and analyze core samples from the bottom of deep Western Canadian fjords. The regions in which we chose to conduct our research, Effingham Inlet on the West Coast of Vancouver Island, and in 2001, sounds in the Belize-Seymour Inlet complex on the mainland coast of British Columbia, were perfect for this sort of work. The topography of these fjords is such that they contain deep basins that are subject to little water transfer from the open ocean and so water near the bottom is relatively stagnant and very low in oxygen content. As a consequence, the floors of these basins are mostly lifeless and sediment layers build up year after year, undisturbed over millennia.


    Using various coring technologies, we have been able to collect more than 5,000 years' worth of mud in these basins, with the oldest layers coming from a depth of about 11 metres below the fjord floor. Clearly visible in our mud cores are annual changes that record the different seasons: corresponding to the cool, rainy winter seasons, we see dark layers composed mostly of dirt washed into the fjord from the land; in the warm summer months we see abundant fossilized fish scales and diatoms (the most common form of phytoplankton, or single-celled ocean plants) that have fallen to the fjord floor from nutrient-rich surface waters. In years when warm summers dominated climate in the region, we clearly see far thicker layers of diatoms and fish scales than we do in cooler years. Ours is one of the highest-quality climate records available anywhere today and in it we see obvious confirmation that natural climate change can be dramatic. For example, in the middle of a 62-year slice of the record at about 4,400 years ago, there was a shift in climate in only a couple of seasons from warm, dry and sunny conditions to one that was mostly cold and rainy for several decades.


    Using computers to conduct what is referred to as a "time series analysis" on the colouration and thickness of the annual layers, we have discovered repeated cycles in marine productivity in this, a region larger than Europe. Specifically, we find a very strong and consistent 11-year cycle throughout the whole record in the sediments and diatom remains. This correlates closely to the well-known 11-year "Schwabe" sunspot cycle, during which the output of the sun varies by about 0.1%. Sunspots, violent storms on the surface of the sun, have the effect of increasing solar output, so, by counting the spots visible on the surface of our star, we have an indirect measure of its varying brightness. Such records have been kept for many centuries and match very well with the changes in marine productivity we are observing.


    In the sediment, diatom and fish-scale records, we also see longer period cycles, all correlating closely with other well-known regular solar variations. In particular, we see marine productivity cycles that match well with the sun's 75-90-year "Gleissberg Cycle," the 200-500-year "Suess Cycle" and the 1,100-1,500-year "Bond Cycle." The strength of these cycles is seen to vary over time, fading in and out over the millennia. The variation in the sun's brightness over these longer cycles may be many times greater in magnitude than that measured over the short Schwabe cycle and so are seen to impact marine productivity even more significantly.


    Our finding of a direct correlation between variations in the brightness of the sun and earthly climate indicators (called "proxies") is not unique. Hundreds of other studies, using proxies from tree rings in Russia's Kola Peninsula to water levels of the Nile, show exactly the same thing: The sun appears to drive climate change.

    >>>>>>>>>>>>>>>>>>>>And much more


    So tis a great debate for all and sorry for repeating myself but
    ONLY TIME WILL TELL:)


  • Registered Users, Registered Users 2 Posts: 26,578 ✭✭✭✭Turtwig


    redsunset wrote: »
    <long post>

    I'm not sure how the significance of what you've showed me has gone against anything I said. I agree that many past climate changes changes have been solar driven. I'm stating the scientific assertion that the current latter 20th century and 21st century warming isn't. All you've done is present evidence that shows that solar activity affects the climate. No climatologist said it doesn't, you've got to show why solar activity explains the last 40 years of climate change. Which, iirc, no one has been able to do yet. And there have been numerous attempts as well as ongoing ones. :)


    Also, I'm not the biggest fan of pseudoscience sites likehttp://wattsupwiththat.com/2009/03/17/beryllium-10-and-climate/.


    P.S 2009 was the 2nd warmest year on record. So frost in Ireland but not over the globe.:)


  • Closed Accounts Posts: 2,693 ✭✭✭Redsunset


    Look take those sites as you will However, there was a problem.


    Despite this clear and repeated correlation, the measured variations in incoming solar energy were, on their own, not sufficient to cause the climate changes we have observed in our proxies. In addition, even though the sun is brighter now than at any time in the past 8,000 years, the increase in direct solar input is not calculated to be sufficient to cause the past century's modest warming on its own. There had to be an amplifier of some sort for the sun to be a primary driver of climate change.


    Indeed, that is precisely what has been discovered. In a series of groundbreaking scientific papers starting in 2002, Veizer, Shaviv, Carslaw, and most recently Svensmark et al., have collectively demonstrated that as the output of the sun varies, and with it, our star's protective solar wind, varying amounts of galactic cosmic rays from deep space are able to enter our solar system and penetrate the Earth's atmosphere. These cosmic rays enhance cloud formation which, overall, has a cooling effect on the planet. When the sun's energy output is greater, not only does the Earth warm slightly due to direct solar heating, but the stronger solar wind generated during these "high sun" periods blocks many of the cosmic rays from entering our atmosphere. Cloud cover decreases and the Earth warms still more.


    The opposite occurs when the sun is less bright. More cosmic rays are able to get through to Earth's atmosphere, more clouds form, and the planet cools more than would otherwise be the case due to direct solar effects alone. This is precisely what happened from the middle of the 17th century into the early 18th century, when the solar energy input to our atmosphere, as indicated by the number of sunspots, was at a minimum and the planet was stuck in the Little Ice Age. These new findings suggest that changes in the output of the sun caused the most recent climate change. By comparison, CO2 variations show little correlation with our planet's climate on long, medium and even short time scales but the data is there.

    >>>>>>>>>>>>>>>>>>>>>>>>>>>>>>>>>>>>>>>>>>>>>>>>>>>>>>>

    We're all trying to make sense of it all and "scientists" too.

    Im just here waiting for the next big scandal,because alot in my opinion is not as it seems,for we live in a corrupt little world.

    THE END:D


  • Posts: 31,118 ✭✭✭✭ [Deleted User]


    Malty_T wrote: »

    P.S 2009 was the 2nd warmest year on record. So frost in Ireland but not over the globe.:)
    On what record?


  • Registered Users, Registered Users 2 Posts: 26,578 ✭✭✭✭Turtwig


    redsunset wrote: »
    Indeed, that is precisely what has been discovered. In a series of groundbreaking scientific papers starting in 2002, Veizer, Shaviv, Carslaw, and most recently Svensmark et al., have collectively demonstrated that as the output of the sun varies, and with it, our star's protective solar wind, varying amounts of galactic cosmic rays from deep space are able to enter our solar system and penetrate the Earth's atmosphere. These cosmic rays enhance cloud formation which, overall, has a cooling effect on the planet. When the sun's energy output is greater, not only does the Earth warm slightly due to direct solar heating, but the stronger solar wind generated during these "high sun" periods blocks many of the cosmic rays from entering our atmosphere. Cloud cover decreases and the Earth warms still more.

    ^^ This paragraph does not accurately reflect the conclusions of the above authors. The above authors are genuine skeptics but they aren't saying what you and others have said here.
    On what record?
    NASA.

    Edit :Sh1t, sorry misinterpreted. Since modern instrumental records began.


  • Closed Accounts Posts: 2,693 ✭✭✭Redsunset


    Sure we're all skeptics.

    I only highlight this information as it comes so we can make our own mind up.

    Nothing is going to be settled now or the immediate future.

    I believe its all intergalactic related so maybe in 50 years we might all be singing from the same hymn sheet ,but until we all see the light its always going to be a tug of war.

    Believe what makes you happy IMO:)


  • Registered Users, Registered Users 2 Posts: 26,578 ✭✭✭✭Turtwig


    redsunset wrote: »
    I only highlight this information as it comes so we can make our own mind up.)

    It was a false misrepresentation of the work done by scientists.


  • Closed Accounts Posts: 2,693 ✭✭✭Redsunset


    Oh yes here is your argument i assume,

    Two main conclusions result from our analysis of [Shaviv and Veizer, 2003]. The first is that the correlation of cosmic ray flux (CRF) and climate over the past 520 m.y. appears to not hold up under scrutiny. Even if we accept the questionable assumption that meteorite clusters give information on CRF variations, we find that the evidence for a link between CRF and climate amounts to little more than a similarity in the average periods of the CRF variations and a heavily smoothed temperature reconstruction. Phase agreement is poor. The authors applied several adjustments to the data to artificially enhance the correlation. We thus find that the existence of a correlation has not been convincingly demonstrated.

    Our second conclusion is independent of the first. Whether there is a link of CRF and temperature or not, the authors’ estimate of the effect of a CO2-doubling on climate is highly questionable. It is based on a simple and incomplete regression analysis which implicitly assumes that climate variations on time scales of millions of years, for different configurations of continents and ocean currents, for much higher CO2 levels than at present, and with unaccounted causes and contributing factors, can give direct quantitative information about the effect of rapid CO2 doubling from pre-industrial climate. The complexity and non-linearity of the climate system does not allow such a simple statistical derivation of climate sensitivity without a physical understanding of the key processes and feedbacks. We thus conclude that [Shaviv and Veizer, 2003] provide no cause for revising current estimates of climate sensitivity to carbon dioxide.


    >>>>>>>>>>>>>>>>>>>>>>>>>>>>>>>>>>>>>>>>>>>>>>>>>>>>>>


  • Closed Accounts Posts: 6 Theowolfe


    Malty T says.

    "Last year the sun was inactive and weaker than usual. Yet 2009 was the 2nd warmest year on record with much warmer temperatures recorded at night time. (Warming at night is not something you'd expect if the sun was the primary driver of warming.)"

    Most of the claims from the alarmists over the lat 20 years must now be treated with extreme scepticism. We cannot know if 2009 was the second warmest because we don't know how the data have been manipulated and cherry picked.

    It looks increasingly like scientific fraud is at the heart of the AGW movement.


  • Advertisement
  • Registered Users, Registered Users 2 Posts: 26,578 ✭✭✭✭Turtwig


    redsunset wrote: »
    Oh yes here is your argument i assume,

    Two main conclusions result from our analysis of [Shaviv and Veizer, 2003]. The first is that the correlation of cosmic ray flux (CRF) and climate over the past 520 m.y. appears to not hold up under scrutiny. Even if we accept the questionable assumption that meteorite clusters give information on CRF variations, we find that the evidence for a link between CRF and climate amounts to little more than a similarity in the average periods of the CRF variations and a heavily smoothed temperature reconstruction. Phase agreement is poor. The authors applied several adjustments to the data to artificially enhance the correlation. We thus find that the existence of a correlation has not been convincingly demonstrated.

    Our second conclusion is independent of the first. Whether there is a link of CRF and temperature or not, the authors’ estimate of the effect of a CO2-doubling on climate is highly questionable. It is based on a simple and incomplete regression analysis which implicitly assumes that climate variations on time scales of millions of years, for different configurations of continents and ocean currents, for much higher CO2 levels than at present, and with unaccounted causes and contributing factors, can give direct quantitative information about the effect of rapid CO2 doubling from pre-industrial climate. The complexity and non-linearity of the climate system does not allow such a simple statistical derivation of climate sensitivity without a physical understanding of the key processes and feedbacks. We thus conclude that [Shaviv and Veizer, 2003] provide no cause for revising current estimates of climate sensitivity to carbon dioxide.


    >>>>>>>>>>>>>>>>>>>>>>>>>>>>>>>>>>>>>>>>>>>>>>>>>>>>>>

    Nope, I don't even need that.
    As a final qualification, we emphasize
    that our conclusion about the dominance
    of the CRF over climate variability is valid
    only on multimillion year time scales. At
    shorter time scales, other climatic factors
    may play an important role, but note that
    many authors (see previous references)
    suggest a decisive role for the celestial
    driver also on multi-millennial to less than
    annual time scales.

    A multi-million year timescale? Hmm..


  • Closed Accounts Posts: 5,150 ✭✭✭Deep Easterly


    Malty_T wrote: »
    The 30 year period is just the way we define climate in a region. It's not how you measure or statistically analyse global temperature trends. No one ever said it was. It just purely convention, like the metric system we define climate in a region as the frequency of weather occurrences that occurred over a 30 year period.

    A 30 year average for a specific period is what it is. I still at pains to know why the 61-90 average is being used here in Ireland as a comparative? It is almost 20 years old. A climate period over 30 years is subject to change from decade to decade, which reflects nothing more than the volatility of weather within each period as weather events are not a constant, they don't follow the rules that it itself creates.

    I think the 71-00 average should be in force by now as that too was a 30 year norm, and just as normal as the 61-90 average. I accept that we have to wait until 2021 for the new normal to come into place, but I have yet to here the reason why we have to wait.


  • Banned (with Prison Access) Posts: 25,234 ✭✭✭✭Sponge Bob


    Malty_T wrote: »
    NASA.
    Edit :Sh1t, sorry misinterpreted. Since modern instrumental records began.
    NASA use that GISTemp series which is what started this particular thread off in the first place :D

    The "scandal" in the thread title above is about the manipulation of date by ...NASA in the Goddard Institute. Sure we would not have this thread in the first place without them.

    Bless ( all)


  • Registered Users, Registered Users 2 Posts: 8,913 ✭✭✭Danno


    Wait for the next "climate gate" - should be along rather soon now...


  • Banned (with Prison Access) Posts: 25,234 ✭✭✭✭Sponge Bob


  • Banned (with Prison Access) Posts: 25,234 ✭✭✭✭Sponge Bob


    They did so 2 years after the FoI and then made sure the FoI was scanned into a PDF and not text searchable. EG

    http://www.nasa.gov/centers/goddard/pdf/415778main_NASA%20GISS%20Temperature%20Data%20%28Part%203%20of%203%29.pdf

    Someone ran an OCR and uploaded the emails here in searchable form.

    http://www.neutralpedia.com/wiki/NASA_FOIA_Emails

    This guy requested the emails

    http://wattsupwiththat.com/2010/02/17/after-two-years-of-stonewalling-nasa-giss-foia-files-are-now-online/
    In August 2007, I submitted two Freedom of Information Act requests to NASA and its Goddard Institute for Space Studies (GISS), headed by long-time Gore advisor James Hansen and his right-hand man Gavin Schmidt (and RealClimate.org co-founder).


    I did this because Canadian businessman Steve McIntyre — a man with professional experience investigating suspect statistical claims in the mining industry and elsewhere, including his exposure of the now-infamous “hockey stick” graph — noticed something unusual with NASA’s claims of an ever-warming first decade of this century. NASA appeared to have inflated its U.S. temperatures beginning in the year 2000. My FOIA request asked NASA about their internal discussions regarding whether and how to correct the temperature error caught by McIntyre.


    NASA stonewalled my request for more than two years, until Climategate prompted me to offer notice of intent to sue if NASA did not comply immediately.
    On New Year’s Eve, NASA finally provided the Competitive Enterprise


    Institute (CEI) with the documents I requested in August 2007.


  • Advertisement
  • Closed Accounts Posts: 1,530 ✭✭✭TheInquisitor


    http://errortheory.blogspot.com/2008/04/ocean-oscillations-are-not-masking.html

    Another interesting link from Joe B

    Go to proper link to see graphs etc
    Ocean oscillations are not "masking" global warming: the cooling is real
    Warming alarmists are trying to spin recent global cooling as just a cool phase of the Pacific oscillation, "masking" ongoing global warming. This explanation is KNOWN to be false.

    The geologic record proves beyond any doubt that global temperature is driven by the solar wind (or sunspot activity), and that changes in CO2 are of immeasurably little consequence. Thus the present lull in solar activity means that global temperature is now falling. If solar cycle 24 fires up strong, global temperature could rise again, but given that solar activity has been at historical highs since 1940, a long term fall off IS coming, and when it does, it WILL cause long term cooling.


    Figuring in ocean oscillations

    The simple relationship between global temperature and solar activity is obscured somewhat by the difference between global temperature and surface temperature. Global temperature is the average temperature of the oceans, which are the planet's primary heat sink. In comparison, the heat storage capacities of the land masses and the atmosphere are trivial.

    Ocean temperatures are not evenly distributed. The Atlantic and Pacific oceans both experience oscillations, where unusually warm or cold waters take turns at the ocean surface. This surface water is a primary determinant of the earth's surface temperature, so the ocean oscillations cause surface temperature to oscillate with respect to the actual global temperature.

    Our current global cooling phase, caused by the lull in solar activity, happens to coincide with the onset of a cold "la nina" phase of the Pacific Decadal Oscillation (PDO). Thus as the earth cools, surface temperatures will cool even faster.

    The warming alarmists are pretending that all the cooling is due to the ocean oscillations, which is only masking continued global warming:
    Our results suggest that global surface temperature may not increase over the next decade, as natural climate variations in the North Atlantic and tropical Pacific temporarily offset the projected anthropogenic warming.
    In the press they are even bolder:
    However, temperatures will again be rising quickly by about 2020, they say.
    But present cooling is not just cold ocean oscillations masking overall warming. It is cold oscillations on top of a fall off in solar activity that is predicted by solar cycle 25 to become serious (if it isn't already).

    The warming alarmists are actively covering up the real threat, even as it becomes manifest. Thirty years of la nina, compounded by thirty years of declining solar activity, at a time when Milankovitch cycles are approaching ice age conditions, is a time to be doing everything we can to forstall the possibility of runaway global cooling. Global warming never was a threat. Warming has negative feedback effects that stop it from becoming harmful. Global cooling does not. Positive cooling feedbacks regularly descend all the way into 100,000 year long ice ages, with the next one due any century now.


    20th century solar activity and ocean oscillations

    It is not that ocean oscillations can't mask global warming. This isn't what is happening now, but it actually did happen in the 1940's and 50's. The comparison is instructive.

    Solar activity was at that time reaching "grand maximum" levels, just as a thirty year cold phase of the Pacific Decadal Oscillation (or PDO) was starting. The intense solar activity warmed the oceans as a whole (and hence the earth), but having the colder Pacific water at the surface caused surface temperatures across the planet to fall, so it felt like the earth was cooling.

    This phenomenon can be seen in the following three graphics: sunspot count, PDO, and the surface temperature record:


    Cap'n Bob's sunspot count graphic. Solar activity reaches "grand maximum" levels in the early 1940's and stay there through the 50's and early 60's.


    Steven Hare's Pacific Decadal Oscillation graphic. The PDO went into a cold surface water phase at the same time the sun was heating up.


    Roy Spencer's graphic of the HadCRUT3 surface temperature record. The surface temperature cooled in the 40's and 50's as the cold PDO masked the warming being caused by high solar activity.


    Continuing forward, the graphs show that the cold phase of the Pacific oscillation continued through the 60's, where the resulting cold surface temperatures were compounded by a weak solar cycle. By the early seventies, there was justified concern about the possible onset of the next ice age. Solar activity would be heading back down sooner or later, and it could have been sooner. What was unjustified was anti-capitalist environmentalists like Stephen Schneider blaming the cooling on human burning of fossil fuels, just so they could have an excuse for urging restrictions on fossil fuel burning and economic growth.

    Shortly after Newsweek took global cooling fears mainstream in 1975, solar activity returned to "grand maximum" levels and the Pacific oscillation turned to its warming "el nino" phase. Throughout the 80's and 90's, these warming effects worked together to drive surface temperatures up. Solar activity and the Pacific oscillation both leveled out over the first five years of the 21st century, and in the last couple of years both have turned in the cooling direction.

    In sum, if the surface temperature record is "corrected" for the influence of ocean oscillations (so that it tracks global temperature) the correlation to solar activity becomes much stronger.


    Just how strong IS the correlation between solar activity and temperature, once the ocean oscillations and volcanic aerosol effects are corrected for?

    The correlation is almost exact, all the way down to annual time scales. In the geologic record, the correlation in the geologic record is about 90% all the way down to decadal time scales. (Fred Singer and Henrik Svensmark both amass the evidence in their landmark books.) But the geologic record doesn't account for ocean oscillations and volcanic sulfates. For the modern period over which we have measures for these further determinants of surface temperature, the residual temperature anomaly tracks solar activity practically year by year. Here is Svensmark's graph of the temperature anomaly (trend removed), once ocean oscillations and volcanic aerosol effects are accounted for:


    Svensmark graphic (via the reference frame).

    Notice that Svensmark plots temperature against Galactic Cosmic Radiation (GCR), not solar activity. Higher levels of solar activity shield the earth from GCR, so GCR serves as a proxy for solar activity and vice versa. It is GCR that can be measured directly in the geologic record, and in Svensmark's theory, it is GCR that causes global cooling (by ionizing the atmosphere and seeding cloud formation).

    Very impressive correlation. In contrast, there is no empirical evidence whatsoever that CO2 drives anything. The warming alarmists have a theory with NO EVIDENCE behind it, and they are willfully blind to the overwhelming evidence that temperature is driven by solar-magnetic-activity/GCR. Despite the fact that ALL THE EVIDENCE points to solar activity and GCR as the drivers of global temperature, the IPCC's General Circulation Models completely omit this competing theory.

    According to cooling denier Richard Wood:
    Natural variations over the next 10 years might be heading in the cold direction.
    But, he adds:
    If you run the model long enough, eventually global warming will win.
    Yes. But not because the model is distinguishing between natural and anthropogenic warming. The model ASSUMES that CO2 drives temperature, and assumes that solar effects do not. As the IPCC climatologists admit (when pressed): these models do not produce forecasts. They are simulations that extrapolate assumptions, and the assumptions that are being extrapolated are those of environmental religionism, completely divorced from the evidence. They omit from their assumptions what there IS evidence for and assume what there is NO evidence for. Pure scientific fraud.


    Environmentalist religion

    CO2 has no role to play anywhere in this story. Theoretically higher levels of CO2 should have a very slight warming effect, but empirically, this effect is unmeasurable. We are NOT in a state like the 40's and 50's where a cooling PDO was masking the warming effects of high solar activity. We are in a very dangerous cooling phase where cold ocean oscillations are compounding the cooling effects of diminished solar activity. The only masking going on is from the dishonest warming alarmists, covering up the very real perils of global cooling with their hot air about CO2.

    This gives them an excuse to proceed with their real agenda: placing restrictions on fossil fuel burning and economic growth. The warming alarmists are not actually concerned about global warming at all, and never were. They are environmental religionists who see economic activity as gobbling up the environment. The only thing they actually care about is securing restrictions on fossil fuel burning as a way to curtail economic activity and save the environment from human encroachment.

    The alarmists don't care whether their claims about CO2 driven warming are true. In fact, they all KNOW that anthropogenic global warming is a hoax, but it gets them the policy prescription that they are driven to on religious grounds, and so they embrace it.


    Error Theory

    Distrust in truth is the fundamental human moral failing. In every arena, half the population imagines that it can somehow be right or in their interest to avoid or suppress the truth. The inevitable consequence of this truth avoidance is that the truth avoiders end up divorced from reality, which inevitably makes them wrong in their assumptions about what is right or in their interest.

    In reality, warming is completely benign, while cooling is extraordinarily dangerous. It can easily wipe out, not just most of mankind, but most of the biosphere, as it has done like clockwork for the last 2 million years. When it comes to gobbling up flora and fauna, nothing compares to an ice age. If we want to save the planet, we ought to be pumping out greenhouse gases as fast as we can, and tailoring them to patch the infrared "holes" in our greenhouse blanket. Instead, thanks to the global warming alarmists, we are not going to do anything to warm up our greenhouse blanket, and will only be able to pray that this isn't the big one. Pretty damned stupid. Such are the wages of distrust in truth.

    Jesus tried to tell us all: be a witness for truth. That is what he was doing--"I came into the world to be a witness for truth" (Jn 18:37)--and he asked us to follow him. The environmentalists think they are beyond Christianity. Fools. They don't begin to get it. If you don't trust in truth, if you just assume that curtailing fossil fuel burning is the right thing to do, regardless of what is really happening with global temperature, then you get divorced from reality and EVERYTHING you think you know will be WRONG.

    These idiots will get us (or our children) killed.


  • Registered Users, Registered Users 2 Posts: 26,578 ✭✭✭✭Turtwig


    If we want to save the planet, we ought to be pumping out greenhouse gases as fast as we can, and tailoring them to patch the infrared "holes" in our greenhouse blanket.

    Congratulations, you've just won Malty's dumbest quote of the month award Mr. Blogger.


  • Posts: 31,118 ✭✭✭✭ [Deleted User]


    Malty_T wrote: »
    If we want to save the planet, we ought to be pumping out greenhouse gases as fast as we can, and tailoring them to patch the infrared "holes" in our greenhouse blanket.
    Congratulations, you've just won Malty's dumbest quote of the month award Mr. Blogger.

    Yes, I have to agree with that! Deliberately messing with the environment whem we don't fully understand how it actually works is dumb !


  • Closed Accounts Posts: 2,693 ✭✭✭Redsunset


    Britain's Weather Office Proposes Climate-Gate Do-Over


    Met Office/YouTube


    Met Office Hadley Centre projections of temperature change relative to pre-industrial levels, under two different emissions scenarios. Now the agency is proposing starting its climate models scratch.


    After the firestorm of criticism called Climate-gate, the British government's official Meteorological Office has decided to give its modern climate data a do-over.

    At a meeting on Monday of about 150 climate scientists in the quiet Turkish seaside resort of Antalya, representatives of the weather office (known in Britain as the Met Office) quietly proposed that the world's climate scientists start all over again on a "grand challenge" to produce a new, common trove of global temperature data that is open to public scrutiny and "rigorous" peer review.

    In other words, conduct investigations into modern global warming in a way that may help to end the mammoth controversy over world temperature data that has been stirred up in the past few years.

    The executive summary of the Met Office proposal to the World Meteorological Organization's Committee for Climatology is that, the Met Office defends its historical record of temperature readings, along with similar data collected in the U.S., as a "robust indicator of global change." But it admits that "further development" of the record is required "in particular to better assess the risks posed by changes in extremes of climate."

    Among other things, its older data is maintained on a monthly basis, and the Met Office proposal says that is "grossly inadequate" to providing information on a daily and "sub-daily" basis.


    A Met Office spokesman, Dave Britton, declared that the decision to re-do the data collection had been gestating for "a long time," then added: "But it would be naïve to say that [the Climate-gate controversy] didn't have an impact." He added: "It's not something that we can do alone."

    As a result, the proposal says, "we feel that it is timely to propose an international effort to reanalyze surface temperature data in collaboration with the World Meteorological Organization (WMO), which has the responsibility for global observing and monitoring systems for weather and climate."

    The new effort, the proposal says, would provide:

    • "verifiable datasets starting from a common databank of unrestricted data"
    • "methods that are fully documented in the peer reviewed literature and open to scrutiny;"
    • "a set of independent assessments of surface temperature produced by independent groups using independent methods,"
    • "comprehensive audit trails to deliver confidence in the results;"
    • "robust assessment of uncertainties associated with observational error, temporal and geographical in homogeneities."

    Click here to read the executive summary.

    The Met Office proposes that the new international effort to recalibrate temperature data start at a "workshop"' hosted by its Hadley Climate Research Centre, which maintains data in collaboration with the controversial Climatic Research Unit (CRU) at Britain's East Anglia University. The Met Office would invite "key players" to start the "agreed
    community challenge" of creating the new datasets. A Met Office spokesman said the new effort would take about three years to complete, but would not estimate the cost.

    The Met Office proposal asserts that "we do not anticipate any substantial changes in the resulting global and continental-scale ... trends" as a result of the new round of data collection. But, the proposal adds, "this effort will ensure that the datasets are completely robust and that all methods are transparent."

    Those strongly underlined assurances put the Met Office in strong contrast to the accusations that have been hurled at its collaborator, CRU, epicenter of the Climate-gate controversy. Among other things, the CRU had stonewalled climate skeptics who demanded to know more about its scientific methods in establishing a dramatic record of global warming, especially in the 20th century. (An inquiry established that the institution had flouted British freedom of information laws in refusing to come up with the data.)

    The stonewall began to crumble after a gusher of leaked emails revealed climate scientists, including the CRU's chief, Phil Jones, discussing how to keep controversial climate data out of the hands of the skeptics, keep opposing scientific viewpoints out of peer-reviewed scientific journals, and bemoaned that their climate models failed to account for more than a decade of stagnation in global temperatures.Jones later revealed that key temperature datasets used in Hadley's predictions had been lost, and could not be retrieved for verification.

    Jones stepped down temporarily after the British government announced an ostensibly independent inquiry into the still-growing scandal, but that only fanned the flames, as skeptics pointed out ties between several panel members and the East Anglia center. In an interview two weeks ago, Jones also admitted that there has been no "statistically significant" global warming in the past 15 years.

    The Met Office's desire for more robust and transparent data could also prove to be a blow for Rajendra Pachauri, head of the United Nations-backed International Panel on Climate Change (IPCC), whose most recent report, published in 2007, has been exposed by skeptics as rife with scientific errors, larded with un-reviewed and non-scientific source materials, and other failings.

    As details of the report's sloppiness emerged, the ranks of skeptics of the work have swelled to include larger numbers of the scientific community, including weather specialists who worked on the sprawling IPCC report. Calls for Pachauri's resignation have come from organizations as normally
    opposed as the Competitive Enterprise Institute and the British chapter of Greenpeace. So far, he has refused to step down.

    The Met proposal argues says that its old datasets "are adequate for answering the pressing 20th Century questions of whether climate is changing and if so how. Bet they are fundamentally ill-conditioned to answer 21st Century questions such as how extremes are changing and therefore what adaptation and mitigation decisions should be taken."
    Those "21st Century questions" are not small and they are very far from cheap. At Copenhagen, wealthy nations were being asked to spend trillions of dollars on answering them, a deal that only fell through when China, India, and other near-developed nations refused to join the mammoth climate-control deal.

    The question after the Met Office's proposal may be whether environmentalists eager to move those mountains of cash are also ready to stand down until the 21st century questions get 21st century answers.


  • Banned (with Prison Access) Posts: 25,234 ✭✭✭✭Sponge Bob


    This has not gone away. A new Version 3 dataset was announced but not yet released. As the supposition in certain quarters is that data is being manipulated a lot mor s ceptics are waiting to grind the GHCN3 data set and compare it with the GHCN2 dataset on which chiefio commented liberally as mentioned and linked earlier in this thread. They are holding fire, still no sign of the new dataset ...unsurprisingly .

    All has recently gone quiet on Climategate :p

    The heads up demo of GHCN3 in May attracted a degree of scorn

    http://wattsupwiththat.com/2010/05/19/tom-karl%E2%80%99s-ghcn3-trends-are-wrong-at-least-in-slide-21/

    Recent chiefio analysis of GHCN1 and GHCN2 ( GHCN2 is the current temperature set from which the global warming hockey stick curve is derived) and with blog comments below

    Chiefio, if you are coming late, is a market trend analyst who discovered global temperature 'datasets' in recent times.

    http://chiefio.wordpress.com/2010/07/31/agdataw-begins-in-1990/

    He reiterates his base theory as E.M Smith in a comment
    Most airports have transitioned from a grass field to acres of tarmac and jet exhaust over the last 75 years. That many of the thermometer stations were located there (and a very high percentage of those that survive to date…) is a fundamental warming bias via station selection in GHCN.


  • Advertisement
  • Closed Accounts Posts: 2,693 ✭✭✭Redsunset


    This is a report video from 20 years ago.And nothing has changed.
    I found it entertaining.
    http://video.google.com/videoplay?docid=-5949034802461518010#


  • Closed Accounts Posts: 2,693 ✭✭✭Redsunset


    http://scienceandpublicpolicy.org/images/stories/papers/originals/surface_temp.pdf

    Joe D’Aleo discusses Surface Temperatures: A Policy Driven Deception, a new report that he co-wrote with Anthony Watts. Joe separates fact from fiction about CO2 and outlines its benefits and functions.Learn how the EPA declared CO2 a toxin based on an analysis by a team with an agenda to control carbon and how we use energy and energy sources.


    Interesting stuff


  • Registered Users, Registered Users 2 Posts: 9,577 ✭✭✭lord lucan


    redsunset wrote: »
    http://scienceandpublicpolicy.org/images/stories/papers/originals/surface_temp.pdf

    Joe D’Aleo discusses Surface Temperatures: A Policy Driven Deception, a new report that he co-wrote with Anthony Watts. Joe separates fact from fiction about CO2 and outlines its benefits and functions.Learn how the EPA declared CO2 a toxin based on an analysis by a team with an agenda to control carbon and how we use energy and energy sources.


    Interesting stuff

    Thanks for that,i'll be a couple of hours getting through it all!


  • Closed Accounts Posts: 2,667 ✭✭✭WolfeIRE


    Below article from Joe Bastardi has rightly confused me now.

    He consistently throws up evidence of artic sea ice making a significant recovery. Yet I watched a news piece last night on the Moscow conference on the Artic in which Russian ships are now passing the northern artic passage with ease due to decline of icecap.

    Just plain confusing

    THURSDAY EARLY MORNING
    ARE THE U.S. SCIENTISTS DELUSIONAL IN THEIR SEA ICE IDEAS?
    Someone in authority in the U.S. lying or wrong; it's that simple.
    We have the spokesman from the NSIDC claiming again, like three years ago before he woke up and realized the La Nina was causing a recovery, that Arctic sea ice is in a death spiral. He tries to use the metric "thickness of ice."
    Yet here we have the NAVY saying the ice is thicker.
    http://stevengoddard.wordpress.com/2010/09/21/is-the-ice-getting-thicker/
    Somebody is wrong.
    On paper, the NSIDC spokesman is trying to say to believe him rather than our lying eyes, which on every objective sea ice site is not as low as in 2007... an inconvenient truth given the amount of warmth that supposedly boiled the Arctic over the last year, and the amount of cold coming in response, in the shorter term, to the La Nina (unseen by NOAA models as late as April, and of course two years ago when the sea ice death spiral comment came on, and I suspect they are not paying attention now. If they were, with the amount of cold now forecast on their models, why open your mouth? At least let them bust.
    Over the coming years, either I or these people trying to force their ideas on us will be exposed as the knight guarding the bridge in Monty Python's search for the Holy Grail was. Personally, I think after the recovery started in 2008 and 2009 that was the first blow to them... now they are yelling "come back and fight! It's a flesh wound." Well here comes the second stronger cut. How long they can get chopped up in the coming years, with the PDO already cold and the Atlantic turning colder in 10-15 years will remain to be seen.
    On paper, it's utter foolishness that doesn't make sense and why our people did not challenge it in the article on the 17th is bewildering to me. How do you explain the warmest year on record in the Arctic, yet the least ice melt? Surely if it's that warm, then the sea ice should have gone below the 2007 record. Now this guy comes on and claims it has... it's in the THICKNESS. Yet we have the U.S. Navy showing that simply is not true. Are the U.S. Navy people now part of a denial conspiracy? EITHER IT WASN'T THAT WARM AS THEY LED US TO BELIEVE, OR THE ICE IS NOT IN AS BAD SHAPE. YOU CAN'T HAVE IT BOTH WAYS.
    I have left the links countless times for you to monitor sea ice. Of course, the people screaming the death of the Arctic make no mention of the overall trend in the Southern Hemisphere. But why would they? It would simply lead to another common sense conclusion... something that showed up many thousand of years ago in Ecclesiastes 1:9-14.
    "What has been will be again, what has been done will be done again; there is nothing new under the sun"
    Interesting, Evan Myers, one of the original members of the founding accuweather.com crew here, told me his grandmother used to tell him that all the time. The wisdom of the ages and those that came before can always be used to counter the impulsiveness of those that wish to ignore the facts.
    Given you can all monitor these things we shall see where the death spiral is next year.
    Ciao for now.
    TUESDAY PM


  • Registered Users, Registered Users 2 Posts: 185 ✭✭odyboody


    One thing i have never heard mentioned is the amount of icebreakers now smashing their way through the ice. From my own totaly unscientific experements I have discovered that a quanity of ice will melt a lot faster if it broken up into small peices than if it is left as solid lump.
    Is it not reasonable to conclude that these ships which smashing their way through every year are reducing the quantity of ice.:rolleyes:


  • Posts: 31,118 ✭✭✭✭ [Deleted User]


    odyboody wrote: »
    One thing i have never heard mentioned is the amount of icebreakers now smashing their way through the ice. From my own totaly unscientific experements I have discovered that a quanity of ice will melt a lot faster if it broken up into small peices than if it is left as solid lump.
    Is it not reasonable to conclude that these ships which smashing their way through every year are reducing the quantity of ice.:rolleyes:
    That sounds about right, smash up the ice then scream "global warming's making the ice breakup!" Once the ice is weakened, the chances of adjacent pieces also breaking and drifting increase.


  • Banned (with Prison Access) Posts: 25,234 ✭✭✭✭Sponge Bob


    Chiefio has a very interesting article this week .

    http://chiefio.wordpress.com/2010/12/13/the-rewritten-past/

    Very very long article looking at quite a variety of issues. One quote and one graphic.
    As I’ve asserted before, it looks like it’s the “wrong way UHI” in things like GIStemp and the astounding concentration of thermometers at Airports in recent years in GHCN (reaching over 90% in many locations / countries).
    And when the SST matches the satellite/ocean temperature so splendid, this obviously also supports the usefulness of satellite land data – unless satellites temperatures are only reliable over the oceans…!
    Bottom line: Satellite data supports the obvious, that land and ocean data will stick together on the long run due to the permanent drift towards temperature equilibrium between land temperature and ocean surface temperatures.
    One conclusion I come to from this is that with the ocean temps lagging the land shift, we’re in for a slow ‘catch up’ of the satellite data to the present cold phase on land as the oceans cool. So perhaps part of why HadCRUT and GIStemp are calling this the “Hottest year ever” (don’t they always do that?) is simply because they are still picking up some of that ocean heat that’s still in the ‘getting off the planet’ phase.
    To predict our future trend after the cold inflection we’ve just had, the land temps tell you where you are headed, the sea temps where you have been. And the frozen land tells us we’re headed for cold, and for several years as the oceans “catch up”.

    fig75.jpg

    It should be read along with these two articles from Wattsupwithdat and Hidethedecline.eu ("Hide The Decline" are named after a Climategate email, see here )


  • Posts: 31,118 ✭✭✭✭ [Deleted User]


    Maybe the combination of low solar magnetic energy, La Nina & weakened Gulf stream really does have an affect, on global temperatures.

    Rather than poorly sited weather stations!


  • Banned (with Prison Access) Posts: 25,234 ✭✭✭✭Sponge Bob


    Maybe the combination of low solar magnetic energy, La Nina & weakened Gulf stream really does have an affect, on global temperatures. Rather than poorly sited weather stations!
    One of those links points out that temperatures are 'rising' on land, not at sea.


  • Registered Users, Registered Users 2 Posts: 976 ✭✭✭supremenovice


    All these claims and counter-claims by world 'experts' on climate. Its just getting nauseating.
    Its at the stage now where the world is at odds with itself on climate change and always will be. Its like a religion - you either now believe climate change is to do with human activity like carbon-dioxide emissions or you dont.
    Both sides are convinced that they are right and there is no report, study, claim or counter-claim that will change either sides minds.
    You can try get a Muslim to convert to Catholicism by showing them every bit of evidence you can, but he/she is not going to convert for anything, no matter what you do or say!
    Same thing with environmentalism.


  • Advertisement
Advertisement