Advertisement
If you have a new account but are having problems posting or verifying your account, please email us on hello@boards.ie for help. Thanks :)
Hello all! Please ensure that you are posting a new thread or question in the appropriate forum. The Feedback forum is overwhelmed with questions that are having to be moved elsewhere. If you need help to verify your account contact hello@boards.ie

Climategate?

17810121326

Comments

  • Registered Users, Registered Users 2 Posts: 5,473 ✭✭✭robtri


    djpbarry wrote: »
    You did ask me to provide an example of an inaccurate claim he had made, did you not? I provided a link to the source so you could be sure it was not taken out of context.
    I didn’t say we should dismiss him. I said his views are often dismissed because they are seldom based on fact.

    actually it is taken out of context, as the next part of the article goes on how the tempreture data for the first hal of the centuary was cold, the second half was hot...

    I assume that he means taken the whole centruary into account the temp balances itself out....


  • Registered Users, Registered Users 2 Posts: 13,104 ✭✭✭✭djpbarry


    robtri wrote: »
    actually it is taken out of context, as the next part of the article goes on how the tempreture data for the first hal of the centuary was cold, the second half was hot...

    I assume that he means taken the whole centruary into account the temp balances itself out....
    Which is complete nonsense. This guy is supposed to be a scientist and he's trying to say that there's no upward trend visible in this data?


  • Registered Users, Registered Users 2 Posts: 5,473 ✭✭✭robtri


    djpbarry wrote: »
    Which is complete nonsense. This guy is supposed to be a scientist and he's trying to say that there's no upward trend visible in this data?

    no thats not what he said....
    baiscally that data starts of in 1910 at around -.4 and ends at just over +.4 so the overall average is 0....... thats all he is saying...

    anyway I thought you wouldn't trust wikipedia, but like selctive quotes you use it to support your case...


  • Registered Users, Registered Users 2 Posts: 13,104 ✭✭✭✭djpbarry


    robtri wrote: »
    no thats not what he said....
    baiscally that data starts of in 1910 at around -.4 and ends at just over +.4 so the overall average is 0....... thats all he is saying...
    I've no idea how you could interpret his words in such a manner. He clearly states that no trend is visible, when a trend clearly is visible.
    robtri wrote: »
    anyway I thought you wouldn't trust wikipedia...
    I don't, but of course, we both know that the same data can be sourced from NASA's website, don't we?


  • Closed Accounts Posts: 225 ✭✭e04bf099


    djpbarry wrote: »
    I've no idea how you could interpret his words in such a manner. He clearly states that no trend is visible, when a trend clearly is visible.
    I don't, but of course, we both know that the same data can be sourced from NASA's website, don't we?
    Stick to your own rules and back up your claims. Quote? Or else it is just your interpretation against his, and his seems more plausible. And you broke your own rules twice by not discussing the link. Poor.


  • Advertisement
  • Closed Accounts Posts: 225 ✭✭e04bf099


    Can anyone tell me how they measure global ocean temperature? Is that surface temperature? How do they deal with the lag of stored heat in all of the deep oceans?

    If thats asking a lot then don't worry about it. Just seems like there would be dispute as to how to measure temp decreases and increases in such a dinamic and massive body of liquid.


  • Registered Users, Registered Users 2 Posts: 13,104 ✭✭✭✭djpbarry


    e04bf099 wrote: »
    Stick to your own rules and back up your claims.
    What claims haven't I backed up?
    e04bf099 wrote: »
    Quote? Or else it is just your interpretation against his, and his seems more plausible.
    Really? So whether or not there is an upward trend here is open to interpretation?
    e04bf099 wrote: »
    And you broke your own rules twice by not discussing the link.
    What link have I not discussed?


  • Closed Accounts Posts: 341 ✭✭auerillo


    e04bf099 wrote: »
    Can anyone tell me how they measure global ocean temperature? Is that surface temperature? How do they deal with the lag of stored heat in all of the deep oceans?

    If thats asking a lot then don't worry about it. Just seems like there would be dispute as to how to measure temp decreases and increases in such a dinamic and massive body of liquid.

    "Since the 1980's satellites have been increasingly utilized to measure SST and have provided an enormous leap in our ability to view the spatial and temporal variation in SST. "

    http://www.csc.noaa.gov/crs/cohab/hurricane/sst.htm


  • Registered Users, Registered Users 2 Posts: 13,104 ✭✭✭✭djpbarry


    e04bf099 wrote: »
    Can anyone tell me how they measure global ocean temperature?
    Information on the compilation of sea-surface temperatures is available here:
    http://hadobs.metoffice.com/hadsst2/rayner_etal_2005.pdf


  • Closed Accounts Posts: 47 hiwayman


    auerillo wrote: »
    "Since the 1980's satellites have been increasingly utilized to measure SST and have provided an enormous leap in our ability to view the spatial and temporal variation in SST. "

    http://www.csc.noaa.gov/crs/cohab/hurricane/sst.htm

    Thanks a lot. Thats interesting.


  • Advertisement
  • Closed Accounts Posts: 225 ✭✭e04bf099


    djpbarry wrote: »
    What claims haven't I backed up?
    Really? So whether or not there is an upward trend here is open to interpretation?
    What link have I not discussed?
    What claims have you backed up? We can all answer with questions. That serves only to occupy time. Re-read the threads to figure out the things you've neglected to back-up. You'll find them not too far back.


  • Registered Users, Registered Users 2 Posts: 13,104 ✭✭✭✭djpbarry


    e04bf099 wrote: »
    Re-read the threads to figure out the things you've neglected to back-up. You'll find them not too far back.
    If they're not too far back, then you should have absolutely no trouble in drawing my attention to them.


  • Closed Accounts Posts: 225 ✭✭e04bf099


    djpbarry wrote: »
    If they're not too far back, then you should have absolutely no trouble in drawing my attention to them.
    The reason i wouldn't do that is that I don't wish to invite another pedantic question, in the guise of debate and discussion, but fooling nobody. So when you figure out what I was talking about (which you'll find, with a modicum of effort, that it is perfectly transparent) then you can respond to my point accordingly.

    Goodluck, we know you can do it!;)


  • Registered Users, Registered Users 2 Posts: 13,104 ✭✭✭✭djpbarry


    e04bf099 wrote: »
    The reason i wouldn't do that is that I don't wish to invite another pedantic question, in the guise of debate and discussion, but fooling nobody. So when you figure out what I was talking about (which you'll find, with a modicum of effort, that it is perfectly transparent) then you can respond to my point accordingly.

    Goodluck, we know you can do it!;)
    If this is the sum total of what you have to contribute, then please don't bother posting further.

    If there is some point you wish to discuss, then discuss it.


  • Closed Accounts Posts: 225 ✭✭e04bf099


    djpbarry wrote: »
    If this is the sum total of what you have to contribute, then please don't bother posting further.

    If there is some point you wish to discuss, then discuss it.
    You can't ask me not to post, just because I won't play your stupid pedantic game, that EVERYONE can see, including yourself probably.

    Why are you trying to take this off-topic, ffs!


  • Registered Users, Registered Users 2 Posts: 13,104 ✭✭✭✭djpbarry


    e04bf099 wrote: »
    You can't ask me what to post...
    Perhaps not. I can, however, tell you what not to post. If your next contribution is not relevant to the topic at hand, you'll be taking a little vacation from the Green Issues forum.


  • Posts: 31,896 ✭✭✭✭ [Deleted User]


    The UK met office have released all their (current) records, I have downloaded some of them and quickly knocked up a few charts in Excel.

    Source Data.
    Number= 039690
    Name= DUBLIN AIRPORT
    Country= IRELAND
    Lat= 53.4
    Long= 6.3
    Height= 68
    Start year= 1851
    End year= 2009
    First Good year= 1851
    Source ID= 30
    Source file= Jones+Anders
    Jones data to= 1991
    Normals source= Data
    Normals source start year= 1961
    Normals source end year= 1990
    Normals= 5.1 5.0 6.3 7.9 10.6 13.4 15.1 14.8 13.1 10.8 7.2 6.0
    Standard deviations source= Data
    Standard deviations source start year= 1941
    Standard deviations source end year= 1990
    Standard deviations= 1.5 1.6 1.3 1.0 0.9 0.9 0.9 1.0 0.9 1.2 1.0 1.3
    Obs:
    1851   5.8   5.7   5.9   7.0  10.3  13.4  14.2  15.1  12.3  10.6   4.6   5.9 
    1852   5.3   5.0   5.5   8.3  10.7  12.4  16.6  14.7  11.9   8.4   7.7   8.0 
    1853 -99.0 -99.0 -99.0 -99.0 -99.0 -99.0 -99.0 -99.0 -99.0 -99.0 -99.0 -99.0 
    1854 -99.0 -99.0 -99.0 -99.0 -99.0 -99.0 -99.0 -99.0 -99.0 -99.0 -99.0 -99.0 
    1855 -99.0   0.0   4.7   7.9   8.8  12.9  16.2  15.7  13.3   9.8   5.9   3.8 
    1856   4.1   5.7   4.6   7.7   9.2  13.2  15.3  16.4  12.4  11.2   6.9   4.8 
    1857   4.1   5.4   5.3   7.5  10.9  14.5  15.9  16.4  14.3  11.8   8.6   8.8 
    1858   6.4   4.6   5.8   8.2  10.9  15.4  14.2  14.6  14.4   9.7   6.3   6.9 
    1859   6.1   6.2   8.0   7.6  10.6  14.1  17.3  16.0  12.9  10.1   6.8   3.0 
    1860   4.3   3.3   5.3   6.4  11.7  12.2  14.4  13.5  11.4  10.7   6.3   2.7 
    1861   5.4   5.6   6.4   8.6  12.0  15.1  15.5  16.2  12.4  10.6   4.4   5.0 
    1862   5.3   5.7   6.3   9.2  11.5  12.7  13.2  13.8  12.8   9.9   3.8   7.0 
    1863   4.3   6.5   7.5   8.7  11.2  14.0  15.4  15.2  11.8   9.8   9.2   6.8 
    1864   4.5   3.0   5.7   9.9  12.3  13.4  15.7  13.9  13.3   9.9   6.8   5.0 
    1865   3.0   4.5   4.4   9.9  11.8  15.9  16.2  15.4  16.2  10.7   6.9   7.6 
    1866   6.1   4.7   4.9   8.4   9.5  14.0  15.5  14.4  11.6  10.6   7.2   7.1 
    1867   2.0   6.9   4.0   9.6  11.0  14.4  14.5  16.0  13.3  10.4   6.1   5.5 
    1868   5.4   6.7   7.8   9.2  12.1  14.8  17.1  15.2  14.0   9.1   6.5   7.4 
    1869   6.9   7.7   4.5   9.6   8.5  13.1  16.8  14.9  13.8  11.0   7.0   3.9 
    1870   4.6   4.0   5.8   9.4  12.1  14.2  15.8  14.4  14.1  10.2   5.6   2.0 
    1871   2.8   7.3   7.6   9.1  11.5  13.1  14.9  16.0  11.8  10.8   5.7   5.3 
    1872   5.2   7.4   6.8   8.4   9.9  13.5  16.1  15.1  12.9   8.4   7.0   5.3 
    1873   5.4   2.9   5.5   7.8  10.2  14.4  15.6  15.4  12.0   9.1   7.1   6.1 
    1874   4.2   5.0   7.5   9.4  10.1  13.4  15.9  14.8  12.9  10.0   7.6   2.2 
    1875   7.8   4.0   6.0   8.1  12.1  13.2  14.2  16.0  14.4   9.9   6.3   4.5 
    1876   5.5   5.6   4.4   7.9   9.5  13.2  16.0  15.4  12.8  11.6   7.5   6.7 
    1877   5.9   6.8   5.5   7.6   9.7  14.5  14.9  14.9  11.9  11.0   7.5   5.7 
    1878   5.5   6.8   6.4   9.1  11.8  14.8  16.6  15.9  13.9  10.9   3.5   0.2 
    1879   1.2   4.1   5.4   6.8   9.1  13.2  13.5  12.9  11.4   9.2   5.9   2.7 
    1880   3.6   6.4   6.7   7.3  10.5  13.6  14.8  15.7  14.2   7.0   6.2   5.1 
    1881  -0.4   4.2   5.6   7.3  11.3  13.2  15.5  13.6  12.2   8.5   9.8   4.4 
    1882   6.6   7.1   7.7   7.9  11.0  12.9  14.9  14.7  11.4   9.6   6.0   2.7 
    1883   5.5   5.9   3.2   7.6  10.3  13.2  13.9  14.6  12.3   9.5   6.3   5.1 
    1884   6.8   5.7   6.6   6.9  10.5  13.6  15.2  15.8  13.9   9.7   5.8   4.7 
    1885   4.5   5.4   4.6   7.7   8.7  12.4  15.2  13.2  11.8   7.4   7.4   4.9 
    1886   2.5   3.7   4.6   7.3   9.8  13.6  15.4  15.0  12.5  10.9   7.8   2.5 
    1887   4.6   5.0   4.3   6.4  10.0  15.9  16.7  15.4  11.8   8.0   5.4   3.7 
    1888   5.0   2.9   3.8   7.1  10.4  12.9  13.6  14.0  11.9   9.2   8.5   5.6 
    1889   5.2   3.8   6.0   7.4  11.9  14.1  14.1  14.5  12.9   8.5   7.6   5.9 
    1890   6.3   4.5   6.7   7.9  11.1  14.2  13.3  13.3  15.0  10.5   7.0   3.1 
    1891   3.7   6.0   4.5   6.5   8.9  14.6  14.7  14.4  13.6   9.2   5.7   5.4 
    1892   2.9   4.5   3.1   7.3  11.2  12.9  13.5  14.9  12.1   6.9   7.8   3.6 
    1893   4.2   5.2   7.7   9.6  13.0  14.6  15.8  16.4  12.5   9.5   6.0   5.6 
    1894   4.4   6.4   6.4   9.5   9.0  13.2  14.9  13.9  11.1   9.0   8.1   5.6 
    1895   1.3   0.3   6.1   8.2  11.3  14.2  14.4  15.0  14.3   7.2   8.0   4.6 
    1896   5.8   6.2   6.9   9.7  11.8  15.8  15.4  14.0  12.9   6.9   5.9   4.3 
    1897   2.4   6.8   6.7   7.4   9.7  14.6  15.7  15.5  12.2  11.2   8.6   6.7 
    1898   7.9   5.4   4.9   9.2  10.2  13.6  15.3  15.4  14.7  11.0   7.1   7.9 
    1899   5.0   5.4   6.5   8.4   9.6  14.8  16.2  16.1  12.9   9.3   9.7   4.6 
    1900   5.1   2.1   3.7   8.9  10.2  13.9  16.6  14.3  13.0   9.5   6.9   7.3 
    1901   4.8   3.1   4.5   8.2  10.4  12.9  16.6  14.8  13.4   9.3   6.4   3.9 
    1902   5.3   3.3   7.2   7.4   9.3  13.0  14.2  13.7  12.8  10.3   7.9   5.9 
    1903   4.6   7.5   6.7   6.7  10.4  12.4  14.6  13.1  12.0  10.2   6.7   4.0 
    1904   4.9   4.0   5.0   8.8  10.5  13.3  15.2  14.6  12.6  10.0   6.5   5.6 
    1905   5.7   5.6   6.4   7.4  10.9  14.2  16.7  14.0  12.0   7.5   5.3   7.6 
    1906   5.8   3.3   5.9   6.7  10.1  14.2  15.0  16.5  12.7  10.1   8.0   4.2 
    1907   4.8   3.6   6.9   7.5   9.5  12.3  14.6  14.1  13.6   9.6   6.4   5.7 
    1908   4.5   6.6   4.8   6.3  12.1  13.1  15.6  14.4  12.8  12.3   8.3   5.8 
    1909   5.3   5.0   4.3   8.6  10.7  12.1  14.8  15.1  11.2  10.0   5.6   4.5 
    1910   4.3   5.4   6.3   7.4  10.8  14.2  14.5  14.8  12.4  10.6   4.6   6.5 
    1911   4.6   5.4   5.8   8.7  12.2  13.9  17.2  16.2  12.8  10.0   6.3   6.5 
    1912   4.7   5.8   7.6   8.8  11.8  13.4  14.7  11.9  11.3   8.5   7.1   7.3 
    1913   5.3   5.4   5.7   8.2  11.1  13.6  14.4  14.8  13.0  11.0   8.5   5.5 
    1914   5.5   7.0   6.2   9.2  11.2  14.0  15.7  15.9  13.0  10.5   7.0   4.3 
    1915   3.9   3.8   6.0   8.6  10.2  13.5  14.3  14.6  13.2   9.6   4.3   5.4 
    1916   8.0   4.4   4.1   8.1  11.3  12.3  15.6  16.5  13.5  11.3   7.8   3.3 
    1917   2.8   2.8   4.6   6.4  11.8  14.1  15.9  15.3  13.9   7.7   9.1   4.2 
    1918   5.2   8.2   6.5   6.8  11.9  13.3  14.5  15.9  11.5   9.2   6.5   7.4 
    1919   3.8   3.3   4.1   8.2  12.5  13.6  13.3  15.2  12.1   9.2   3.5   6.3 
    1920   5.7   6.9   6.8   8.3  11.5  13.6  13.9  13.5  12.8  10.7   8.9   5.0 
    1921   7.8   5.7   7.4   8.0  10.9  13.9  17.5  14.2  13.6  12.2   7.6   7.6 
    1922   4.8   5.8   5.7   5.3  12.4  13.1  13.4  13.3  11.6   9.2   7.4   5.5 
    1923   6.2   6.3   6.7   7.6   9.2  13.6  16.5  14.4  12.1   9.9   4.1   5.5 
    1924   5.9   4.3   4.5   7.0  11.1  13.9  14.6  14.0  12.2   9.7   8.2   7.5 
    1925   6.2   4.4   5.6   7.5  10.8  14.4  15.6  15.2  11.4  10.6   4.4   4.1 
    1926   6.1   6.9   6.9   9.3  10.2  13.2  16.3  16.2  13.8   8.3   5.8   5.2 
    1927   4.9   5.1   7.6   8.8  10.9  11.9  15.5  15.1  12.0  10.5   6.4   4.3 
    1928   5.7   6.5   6.2   7.9  10.7  12.6  15.4  14.2  12.3  10.8   7.8   5.0 
    1929   3.8   4.2   6.4   7.5  11.1  12.9  15.2  15.0  14.0   9.8   6.7   5.7 
    1930   4.8   2.3   5.8   8.3  10.9  14.1  15.0  14.5  12.9  10.5   6.1   5.5 
    1931   3.9   4.8   4.6   7.9  10.7  14.5  14.7  13.8  11.5   9.3   7.9   6.5 
    1932   7.0   4.2   5.1   6.6  10.2  14.1  15.7  15.5  12.4   8.6   7.5   7.1 
    1933   3.3   4.3   7.2   9.8  12.0  14.8  17.3  16.8  14.4  10.6   6.4   4.5 
    1934   6.3   4.8   5.8   7.5  11.5  15.1  17.3  14.7  14.0  10.8   7.0   8.8 
    1935   5.5   6.1   7.2   7.5  10.1  14.2  16.0  16.0  13.2   9.8   6.4   3.9 
    1936   3.5   4.3   7.1   6.4  10.5  13.9  14.7  16.0  13.6  10.7   5.9   6.4 
    1937   5.8   5.3   3.0   9.2  11.7  13.7  15.3  15.7  12.7   9.4   6.9   3.8 
    1938   6.1   6.2   9.2   7.4  10.7  13.6  14.3  14.7  13.5  10.8   9.7   4.9 
    1939   4.2   6.6   6.7   8.7  11.4  13.8  14.9  15.3  13.4   9.2   9.2   4.3 
    1940   1.2   5.4   6.8   9.2  11.8  15.7  14.1  15.6  12.7  10.3   7.3   5.0 
    1941   1.5   3.8   5.5   6.7   9.7  14.3  15.1  14.4  14.9  11.0   7.2   6.8 
    1942   4.3   2.8   6.7   9.3  11.0  13.7  14.9  15.2  12.7   9.7   5.2   7.7 
    1943   5.8   6.7   6.9  10.1  10.7  13.7  15.1  14.9  12.7  11.0   7.2   5.1 
    1944   7.3   4.6   5.8  10.3  11.3  13.3  15.7  16.1  12.1   9.3   7.0   5.6 
    1945   1.8   8.1   9.0  10.0  11.6  14.3  15.7  15.2  14.2  12.0   8.4   7.3 
    1946   4.6   6.3   6.1   8.8  10.0  12.8  15.0  13.7  13.5  10.7   8.3   4.1 
    1947   4.0   0.6   4.5   8.8  11.7  14.3  14.9  16.9  14.0  11.5   8.3   5.9 
    1948   4.9   5.6   8.8   8.7  10.6  13.0  14.7  14.5  13.6  10.9   9.6   7.0 
    1949   6.3   6.6   6.2   9.6  10.7  14.7  15.9  15.4  15.0  11.6   7.6   6.0 
    1950   6.1   5.3   7.4   7.5  11.1  15.1  14.9  14.4  12.1  10.1   5.9   2.5 
    1951   4.4   3.2   4.6   6.4   9.3  13.4  15.3  13.9  13.7  11.2   8.1   6.0 
    1952   3.2   4.2   6.9   8.9  12.1  13.6  15.8  15.1  10.9   9.6   6.2   4.8 
    1953   5.3   5.5   5.7   6.8  12.1  13.4  14.6  15.1  13.8  10.4   8.7   7.9 
    1954   4.5   4.2   6.1   8.1  10.5  12.6  13.7  13.6  11.9  11.9   7.0   7.4 
    1955   3.9   2.0   4.1   9.4   9.3  12.8  16.1  16.8  14.0   9.1   8.4   6.9 
    1956   4.0   2.1   6.8   7.5  11.4  12.8  14.5  13.1  13.5  10.0   7.5   7.3 
    1957   6.1   4.9   9.4   8.4  10.4  13.7  15.1  14.6  12.3  10.7   7.3   6.0 
    1958   4.7   5.3   4.2   7.8  10.2  12.9  14.6  14.8  14.4  11.1   8.5   5.6 
    1959   3.2   6.4   7.3   8.7  11.7  14.1  15.9  16.0  14.4  12.1   7.7   6.4 
    1960   5.1   3.8   6.4   8.8  12.0  14.6  14.4  13.9  12.4  10.3   7.5   4.2 
    1961   4.4   7.6   8.6   9.3  10.7  13.4  13.9  14.2  13.7   9.9   7.1   4.2 
    1962   4.9   5.2   3.4   7.4   9.9  12.5  13.6  13.5  11.9  10.8   6.7   4.9 
    1963   0.8   1.7   6.4   7.9   9.7  13.2  13.8  13.6  12.1  11.2   7.8   5.2 
    1964   6.1   5.1   5.2   8.2  11.8  12.8  14.9  14.3  13.6   9.5   8.0   4.9 
    1965   4.0   4.2   6.0   8.3  11.0  13.7  13.2  14.2  11.9  11.3   5.5   5.1 
    1966   5.0   6.3   7.3   7.0  10.9  14.4  14.4  14.1  14.2   9.4   5.8   6.1 
    1967   5.4   5.8   6.8   8.7   9.0  14.0  15.4  14.3  13.1   9.9   6.3   5.6 
    1968   5.8   3.2   6.4   7.3   9.4  13.9  14.2  14.9  13.4  12.7   8.4   5.5 
    1969   5.8   2.1   4.5   7.7  10.5  13.1  16.0  15.3  13.1  13.3   5.4   5.1 
    1970   5.0   3.9   5.1   7.0  12.4  15.2  14.7  14.6  13.5  11.0   7.8   5.8 
    1971   6.0   5.9   6.0   7.8  10.7  12.4  15.7  14.6  14.7  12.8   7.3   8.0 
    1972   5.1   5.6   6.3   8.5  10.2  11.4  14.9  13.9  12.2  11.5   6.5   7.4 
    1973   6.8   5.5   7.1   7.7  10.9  14.5  15.1  15.4  13.7  10.2   7.4   6.1 
    1974   7.2   6.0   6.3   8.1  10.6  12.9  14.6  14.5  11.4   8.1   6.7   8.6 
    1975   6.8   6.5   5.6   8.8   9.8  14.3  16.6  16.4  12.7  11.3   7.7   6.1 
    1976   6.6   6.1   6.4   8.4  11.0  16.0  16.2  16.3  12.8  10.1   6.7   3.5 
    1977   3.5   5.6   7.5   7.6  10.3  12.5  15.6  15.2  13.3  12.2   6.1   7.7 
    1978   4.2   4.0   6.9   7.1  11.7  13.0  14.6  14.6  14.3  12.5   9.4   6.2 
    1979   2.4   3.4   5.0   7.6   9.4  13.9  15.9  14.3  13.2  11.6   8.1   5.8 
    1980   4.3   6.5   5.6   9.1  11.3  13.2  14.1  15.3  14.4   9.3   7.8   6.4 
    1981   6.2   5.0   8.2   7.8  10.5  12.9  14.5  15.7  13.9   7.4   8.3   3.2 
    1982   4.9   6.2   6.1   8.8  10.5  13.7  15.4  14.5  13.3  10.3   7.3   5.1 
    1983   6.7   3.4   7.1   6.0   9.3  13.2  17.3  16.4  13.2  10.5   8.8   7.6 
    1984   3.6   5.5   5.2   8.4   9.9  14.0  15.9  16.3  12.9  10.8   7.4   6.2 
    1985   2.9   4.8   5.4   8.5  10.0  11.9  14.8  13.2  14.4  11.3   5.1   7.1 
    1986   4.5   1.7   5.8   5.9  10.3  13.5  14.8  12.3  11.7  10.8   8.0   6.2 
    1987   3.9   4.9   5.2   9.6  10.5  12.2  15.6  15.2  12.8   9.1   7.2   7.8 
    1988   5.6   4.8   6.8   8.7  11.2  14.3  14.1  14.5  12.7  10.7   7.1   8.4 
    1989   7.7   6.4   7.4   6.6  11.9  13.8  17.5  15.8  13.7  12.0   8.1   6.5 
    1990   7.3   7.0   8.7   7.9  12.4  13.1  15.8  16.5  12.6  11.4   7.4   5.1 
    1991   4.6   3.9   7.9   8.0  11.8  12.4  16.1  16.5  14.3  10.0   7.2   7.0 
    1992   6.0   7.3   8.1   8.7  12.3  15.2  15.7  14.5  12.5   8.0   8.0   5.5 
    1993   7.0   7.1   7.4   9.8  10.5  14.2  15.0  14.5  12.4   8.5   6.8   5.7 
    1994   5.6   4.7   7.6   7.8   9.4  13.1  14.9  13.9  11.9  10.1   9.4   6.7 
    1995   4.6   6.0   5.3   8.6  10.3  13.1  16.3  17.4  12.7  12.4   7.7   4.5 
    1996   6.0   3.8   4.8   8.3   8.5  13.1  14.9  14.3  12.9  10.9   5.7   4.2 
    1997   4.2   6.2   7.7   8.8   9.9  12.4  15.0  16.0  13.0  10.5   8.3   6.4 
    1998   5.7   7.9   7.8   6.9  11.4  13.1  14.4  14.9  13.3  10.2   7.0   6.0 
    1999   5.4   5.6   7.2   8.8  11.6  12.2  15.9  14.6  14.2  10.3   7.6   4.6 
    2000   4.9   6.1   7.3   6.5  10.5  13.3  14.6  15.2  13.3   9.3   6.0   5.3 
    2001   3.6   4.3   5.0   7.2  11.4  12.8  15.2  14.9  12.8  12.3   7.8   4.6 
    2002   6.8   6.5   7.2   8.1  10.9  13.1  14.4  15.1  12.6   9.5   8.5   6.4 
    2003   5.1   4.8   6.9   8.9  10.9  13.9  16.2  15.8  13.5   9.1   7.9   5.2 
    2004   5.4   4.9   6.5   8.7  10.8  14.5  14.5  15.6  13.7   9.3 -99.0   6.4 
    2005   6.8   4.8   7.6   8.0  10.1  14.5  15.5  15.3  13.8  11.6   6.6   5.8 
    2006   5.6   5.0   5.5   8.0  10.9  14.6  16.9  15.2  14.7  11.6   7.6   6.7 
    2007   4.9   5.9   6.4  10.6  10.8  13.1  14.2  14.6  13.0  11.0   8.3   6.4 
    2008   6.4   5.8   6.0   7.6  11.6  12.8  14.9 -99.0  12.4   8.9   7.0   4.5 
    2009   5.5   5.1   6.7   8.3  10.9  13.2  14.9  15.4  12.6 -99.0 -99.0 -99.0 


    Here is one for Dublin with the yearly average temperatures plus a couple of trendlines one linear and the other based on 10 years
    98438.jpg

    Here is another for Dublin with the average temperatures in January and July, one reading per year.

    98470.jpg

    Note that it's the winters that are less cold rather than the summers getting warmer.


  • Closed Accounts Posts: 341 ✭✭auerillo


    The temperatures, which are over a long period, look remarkably like the temperatures for central England and Kilkenny too, which are here http://boards.ie/vbulletin/showpost.php?p=63398937&postcount=54 .

    From the figures there has been, between 1851 and 2005, a period of 154 years, no real increase in warming, whether global or otherwise. Indeed, Dublin appears, from the graph, to have had one of its coolest years since 1884, in the last few years.


  • Posts: 31,896 ✭✭✭✭ [Deleted User]


    Here's a chart from Hobart Australia, quite a heatwave in the late 19th century (or faulty instruments).

    98480.jpg


  • Closed Accounts Posts: 341 ✭✭auerillo


    This is great and thanks for posting it. It seems that Hobart, also, in the last 160 years, seems to have experienced no discernable increase in warming outside fluctuations over the period, and must join Dublin, Kilkenny and central England in all showing no signs of warming.


  • Advertisement
  • Posts: 31,896 ✭✭✭✭ [Deleted User]


    OK I am about to state the bleeding obvious!

    The longer the chart the more level the lines and the smaller the trend appears! Long enough and there is no rise at all!

    Most of the data released by the UK met office is from stations that only started to collect data 100 years or so ago, some have a very short history.

    Pity we dont have (real) measurements going back to the medevel warm period.


  • Posts: 5,082 [Deleted User]


    OK I am about to state the bleeding obvious!

    The longer the chart the more level the lines and the smaller the trend appears! Long enough and there is no rise at all!

    Most of the data released by the UK met office is from stations that only started to collect data 100 years or so ago, some have a very short history.

    Pity we dont have (real) measurements going back to the medevel warm period.

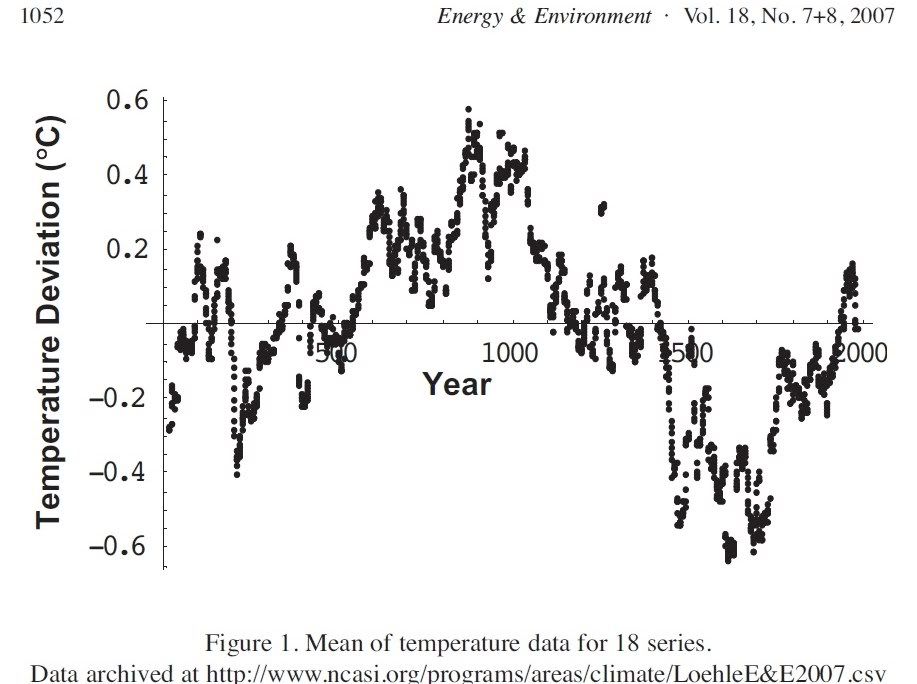
    And thats a BIG problem. When they combine different data sets i.e temperatures from observation stations and those from tree rings and ice and sea cores it can lead to dodgy statistics. They give different weights to different results and sure you can biase things any which way.
    Take this example
    http://www.drroyspencer.com/wp-content/uploads/Loehle-2000-year-non-treering-temp-reconstruction-Energy-and-Environment.pdf
    His argument is that tree rings can be influenced by all sorts of things not just weather so he reconstructs the weather over the past 2,000 years using only ONE dataset giving this result:

    TempGraph.jpg

    This one is from the IPCC
    figts-5.gif
    ^^ Gives a totally different result also note the colours - the red is observatories. Note the gray - thats the ERROR LEVELS from the past!!!


  • Registered Users, Registered Users 2 Posts: 13,104 ✭✭✭✭djpbarry


    Folks, can we cut down on the posting of the big charts please - not everyone has broadband.


  • Registered Users, Registered Users 2 Posts: 13,104 ✭✭✭✭djpbarry


    And thats a BIG problem. When they combine different data sets i.e temperatures from observation stations and those from tree rings and ice and sea cores it can lead to dodgy statistics.
    It’s something of a moot point – tree ring data is known to have a very high degree of uncertainty associated with it. Several papers have been published on the subject in recent years.
    This one is from the IPCC
    ...
    ^^ Gives a totally different result also note the colours - the red is observatories. Note the gray - thats the ERROR LEVELS from the past!!!
    Yep, great big error bars alright. You’ll note that the first plot you produce probably fits within that range of uncertainty. The point is that nobody can really say with any degree of certainty what the average temperature has been for the last 1,000 years or so and, with the publication of the above figure, this fact is recognised by the IPCC.


  • Closed Accounts Posts: 2,025 ✭✭✭zod


  • Closed Accounts Posts: 225 ✭✭e04bf099


    zod wrote: »
    Gore on climategate
    Gore is a f*ckin' retard, and so is anyone who believes a word he says. "over 10 years old", f*ckin' liar! His "example" is pure BS. I used to think politicians like him were bad people. They're not though, they're just don't know what they're talking about. He has bad advisors. F*ckin' ass-hole!


  • Registered Users, Registered Users 2 Posts: 19,976 ✭✭✭✭humanji


    e04bf099 wrote: »
    Gore is a f*ckin' retard, and so is anyone who believes a word he says. "over 10 years old", f*ckin' liar! His "example" is pure BS. I used to think politicians like him were bad people. They're not though, they're just don't know what they're talking about. He has bad advisors. F*ckin' ass-hole!
    If it's his advisors that are bad, why so much agression towards him?


  • Closed Accounts Posts: 191 ✭✭Mozart1986


    humanji wrote: »
    If it's his advisors that are bad, why so much agression towards him?
    Maybe what he means is that Al Gore has the responsibility to be better informed and to employ trustworthy advisors before presenting misleading information to the world's population. If I believed what somebody told me about something so serious as this which turned out to be wrong I would blame myself for lack of care and attention to the truth, as much as my advisor. His advisors are not making false or misleading assertions in the international media.


  • Closed Accounts Posts: 341 ✭✭auerillo


    Mozart1986 wrote: »
    Maybe what he means is that Al Gore has the responsibility to be better employed and to employ trustworthy advisors before presenting misleading information to the world's population. If I believed what somebody told me about something so serious as this which turned out to be wrong I would blame myself for lack of care and attention to the truth, as much as my advisor. His advisors are not making false or misleading assertions in the international media.

    A politician being misleading? I simply don't believe it!


  • Advertisement
  • Registered Users, Registered Users 2 Posts: 5,473 ✭✭✭robtri


    has anybody got a chart for global CO2 concentrations for the last 30 years or so??


Advertisement