Advertisement
If you have a new account but are having problems posting or verifying your account, please email us on hello@boards.ie for help. Thanks :)
Hello all! Please ensure that you are posting a new thread or question in the appropriate forum. The Feedback forum is overwhelmed with questions that are having to be moved elsewhere. If you need help to verify your account contact hello@boards.ie
Hi there,
There is an issue with role permissions that is being worked on at the moment.
If you are having trouble with access or permissions on regional forums please post here to get access: https://www.boards.ie/discussion/2058365403/you-do-not-have-permission-for-that#latest

The Sudden Stratospheric Warming

  • 02-11-2009 8:06pm
    #1
    Closed Accounts Posts: 2,693 ✭✭✭


    Well its now the time of year to be reintroducing this complicated subject.

    Those of you that followed the previous record breaking warming will understand some of this.I too along with many others are only learning as we go.

    On the last warming i learned alot from the people commenting on forum across the water and i have learned through them and my own research.

    So i am in no means an expert on this matter.

    I hope to gain much more knowledge through trial and error.

    So with your help, hopefully we can come together and discuss any new findings that will someday create a better understanding of all that relates to this( ie teleconnections ).


    Here's a good pdf file to kick start this and help others new to this subject


    http://www.nwra.com/resumes/baldwin/pubs/Thompsonetal_2002.pdf


    And heres a link to the previous stratospheric warming thread just to refresh the memories,

    http://www.boards.ie/vbulletin/showthread.php?t=2055469856


    Also this hugh link was my last post in above thread and i found it very informative.

    http://climatechange1.wordpress.com/2009/03/08/the-atmosphere-dancing-in-the-solar-wind-el-nino-shows-his-face/


    I,ve taken this from a post across the water because it also makes understanding a little easier.


    The stratosphere is the layer of the atmosphere situated between 10km and 50km above the earth. It is situated directly above the troposphere, the first layer of the atmosphere that is directly responsible for the weather that we receive. The boundary between the stratosphere and the troposphere is known as the tropopause. The air pressure ranges from around 100hPa at the lower levels to around 1hPa at the upper levels. The middle stratosphere is often considered to be around the 30hPa level.

    Every winter the stratosphere cools down dramatically as less solar UV radiation is absorbed by the ozone content in the stratosphere. The difference in the temperature between the North Pole and the latitudes further south creates a strong vortex – the wintertime stratospheric polar vortex. The colder the stratosphere, the stronger this vortex becomes. The stratospheric vortex has a strong relationship with the tropospheric vortex below. The stronger the stratospheric vortex, the stronger the tropospheric vortex becomes.

    The strength and position of the tropospheric vortex influences the type of weather that we are likely to experience. A strong polar vortex is more likely to herald a positive AO with the resultant jet stream track bringing warmer wet southwesterly winds. A weaker polar vortex can contribute to a negative AO with the resultant mild wet weather tracking further south.

    post-4523-1256989521338_thumb.jpg


    Occasionally the wintertime stratosphere can undergo dramatic warming events. These are called Sudden Stratospheric Warmings (SSWs) or Major Midwinter Warmings (MMWs). These are caused by large-scale planetary waves being deflected up into the stratosphere and towards the North Pole, often after a strong mountain torque event. These waves can seriously disrupt the stratospheric vortex, leading to a slowing or even reversal of the vortex. This can occur by the vortex being displaced off the pole – a displacement SSW, or by the vortex being split in two – a splitting SSW.

    The effects of a SSW can be transmitted into the troposphere as the propagation of the SSW occurs and this can have a number of consequences. There is a higher incidence of northern blocking after SSW’s but (after last winter) we are all aware that not every SSW leads to northern blocking. Last January we experienced a record breaking splitting SSW that was responsible for the pulse of easterly snow some areas received in February (directly from the split) but it did not lead to any major northern blocking.

    Here is a list of site that stratospheric information can be gained from:

    CPC- http://www.cpc.ncep....ere/strat-trop/

    ECM (from 1/11 hopefully) - http://strat-www.met...n/diagnostics?1

    JMA - http://ds.data.jma.g...x.html#monit_nh

    NCEP data- http://acdb-ext.gsfc...t/ann_data.html

    The sudden stratospheric warming site - http://www.appmath.c.../ssws/index.php

    One major influence on the stratosphere is the Quasi-Biennial Oscillation (QBO). This is a tropical stratospheric wind or gravity pulse that has a rough two year cycle. This wind descends from the top of the stratosphere towards the troposphere in an either westerly or easterly direction. Presently we are in an easterly phase of this wind which is flowing in an opposite direction to the polar vortex flow. It has been shown that an easterly QBO will lead to warming of the stratosphere and therefore this is more favourable in reducing the polar vortex.

    Please remember that the purpose of this thread is to monitor the state of the stratosphere and discuss the implications that this may have on the troposphere and how this may affect us. I politely request that any climate change discussion is kindly left outside of this thread. Many of the charts posted in this thread may be difficult to understand if you have not seen them before, so please do not hesitate to ask if you require an explanation and I will do my best to explain (if I can!).


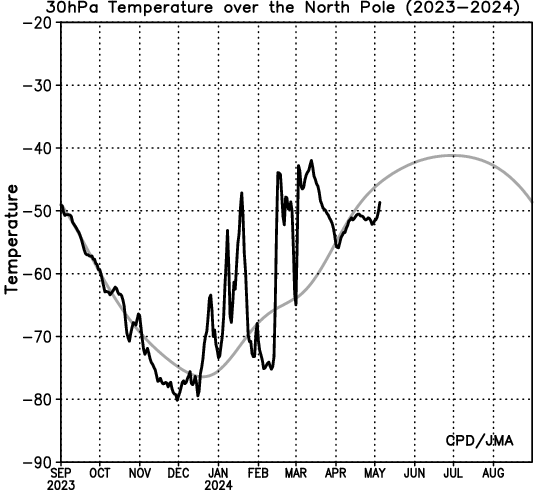
    The cooling of the stratosphere this autumn so far has been far from uniform with some minor warmings along the way when comparing to last autumn. Presently we are slightly above average for this time of year and the stratospheric vortex is correspondingly below average with some slight negative zonal wind anomalies.

    post-4523-1256989559837_thumb.gif

    http://www.cpc.ncep....re/30mb9065.gif

    http://www.cpc.ncep....OND_NH_2009.gif


    So thats it for now,hoping to read all your thoughts on this so we can try get our heads around it once and for all.


Comments

  • Closed Accounts Posts: 2,693 ✭✭✭Redsunset


    OVERVIEW OF THE STRATOSPHERE'S COMPOSITION, STRUCTURE, AND DYNAMICS

    In order to understand transport of ozone in the stratosphere, we need to understand some key concepts. First, stratospheric air is very thin and becomes even thinner with increasing altitude. Second, stratospheric air is very stable, and vertical motion in the stratosphere is quite slow. This is because of the temperature structure there: temperatures rise with altitude. Third, the very long lived gases in our atmosphere become uniformly mixed by transport processes.

    Finally, the stratosphere can be divided into four distinct regions: (1) the tropics, which stretch from about 20°N to 20°S; (2) the middle latitudes or "surf zone"; (3) the polar vortex; and (4) the lowermost stratosphere. The structure of the stratosphere is primarily discussed in Chapter 2 as part of a discussion on the structure of the entire atmosphere. Here in this section, we will re-emphasize some of the key points of Chapter 2 with respect to mixing and transport processes in the stratosphere. We will discuss the density of air in the stratosphere, and how the temperature structure affects the stability (or buoyancy) of air. We will then discuss the well-mixed nature of our atmosphere. Finally, we will describe the basic regions of the stratosphere (a key background description for all of the subsequent sections of this Chapter).
    2.1 The Density and Temperature of Air

    The stratosphere is not a good place to be. First, the ozone in the stratosphere, which protects us from biologically destructive solar ultraviolet light, exists at such high levels that the air itself is toxic. Second, even this toxic air is much too thin for normal breathing. Finally, temperatures in the stratosphere are lethally frigid.

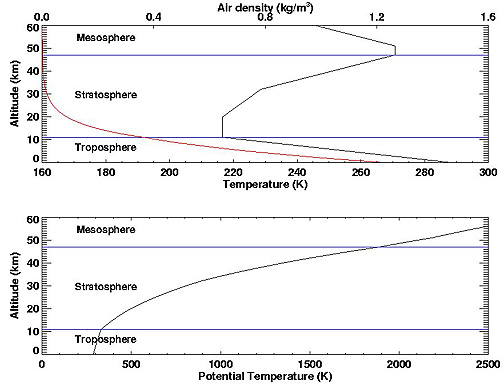
    2.1.1 Air Density Change With Altitude -- The density of the atmosphere decreases with altitude. This density decrease is notable on high mountain tops (such as Mt. Everest) where the lower air density makes breathing more difficult. In fact, commercial airliners must be pressurized to provide enough air for normal breathing by passengers. The density of air at an altitude of 16 km (50,000 feet) is only about 13% of the density of air at the surface. The red curve in the top panel of Figure 6.016-01.jpg shows a typical vertical profile of density from the ground to 60 km. The density of air near the top of the stratosphere is nearly zero.
    2.1.2 Air Temperature Change With Altitude -- The temperature of the atmosphere at first decreases with altitude and then increases. Temperatures decrease with altitude in the troposphere, the region between the surface and about 11 km. This is the region where we live and where weather occurs. Temperatures are first steady and then increase in the stratosphere, the region of the atmosphere from 11 km to about 47 km. The black curve in the top panel of Figure 6.01 shows a typical vertical profile of temperature from the ground to 60 km. The temperature is given in degrees Kelvin, abbreviated K, where Kelvin temperature = Celsius temperature (°C) + 273. Thus, 273 K corresponds to 0°C (or 32°F).

    Temperatures drop to just under 220 degrees Kelvin (-53°C or -63°F) at the top of the troposphere. Temperatures begin to rise in the stratosphere, though temperatures remain bitterly cold by most surface standards.

    2.1.3 The Tropopause -- The troposphere is separated from the stratosphere by the tropopause. Shown in Figure 6.01 as the horizontal black line at 11 km, the tropopause is an important feature of the atmosphere, as it marks the region where the temperature structure changes. Below the tropopause, temperatures decrease with altitude, while above the tropopause, temperatures increase up to about 47 km, which marks the top of the stratosphere. The troposphere and stratosphere are thus defined by their vertical temperature structures.
    2.2 Potential Temperature and the Stability of Stratospheric Air

    It is commonly recognized that warm air rises, and cold air sinks. This is because warm air is less dense than cold air. A simple test of this is to put a layer of cold water (perhaps with a dye) on top of a layer of warm water. The layers will overturn and mix. In the troposphere (where we live and see our weather), it is almost always the case that colder air overlays warmer air. The warm air is heated at the surface and it rises up. Under the right conditions, water vapor condenses out of the air and we see large clouds that appear to boil upwards. This is a process known as convection. Thunderstorms form by such convection.

    2.2.1 Static Stability -- Because temperature increases with altitude in the stratosphere, warmer air overlays colder air. As a result of this temperature structure, convection never happens in the stratosphere. If we could displace an air parcel to a higher altitude in the stratosphere, it would be colder than its surroundings. Cold air is more dense than warm air, and the parcel would sink back to its original location, though it would overshoot slightly because of its momentum. After overshooting, it would drop to a location where it would be warmer than its surroundings. Warm air is less dense than cold air, and the parcel would rise back to its original location, though it would once again overshoot slightly. This process would continue in a series of vertical oscillations about some equilibrium altitude where the parcel density and the surrounding air (ambient) density were the same.

    Such up and down oscillations of air (like a bob on the end of a rubber band) are indeed observed in the atmosphere. In the stratosphere, this oscillation has a period of about 40 seconds. In the troposphere, the same sort of displacement has a period of about 70 seconds. The faster oscillation in the stratosphere occurs because of the fact that air in the stratosphere gets warmer with altitude. This means that the air has greater static stability or greater buoyancy in the stratosphere. The greater stability in the stratosphere is the reason why vertical motions of air are not easily accomplished there. We speak of the stratosphere as being "stably stratified".

    2.2.2 Potential Temperature and Static Stability -- The stability is calculated from the vertical change of a quantity known as potential temperature. We discussed potential temperature in Chapter 2, Sections 3.3.2 and 5.2.1. Recall that potential temperature is defined as the temperature an air parcel would have if compressed adiabatically (i.e., without any heat being added or taken away, such as would happen if water vapor condensed out of the parcel) from its existing pressure to a reference pressure of 1000 millibars. The way potential temperature changes with height determines the static stability of the air. If potential temperature rises with height, the air is said to be stably stratified. If it falls with height, air is said to be unstably stratified. If it does not change with height, the air is said to be neutrally stratified.

    2.2.3 Potential Temperature Profile in the Stratosphere -- In the stratosphere, potential temperature always rises with height. That is, the stratosphere is always stably stratified. Figure 6.01 Bottom Panel shows a typical potential temperature vertical profile.
    In Figure 6.01, potential temperature is given in degrees Kelvin (K). We can see in the figure how potential temperature becomes quite large at higher altitudes in the stratosphere, reaching almost 400 K (127°C or 261°F) at 16 km altitude and 500 K (227°C or 441°F) at 20 km altitude. (Recall that this is the temperature the air at that level would have if compressed adiabatically to the 1000 mb).

    2.2.4 Isentropic Surfaces and the Motion of Stratospheric Air -- If we choose a particular potential temperature, all of the air with this particular potential temperature will form a surface called an isentropic surface. In fact, potential temperature divided by 25 is about equal to the altitude in kilometers (i.e., 400 K = 400/25 = ~16 km and 500 K =500/25= 20 km). Because potential temperature becomes so large at higher altitudes in the stratosphere, it is difficult to move air upward or downward. Stratospheric air tends to remain on an isentropic surface for many days. Vertical motions are consequently very small.

    2.2.5 Potential Temperature as a Vertical Coordinate -- Potential temperature is widely used as a vertical coordinate because air in the stratosphere tends to move along surfaces of constant potential temperature. The potential temperature of an air parcel is only changed by addition or removal of heat. This is known as a diabatic process, the opposite of an adiabatic process. Thus, the potential temperature of an air parcel remains about constant even if its temperature and pressure are changing.
    2.3 Air Composition and Its Well-Mixed Nature

    Air is primarily composed molecular nitrogen and molecular oxygen, with an assortment of minor or trace gases, such as argon, carbon dioxide, water vapor, and ozone, as well as many others, making up the rest. A parcel of air contains about 78% nitrogen molecules (N[SIZE=-2]2[/SIZE], molecular weight of 28), 21% oxygen molecules (O[SIZE=-2]2[/SIZE], molecular weight of 32 kg/kmol), and the remaining 1% are the trace gases. From this basic composition, the apparent molecular weight of air is about 28.964 kg/kmol. Both molecular nitrogen and oxygen decrease with altitude at exactly the same rate as overall air density. This means that the composition of air is approximately the same in both the troposphere and the stratosphere. The relative amounts of nitrogen and oxygen (78% and 21%) persist up to about 120 km, where atmospheric pressure is a tiny fraction of that of surface pressure.

    2.3.1 Turbulent Diffusion and the Homosphere -- While the molecular oxygen is heavier than molecular nitrogen, the two gases do not stratify in our atmosphere according to their weights. The gases don't stratify because parcels of air are thoroughly mixed into a uniform soup by wind currents, convection, and large-scale circulation patterns. These stirring processes are such that there is very little variation in the atmosphere for gases like nitrogen and oxygen. Such mixing is known as turbulent diffusion and it is very important from the surface up to about 120 km. This region is known as the homosphere, the region of the atmosphere where gases are uniformly mixed.

    2.3.2 The Heterosphere -- Above 120 km, gases begin to stratify according to molecular weight. Air is so thin at this altitude that individual molecules are able to accelerate to high speeds before bumping into another molecule. The lighter gases accelerate more than the heavier gases, and as a result, the atmosphere begins to stratify according to their molecular weight. This region above 120 km is called the heterosphere, the region of the atmosphere where gases stratify according to their molecular weight.

    2.3.3 Trace Gas Variability -- Many of the trace gases have variable concentrations. These include variations in both place and time. Trace gases variability can be due to a number of different reasons. Among the reasons for trace gas variability are phase change (e.g., water vapor changes to liquid water), chemical reaction (e.g., nitric acid is formed in the polar stratosphere when certain reactions occur, as shown in Chapter 11), creation by human activity (e.g., chlorofluorocarbons are developed), or photochemistry (e.g. ozone is created and destroyed by ultraviolet light from the sun). Each of these can cause trace gases to display large variations in their atmospheric concentrations.
    2.4 The Stratosphere

    We already know that the atmosphere is partitioned into distinct regions based on the temperature structure in the region. Temperatures fall with altitude in the troposphere. Temperatures rise with altitude in the stratosphere (see Figure 6.01). It is at the tropopause where the transition from decreasing temperature with altitude to increasing temperature with altitude occurs. The tropopause separates the troposphere from the stratosphere (see Chapter 2).

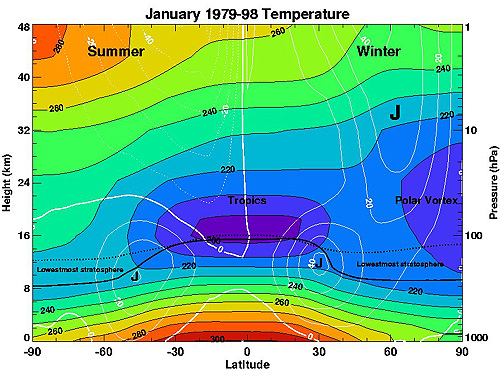
    2.4.1 Position of the Tropopause -- The position of the tropopause varies with latitude. In the tropics, the tropopause is located at an altitude of about 16 km or 50,000 feet. This corresponds to the 380 K isentropic surface. In the polar regions, the tropopause is as low as 8 km or 30,000 feet. Figure 6.026-02.jpg shows a color image of zonally-averaged January temperatures from the South Pole to the North Pole and between the surface and 48 km (158,000 feet), averaged from 1979-1998. The tropopause is superimposed on Figure 6.02 as the thick black line. The tropopause is highest in the tropics, and lowest at polar latitudes.
    2.4.2 Regions of the Stratosphere -- The stratosphere itself can be divided into four distinct regions: (a) the tropics, which stretch from about 20°N to 20°S; (b) the middle latitudes or "surf zone," (c) the polar vortex; and (d) the lowermost stratosphere.

    (a) The tropics -- The tropics is a region of the stratosphere that stretches from about 20°N to 20°S. It is here that ozone has its photochemical source region, since it is here that there is enough of the necessary highly energetic ultraviolet radiation from the Sun to create ozone. As we shall see in section 3, ozone is transported out of this region and poleward by a broad circulation pattern.

    (b) The surf zone -- The middle latitudes of the stratosphere is known as the "surf zone." Much like surf on a beach is characterized by turbulent overturning and mixing of water, the stratospheric surf zone is analogously characterized by a turbulent looking mixture of air masses, each of which contain differing amounts of ozone. Because of the equator-to-pole circulation pattern, tropical air contains less ozone than polar air. As a result of weather systems in the middle latitudes, tropical (low ozone) and polar (high ozone) air are mixed together. This gives the surf zone its turbulently mixed appearance. (For a preview, look ahead at Figure 6.18, which shows the complicated structure of the surf zone.)

    (c) The polar vortex -- In winter, stratospheric winds typically blow from west to east (referred to as the westerlies by meteorologists). As discussed in Chapter 2, a band of strong winds referred to as a jet stream sets up along the zone of greatest temperature change. In the stratosphere, this occurs in winter along the polar night terminator, the line that divides sunlight from the long polar night. (This occurs north of the Arctic Circle and south of the Antarctic Circle.) The jet stream that sets up here is called the polar night jet. It should not be confused with the polar jet stream, which together with the subtropical jet stream are features of the upper troposphere. The region poleward of the northern polar night jet is known as the Arctic polar vortex, while the region poleward of the southern polar night jet is known as the Antarctic polar vortex, which is a region of air isolated from the rest of the stratosphere where the long polar night allows extremely cold temperatures to develop. The degree of isolation, however, is quite different between the Arctic and Antarctic (see Chapter 11). Special conditions inside the more isolated Antarctic polar vortex allow human-produced chlorofluorocarbon (CFC) compounds to destroy ozone each spring, creating the "ozone hole" phenomenon (see Chapters 1, 5, 11).

    Figure 6.02 shows the situation for January, the northern hemisphere winter and southern hemisphere summer. It reverses itself six months later. The wind patterns are indicated by the white lines on Figure 6.02, with jet streams indicated by the bold J's on the figure. Solid white lines indicate westerly winds, while dashed white lines indicate easterly winds.

    The (northern) polar night jet is located in the middle to upper stratosphere, with its core of fastest wind speeds around 32 kilometers.
    We see in Figure 6.02 that in the summer hemisphere, the polar vortex has vanished. Stratospheric winds weaken and actually reverse direction, becoming easterly. This seasonal dynamical variability is discussed in Chapter 2, but it is related to the long period of sunlight over the summer pole (during the polar day) and the presence of ozone, which absorbs some of the solar energy and warms the region. This results in a reverse temperature gradient, and hence the winds reverse direction and become easterly.

    (d) The lowermost stratosphere -- A special region of the stratosphere is known as the lowermost stratosphere. This part of the stratosphere contains a mixture of both tropospheric and stratospheric air. Air in the troposphere has a different chemical composition (or fingerprint) than air in the stratosphere. In the lowermost stratosphere region, we find a mixture of the two. The lowermost stratosphere is delineated on the bottom by the tropopause and at the top by the 380 K potential temperature surface (shown in Figure 6.02 as the dashed line). In the tropics, the lowermost stratosphere is separated on the bottom at the core of the subtropical jet stream.


  • Closed Accounts Posts: 2,693 ✭✭✭Redsunset


    THE BREWER-DOBSON CIRCULATION
    Most ozone production occurs in the tropical stratosphere as the overhead sun breaks apart oxygen molecules (O[SIZE=-2]2[/SIZE]) into oxygen atoms (O), which quickly react with other O[SIZE=-2]2[/SIZE] molecules to form ozone (O[SIZE=-2]3[/SIZE]). The problem with this simplified picture is that most ozone is found outside the tropics in the higher latitudes rather than in the tropics. That is, most of the ozone is found outside of its natural tropical stratospheric source region. This higher latitude ozone results from the slow atmospheric circulation that moves ozone from the tropics where it is produced into the middle and polar latitudes. This slow circulation is known as the Brewer-Dobson circulation, named after Brewer and Dobson.


    The simple circulation model suggested by Brewer (1949) and Dobson (1956) consists of three basic parts. The first part is rising tropical motion from the troposphere into the stratosphere. The second part is poleward transport in the stratosphere. The third part is descending motion in both the stratospheric middle and polar latitudes, though there are important differences. The middle latitude descending air is transported back into the troposphere, while the polar latitude descending air is transported into the polar lower stratosphere, where it accumulates.

    This model explains why tropical air is lower in ozone than polar air, even though the source region of ozone is in the tropics. However, we are getting a bit ahead of ourselves, and it is necessary to look at the big picture in more detail.
    3.1 Stratospheric Circulation: the Big Picture

    In order to get a simplified view of this large scale circulation in the stratosphere, it is useful to look at transport processes in a zonally averaged sense, that is, averaged around a latitude circle. Figure 6.03 6-03.jpg
    shows this zonally averaged circulation in the middle atmosphere superimposed on top of an annual average ozone density (in Dobson Units per kilometer). This circulation is what we call the Brewer-Dobson circulation. It is depicted by the black arrows. The figure also shows the seasonally averaged ozone density (red denotes a high density of ozone; blue denotes low ozone density). The ozone data is based on 1980-1989 Nimbus-7 SBUV data.

    Brewer first proposed this slow circulation pattern to explain the lack of water in the stratosphere. He supposed that water vapor is "freeze dried" as it moves vertically through the cold equatorial tropopause (see Figure 6.02). Dehydration can occur here by condensation and precipitation as a result of cooling to temperatures below -80°C. The lowest values of water are found just near the tropical tropopause. Dobson later suggested that this type of circulation could also explain the observed high ozone concentrations in the lower stratosphere polar regions which are situated far from the photochemical source region in the tropical middle stratosphere. The Brewer-Dobson circulation additionally explains the observed latitudinal (i.e. north-south) distributions of long lived constituents like nitrous oxide and methane.
    3.2 The Brewer-Dobson Circulation in the Tropics

    The air that is slowly lifted out of the tropical troposphere into the stratosphere is very dry, with low ozone, and high CFC levels. This tropical lifting circulation out of the lower stratosphere is quite slow, on the order of 20-30 meters per day. Most of the air rising into the stratosphere at the tropopause never makes it into the upper stratosphere. Between 16 and 32 km, the air density decreases by about 90%. This means that of the mass coming into the stratosphere at 16 km, approximately 90% of that mass will move towards the middle latitudes rather than be carried up to 32 km.

    3.2.1 Ozone Source Region -- Air in the troposphere has relatively low ozone concentrations, except in highly polluted urban environments. Even polluted regions are relatively low when compared to stratospheric levels. As this "ozone clean" air moves slowly upward in the tropical stratosphere, ozone is being created by the slow photochemical production caused by the interaction of solar UV radiation and molecular oxygen.

    Ozone is created in this region because it is here that the Sun, positioned high overhead during the day all year long, is most intense. There is enough of the necessary sufficiently energetic UV light to split apart molecular oxygen, O2, and form ozone. It typically takes more than 6 months for air at 16 km (near the tropical tropopause) to rise up to about 27 km.

    Even though ozone production is small and slow in the lower tropical stratosphere, the slow lifting circulation allows enough time for ozone to build-up. Figure 6.03 shows this ozone density maximum up near 27 km. It is this that is commonly referred to as the "ozone layer".

    3.2.2 CFC Transport -- Another result of this mass circulation is that most CFCs are carried from the troposphere into the stratosphere in the tropics, and are then recycled back into the troposphere in the middle-to high latitudes. Since it is the intense UV in the upper stratosphere that breaks down CFCs, and since very few CFC molecules makes it to the upper stratosphere, the lifetime of CFCs are quite long. It is estimated that the time scale needed to reduce CFC-12 by 63% is approximately 120 years. This lifetime results from the very slow circulation and the decrease of density, which both significantly impact the rate at which CFCs reach the upper stratosphere and are broken down by UV light.
    3.3 The Brewer-Dobson Circulation in the Extratropical Latitudes

    In the stratosphere, the Brewer-Dobson circulation carries air from the equator to the poles. Poleward of about 30°N and 30°S, the circulation becomes downward as well as poleward. This poleward and downward circulation tends to increase ozone concentrations in the lower stratosphere of the middle and high (i.e. extratropical) latitudes. In Figure 6.03, we see this increase of ozone at lower altitudes in the higher latitudes as a direct result of this circulation.

    Another reason that ozone amounts increase in the lower stratosphere in the extratropical latitudes is that the lifetime of an ozone molecule gets longer here.

    Ozone is produced by molecular oxygen photolysis (producing two free oxygen atoms), and it is destroyed in catalytic reactions (generally utilizing free O atoms). Since there are very few O atoms in the lower stratosphere (because most of the UV necessary to produce them is absorbed at higher altitudes), the lifetime of ozone is very long. Thus, ozone is not easily destroyed in the lower stratosphere. As a result, ozone can accumulate as the Brewer-Dobson circulation moves air poleward from the tropical production region into higher latitudes and downward into lower altitudes.
    3.4 Theory of the Brewer-Dobson Circulation: Why Does It Exist?

    The mechanism behind the Brewer-Dobson circulation is both complex and quite interesting. At first glance, we might expect that the circulation results from solar heating in the tropics, and cooling in the polar region, causing a large equator to pole (meridional) overturning of air as warm (tropical) air rises and cold (polar) air sinks. While this heating and cooling does indeed occur, and while such a meridional overturning exists in the form of the so-called Hadley circulation , it is not the specific reason for the existence of the Brewer-Dobson circulation. Rather, the Brewer-Dobson circulation results from wave motions in the extratropical stratosphere. In this section, we assume that the reader has some familiarity with the concept and types of atmospheric waves.

    3.4.1 Standing Planetary Waves and Wave Breaking -- One type of atmospheric wave that exists is called the Rossby wave. Named for Carl G. Rossby, an early atmospheric research scientist, the Rossby wave exists due to a combination of meridional temperature gradients and the rotation of the planet (which produces the Coriolis force). The Rossby wave is a large-scale wave system whose size is thousands of kilometers in the horizontal and several kilometers in the vertical.

    Large-scale topographical features, like the Rocky Mountains and the Himalaya-Tibet complex, together with the meridional temperature gradients and Coriolis deflection, create a variation of Rossby waves called standing planetary waves. These have very long wavelengths (up to 10,000 kilometers) and either remain stationary or move slowly westward (i.e., they move easterly). They eventually propagate vertically into the stratosphere.

    3.4.2 Polar Night Jet Deceleration and Radiative Imbalance -- When a standing planetary wave reaches the stratosphere, it deposits its easterly momentum, decelerating the westerly wintertime stratospheric jet stream. This is the polar night jet we discussed in section 2.4.2-c and depicted in Figure 6.02. The polar night jet slows and can even be displaced, which has the effect of displacing the polar vortex region.
    The deposition of easterly momentum into the polar stratosphere and the deceleration of the polar night jet is known as "wave breaking" It produces the phenomenon of the stratospheric sudden warming as warmer middle latitude and even tropical air intrudes into the geographic polar region. This result is a situation that is thermodynamically imbalanced. Wintertime radiational cooling in the polar stratosphere quickly begins.

    3.4.3 Sinking Air and Meridional Overturning -- This cooling of air is accompanied by sinking motions, since colder air is more dense and it sinks. It is this sinking motion that establishes the meridional overturning from equator to pole in the winter hemisphere. That is, the sinking air in the polar region must be balanced by a poleward flow of air into this region. By mass continuity requirements, this air must come from the tropics. Our Brewer-Dobson circulation cell is thus established as tropical air moving poleward to replace the sinking air at the poles is itself replaced by rising air in the tropics (see Figure 6.03).

    A simple conceptual model for our Brewer-Dobson circulation is to use a paddle near the edge of a small circular pool. If you start paddling in one direction on the edge of the pool, in a short time, you'll set up a circulation that carries water fully around the pool (try this in your bathtub). You don't need to paddle everywhere in the pool, just at a single point and always in the same direction. The paddle in the stratosphere is the "wave activity" in the extratropical middle and upper stratosphere. This "wave activity" paddle causes the air to move poleward in the stratosphere, which causes the rising in the tropics, and the sinking in the polar region.

    So while the Brewer-Dobson circulation cell is created due to mass continuity requirements, ultimately, its existence is due to the breaking of planetary waves into the winter hemisphere polar stratosphere. Note that the Brewer-Dobson cell is a winter time circulation. It almost nonexistent in the summer hemisphere. There the net mass flux is small and slightly downward.

    3.4.4 Brewer-Dobson Circulation and Radiative Balance -- In the absence of any stratospheric waves and the consequent Brewer-Dobson circulation, the polar region in the middle of winter would be much colder than it actually is. Calculations show that without the waves and resulting Brewer-Dobson circulation, the polar stratosphere would be phenomenally cold. It is estimated that 30 km polar temperature would be about 160 K (-113°C or about -171°F), as opposed to the measured 200 K (-73°C or -99°F).

    The temperature field derived without any waves or circulation is known as the "radiative equilibrium". In the winter lower stratosphere, the circulation in the polar region is downward. This adiabatic descent (compression) results in temperatures that are warmer than the corresponding radiative equilibrium value, producing a slightly warmer radiative balance.
    3.5 Hemispheric Differences In Winter Transport

    We have seen that the Brewer-Dobson circulation features rising motions around the equator, poleward transport, and sinking motions in the higher latitudes. This is the general pattern. However, there are significant hemispheric differences in the strength and behavior of the Brewer-Dobson cell. We see this by examining the large-scale features of the zonal mean distributions of ozone, trace gases, temperature, and zonal wind in the stratosphere.

    3.5.1 Hemispheric Differences in Planetary Wave Activity -- The midwinter Brewer-Dobson circulation cells in the southern and northern hemispheres are quite different. The differences arise from the hemispheric differences in planetary wave forcing coming out of the troposphere (our "wave activity" paddle). Large-scale topographical features like the Rockies and the Himalaya-Tibet complex are mostly in the northern hemisphere. The southern hemisphere has significantly less land than the northern hemisphere and is almost entirely ocean from 55°S south to the Antarctic continent. The weak winter wave activity in the southern hemisphere means that the Antarctic polar vortex is much more isolated than its Arctic counterpart, and as a result, temperatures in the Antarctic polar vortex get extremely cold. These wave forcing differences have a profound influence on transport and result in the observed hemispheric differences in distribution of ozone and other stratospheric trace constituents.

    Because of the prominent topography and land-ocean contrasts in the northern hemisphere, the northern stratosphere has more frequent and intense planetary wave activity during the northern winter than the southern hemisphere stratosphere during the southern winter. This stronger wave activity in the northern hemisphere leads to a stronger Brewer-Dobson circulation in the northern midwinter than during the southern midwinter. As will be discussed in a later section, these horizontal mixing processes in the southern hemisphere are confined to the subtropics and middle latitudes, seldom reaching the polar (Antarctic) region. By contrast, in the northern hemisphere, mixing processes often extend into the polar (Arctic) region, owing to the significant planetary wave activity and resultant Brewer-Dobson circulation.

    In the section below, we consider the case of methane distribution and the seasonal hemispheric differences that result because of these differences in planetary wave activity.

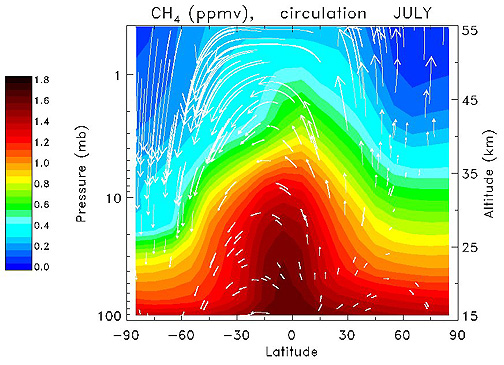
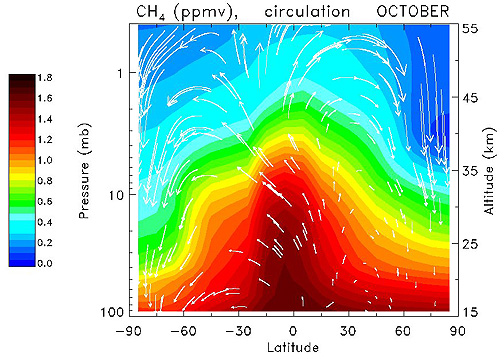
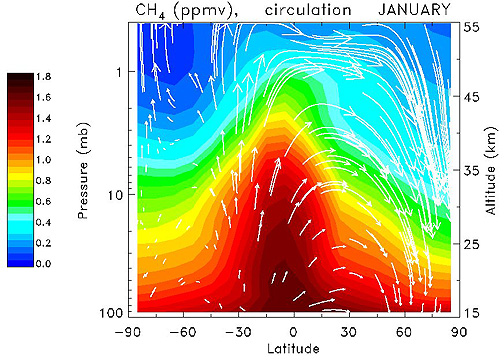
    3.5.2 Seasonal Hemispheric Differences in Methane Distribution -- This overall pattern of upward mass transport in the tropics and downward transport in the extratropics due to the Brewer-Dobson circulation cell is reflected in long-lived tracers such as methane (CH[SIZE=-2]4[/SIZE]). Figures 6.04a6-04a.jpg

    b,6-04b.jpg

    c,6-04c.jpg

    and d6-04d.jpg show methane distribution for January, March, July, and October respectively. Methane has its source region in the troposphere, and is lost in the stratosphere by a reaction with OH molecules and oxygen atoms.

    Like with ozone density, the contours of methane density are displaced upward in the tropics and downward at higher latitudes, reflecting the influence of the Brewer-Dobson circulation as shown by the arrows. The ascending branch of the Brewer-Dobson circulation carries high-methane air from the tropical lower troposphere into the tropical stratosphere, while the descending branch of the Brewer-Dobson circulation carries low-methane air from the polar upper stratosphere into the polar lower troposphere.

    Figures 6.04a and 6.04c show latitude-height distributions of CH[SIZE=-2]4[/SIZE] during January and July. The downward circulation during January (northern winter) between 60°N and the North Pole near 24 km (30 mb) is quite strong. In contrast, during July (southern winter) between 60°S and the South Pole near 24 km (30 mb), the circulation is noticeably weaker. Methane has a higher concentration in the Arctic in winter than in the Antarctic in winter.

    The downward circulation is greater in the winter northern hemisphere than in the winter southern hemisphere, and so the amounts of CH[SIZE=-2]4[/SIZE] are greater in the Arctic than the Antarctic. This is because stronger wave activity in the northern hemisphere results in more meridional mixing of air from lower latitudes into the Arctic than into the Antarctic. Air descending into the Arctic lower stratosphere has undergone mixing with higher methane air from the northern middle latitudes stratosphere. By contrast, weaker wave activity in the southern hemisphere results in less meridional mixing. Air descending into the Antarctic lower stratosphere is mostly undiluted lower methane mesospheric air carried down by the descending branch of the Brewer-Dobson circulation. The result is lower wintertime CH[SIZE=-2]4[/SIZE] concentration in the Antarctic than in the Arctic.
    3.6 Hemispheric Differences In Spring Transport

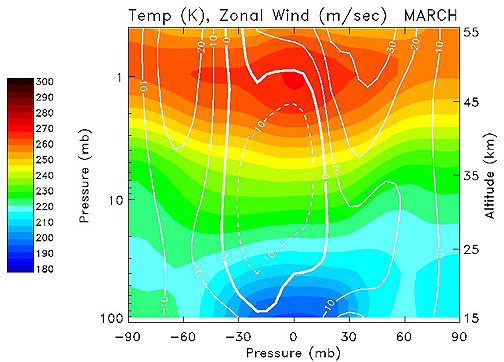
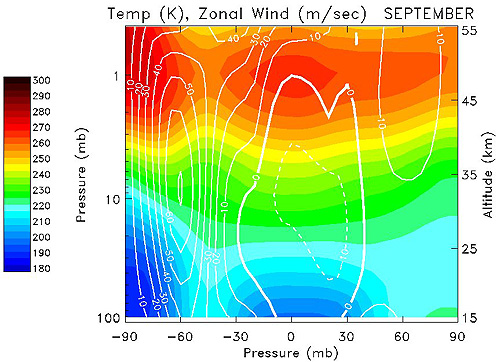
    The spring seasons also exhibit hemispheric differences in temperature, wind, and trace constituent distributions. Figures 6.05a 6-05a.jpg

    and 6.05b6-05b.jpg

    show the temperature and zonal wind fields for March and September, respectively.

    The northern hemisphere spring (March) is characterized by rather flat meridional temperature gradients and weak winds in both hemispheres. The corresponding March CH[SIZE=-2]4[/SIZE] distribution and air circulation (Figure 6.04b) have upward motion in the tropics, and relatively strong downward motion throughout the stratosphere in the extratropical latitudes of both hemispheres. The southern hemisphere spring CH[SIZE=-2]4[/SIZE] distribution and circulation (Figure 6.04d) shows a qualitatively similar picture, but note that the southern hemisphere spring (September) polar temperatures shown in Figure 6.05b are colder and the zonal winds are stronger than the corresponding northern hemisphere spring (March) case shown in Figure 6.05a.

    This difference is a direct result of the weaker planetary wave forcing during the southern winter and early spring compared to that in the northern hemisphere. The breakup of the southern polar vortex is delayed until late southern spring (November). The sharp meridional gradients in the long-lived tracer field across the southern polar vortex boundary (approximately 60°S) and the subsequent low tracer values within the wintertime polar vortex region (Figure 6.04c) also persist through the southern spring (Figure 6.04d).
    3.7 The Quasi-Biennial Oscillation (QBO) and the Brewer-Dobson Circulation

    Atmospheric weather and wave dynamics vary from year to year. These differences produce an interannual variability in the wave activity that affects the Brewer-Dobson circulation. One of the principal sources of year-to-year variability in the total ozone distribution is the quasi-biennial oscillation (QBO).

    Total ozone distribution is affected by the QBO for two reasons: (1) the QBO affects the stratospheric temperature structure, which in turn affects the photochemical balance of the upper stratosphere (see Chapter 5); and (2) the QBO directly modifies the Brewer-Dobson circulation.

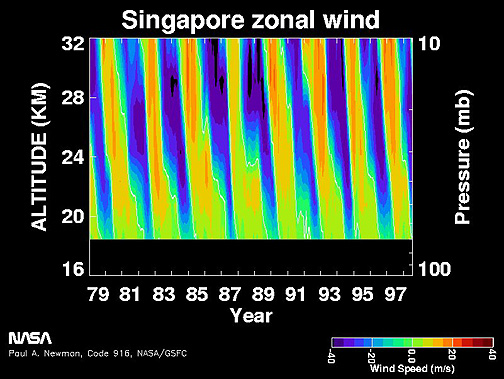
    3.7.1 What is the QBO? -- The QBO is an oscillation of the east-west wind in the tropical stratosphere. The QBO effect occurs throughout the tropics, but it is most often shown as a change in the direction of the stratospheric zonal wind at Singapore. Figure 6.066-06.jpg

    shows these zonal winds at Singapore (1°N, 104°E) from 1978-1998 between 18-30 km altitude.
    As we see in Figure 6.06, the wind direction over the tropical stratosphere changes sign (direction) about every year. However, because the QBO is due to the internal dynamics of tropical waves rather than the annual change of seasons cycle, the period of this wind oscillation is highly variable with periods ranging from 22 to 34 months. Hence the name, quasi-biennial oscillation, reflects the variable period of this phenomenon. The theoretical explanation of the QBO is given below in section 3.7.2-c. Note how winds blowing in one direction descend in altitude in time and are replaced by winds blowing in the opposite direction. We refer to winds blowing in a particular direction as a regime. There are westerly and easterly wind regimes associated with the QBO.

    Through satellite measurements, we can get a more detailed picture of the QBO phenomenon throughout the tropics. The QBO phenomenon shows up in the overall equatorial zonal wind field. These changes in wind direction produce temperature anomalies, which in turn modify the Brewer-Dobson circulation. These three QBO-related features--zonal wind, temperature, and Brewer-Dobson circulation--are discussed in the next three subsections.

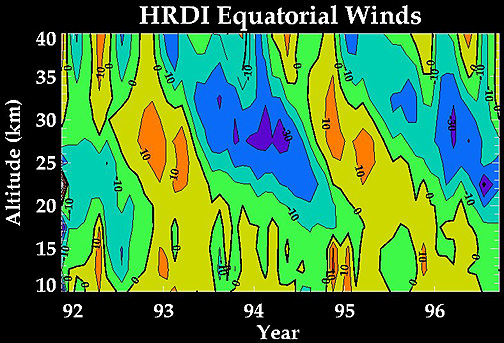
    (a) Equatorial zonal wind QBO -- Satellite measurements of stratospheric winds from the High Resolution Doppler Imager (HRDI) instrument on board the Upper Atmosphere Research Satellite (UARS) have been recently compiled. Although the general characteristics of the equatorial zonal wind QBO are similar to previous Singapore balloon based radiosonde observations, the satellite measurements extent to higher altitudes (approximately 40 km) and sample a wide range of latitudes and longitudes as compared to the more sparsely spaced radiosonde network. This is especially true of the tropical latitudes which have very few radiosonde stations. Figure 6.076-07.jpg

    is a plot of equatorial belt zonal winds for 1992-1996 measured by the HRDI instrument aboard the UARS.
    Both Figures 6.06 and 6.07 reveal the following unique characteristics of the tropical QBO. The QBO is generally observed between 20-35 km. The easterly winds are generally stronger than the westerly winds, persist longer at upper levels (approximately 30 km altitude), and have maximum wind speeds centered over the equator near 26 km. Westerly wind regimes descend faster in time and persist longer at lower levels than easterly wind regimes. Below 15 km, there is little evidence of the QBO, while above 35 km, the QBO coexists with another regular oscillation of the mesosphere known as the semiannual oscillation.

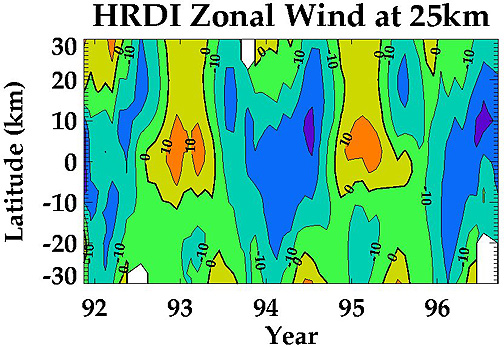
    The QBO extends in latitude between about 15°N and 15°S. Figure 6.08 6-08.jpg

    shows this latitudinal extension in a latitude versus time cross-section of zonal wind at 25 km. From Figure 6.08 we see that there is a distinct difference in the onset of the easterly and westerly phases. Westerly accelerations (the transition from purple to orange) first appear at the equator, and in time slowly spread to higher latitudes, while the easterly accelerations are more uniform in latitude. Near the equator, the oscillation is fairly symmetric, while in the subtropics, the oscillation combines with the annually (seasonally) varying westerlies of the winter hemisphere.

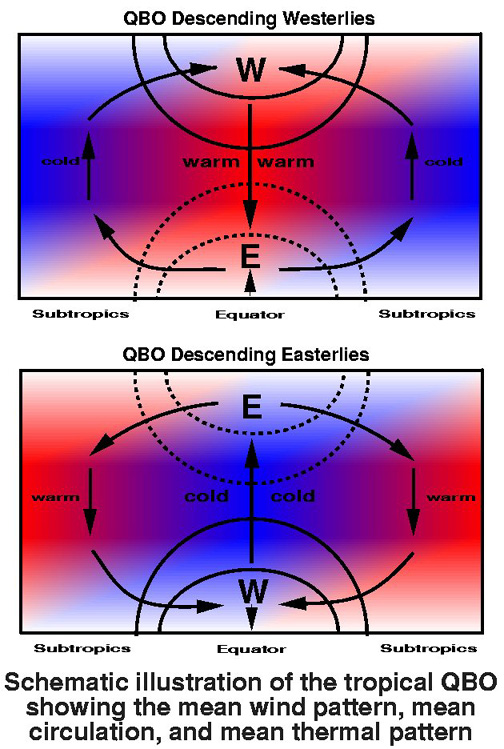
    (b) Temperature QBO -- Associated with the zonal wind QBO is a temperature QBO. The physical relationship between the zonal wind and the temperature is called the thermal wind relationship.

    Thermal wind balance is a relationship between horizontal temperature gradients and vertical wind shear (i.e. the way that the wind is changing with height). The greater this horizontal temperature gradient, the greater the vertical shear of the geostrophic wind. A positive temperature gradient from pole to equator (cold to warm) produces increasing westerly winds with height, while a negative temperature gradient from pole to equator (warm to cold) produces decreasing westerly or increasing easterly winds with height. This physical relationship shows that the transition zone between westerly and easterly winds will be a warm temperature region.

    This is shown schematically in Figure 6.09.6-09.jpg
    The top panel of Figure 6.09 shows a descending westerly QBO phase in which a warm temperature area is associated with positive wind shear (increasing westerly winds with height), as we expect through the thermal wind relationship. The bottom panel of Figure 6.09 shows a descending easterly QBO phase. Here a cold temperature area is associated with negative wind shear (increasing easterly winds with height), again as we expect via thermal wind balance.

    These temperatures can modulate ozone in two ways. First, in the tropical upper stratosphere, temperatures modulate photochemical reaction rates, such that warm temperatures are associated with lower ozone and colder temperatures are associated with higher ozone levels. Second, temperatures can directly impact the circulation by modifying the heating and cooling rates.

    (c) QBO circulation -- As mentioned in the previous section, the temperature anomalies associated with the QBO winds induce a modification to the normal Brewer-Dobson circulation. This QBO circulation is superimposed on our normal Brewer-Dobson circulation. Depending on which phase, this circulation will either be speeded up or weakened.
    The QBO descending easterly phase maintains colder temperatures between the overlying easterlies and underlying westerlies (see Figure 6.09). The result is that the infrared cooling to space will be smaller than normal in the QBO cold region. Because the heating from solar UV is approximately constant, the weakened cooling to space means that the total heating in the tropics is somewhat larger. This greater heating in the tropics results in a speeding up of the normal Brewer-Dobson lifting in the tropics.

    Conversely, the QBO descending westerly phase maintains warmer temperatures between the overlying westerlies and underlying easterlies (again, see Figure 6.09). The result is that infrared cooling to space will be greater than normal in the QBO warm region. Again, because the heating from solar UV is approximately constant, the greater cooling to space means that the total heating in the tropics is somewhat smaller. This lesser heating in the tropics results in a slowing up of the normal Brewer-Dobson lifting in the tropics.

    These downward and upward motions associated with the QBO at the equator are balanced by upward and downward motion in the subtropics, respectively. This circulation cell (pictured in Figure 6.09), which is connected by poleward or equatorward motions, is called the QBO-induced meridional circulation.

    The subtropical branch of the QBO-induced circulation cell is located approximately between 15°N and 15°S. As one might guess, the QBO-induced circulation has an influence on trace gas constituents in the tropical stratosphere. QBO signals in ozone, methane, hydrogen fluorine and nitrous oxide have been reported from long term satellite observations.

    3.7.2 Ozone Transport: Influence of the QBO -- (a) Tropical ozone QBO -- The QBO represents an important source of ozone variability throughout the lower stratosphere. The equatorial zonal wind QBO is confined to the equatorial stratosphere, a region where ozone is controlled by both transport and photochemistry. Below 30 km in the tropics, ozone is primarily under dynamical control, and thus is affected by the QBO-induced circulation that exists atop the Brewer-Dobson circulation. Above 30 km, ozone increasingly becomes under photochemical control, and thus responds to the QBO-induced temperature anomalies rather than transport effects.

    As discussed above, the descending westerlies of the QBO are associated with a vertical circulation pattern that produces downward motion in the tropics and upward motion in the subtropics, weakening the normal Brewer-Dobson circulation in the tropics. Because the upward motion of air is slowed down and because the vertical gradient of ozone mixing ratio is positive in the lower stratosphere (i.e. increasing ozone with altitude), ozone production can proceed for longer periods.

    The result is a positive column ozone anomaly in the tropics and a negative anomaly in the subtropics. In the descending easterly phase of the QBO when the Brewer-Dobson circulation in the tropics is enhanced, ozone production has less time to occur, and the column ozone anomalies are reversed, resulting in a negative ozone anomaly in the tropics and a positive ozone anomaly in the subtropics.

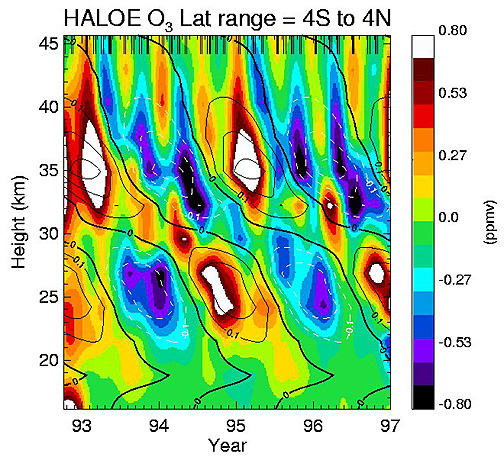
    Figure 6.106-10.jpg shows these ozone anomalies versus altitude for the 4°S to 4°N region. The data is based on the UARS HALOE instrument, with reds denoting high ozone and the blues denoting low ozone. In this figure, the time average has been subtracted out. Superimposed on the ozone anomalies in the black contours are the HRDI zonal winds.

    We see in Figure 6.10 alternating high and low ozone values in the 20-30 km altitude range, corresponding to the westerly and easterly shear zones of the QBO, respectively. Above 30 km, the ozone variability is controlled more by temperature dependent photochemical processes than transport. Thus, the ozone variation from 35-45 km is a response to the temperature variations due to both the QBO and the semiannual oscillation.

    (b) Extratropical ozone QBO -- Observations of QBO signals in dynamical variables and constituents fields, such as column ozone and water vapor, exist in the extratropical stratosphere. However, unlike the situation in the tropical stratosphere where the mechanism for the observed ozone anomalies is fairly well understood, there is no well accepted explanation for how the equatorial QBO anomaly is transmitted to extratropical latitudes.

    In fact, there is even debate as to how large an extratropical QBO signal exists. Estimates of the magnitude of the midlatitude total ozone QBO range from 5-20 DU. Although this is still a area of active research, it is clear that the QBO has an important influence on the extratropical circulation and various constituent fields.

    (c) Theoretical Explanation of the QBO -- Like the Brewer-Dobson circulation, the QBO depends on atmospheric waves. The three principal types of waves are gravity waves, mixed Rossby-gravity waves, and Kelvin waves.

    The theory of the QBO was developed Prof. Richard Lindzen of the Massachusetts Institute of Technology and Prof. James Holton of the University of Washington during the early 1970s. They proposed that dissipation of vertically propagating equatorial waves is the source of momentum responsible for causing the wind QBO. They used a simple model to show that the dissipation of vertically propagating Kelvin and Rossby-gravity waves can produce a QBO-like circulation.

    Although more recent two- and three-dimensional simulations of the QBO have supported their theory, the exact sources of the momentum remains unclear. For example, observations of Kelvin and Rossby-gravity waves suggest that these waves alone do not possess the momentum necessary to drive the observed circulation. Other explanations for alternate easterly momentum sources include equatorially propagating planetary waves, Rossby waves and westward propagating gravity waves.

    Gravity waves also have been suggested as a possible source of both easterly and westerly momentum, although this has not yet been verified. While it is clear that waves are responsible for the QBO, their ultimate source and characteristics remains elusive.
    3.8 Circulation Patterns Outside the Stratosphere

    We now turn to other meridional atmospheric circulation patterns that also play a role in distributing ozone. By meridional, of course, we mean that the circulations are between different latitudes (i.e. north-south). There are meridional circulations both below and above the stratosphere in the troposphere and mesosphere, respectively. We will look at these circulations briefly in this section.

    3.8.1 Tropospheric Meridional Circulation -- While the Brewer-Dobson circulation is the most important circulation for understanding stratospheric ozone, other circulations impact the stratosphere in minor ways.
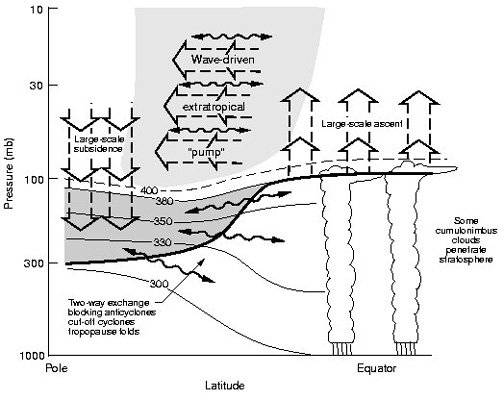
    The Hadley circulation is a tropospheric circulation consisting of rising motion in the tropical troposphere and subsidence over the extratropical regions. Warm, moist air rises in the tropical troposphere along the Inter-Tropical Convergence Zone (ITCZ), where convectively driven cumulonimbus (thunderstorm) clouds tower into the atmosphere.

    These convective towers pump material from the surface into the tropical upper troposphere, where they can slowly be carried into the stratosphere. Air sinks back down in the cooler subtropical regions, resulting in subsidence and belts of semipermanent high pressure (and hence arid and semiarid climates). This circulation pattern is known as a Hadley cell.

    The tropical branch of the Hadley circulation is not a continuous mechanism that occurs at all longitudes but rather a series of concentrated bands of "hot towers" of convection. The ITCZ seen on global visible cloud images on or around the equator as a thin line of thunderstorms within 10° of the equator. In addition, the Hadley circulation is responsible for the lower tropospheric easterlies and the upper tropospheric westerlies.

    While we understand the processes that cause material to slowly move into the stratosphere, many of the details of this slow transport are currently areas of active research.

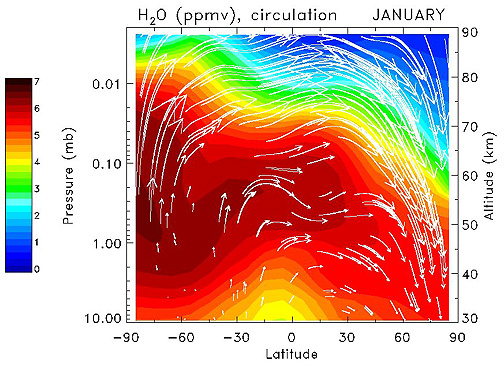
    3.8.2 Mesospheric Mean Meridional Circulation -- In the upper stratosphere and mesosphere (30-90 km) during the solstices, the circulation is dominated by a single circulation cell with rising motion in the summer hemisphere and sinking motion in the winter hemisphere with a corresponding summer-to-winter hemisphere meridional drift required by mass continuity (see Figure 6.04a near 50 km). As a result, the summer polar mesosphere is much colder than its radiative equilibrium, while the winter polar mesosphere is much warmer. This circulation pattern is generally driven by small scale gravity waves. These waves occur during all seasons and at all latitudes in the mesosphere. Figure 6.116-11.jpg shows this circulation in the stratosphere and mesosphere, superimposed on the water vapor distribution for January (northern winter/southern summer).

    Water vapor has a photochemical source in the upper stratosphere (approximately 50 km), and a sink in the upper mesosphere above about 80 km. Figure 6.11 shows the mean mesospheric circulation as it transports high water vapor values from the upper stratosphere to the upper mesosphere near 80 km in the middle to high latitudes of the summer (southern) hemisphere. Low water vapor values are subsequently transported from the lower thermosphere above 90 km down to the lower mesosphere/upper stratosphere at middle to high latitudes of the winter (northern) hemisphere.
    3.9 Age of Air in the Stratosphere

    Stratospheric ozone is destroyed by catalytic reactions with trace gases such as chlorine (see Chapter 5). The chlorine in the stratosphere is primarily released from human produced CFCs via UV photolysis (see Chapter 11). However, a CFC such as CFC-12 is photolyzed by wavelengths less than 240 nm. Since ozone and oxygen molecules absorb the overwhelming majority of this radiation, CFCs must reach very high altitudes before they can be UV photolyzed by radiation of this wavelength and release their chlorine into radical forms that are then free to attack ozone. The slow Brewer-Dobson circulation cell takes at least 1-2 years to move this air from the troposphere to the upper stratosphere, where this material remains for at least 1-2 years.

    The longer the residence time of CFCs in the stratosphere, the more chlorine can be liberated from the CFC into the radical species, and hence the more ozone that a radical chlorine atom can destroy.
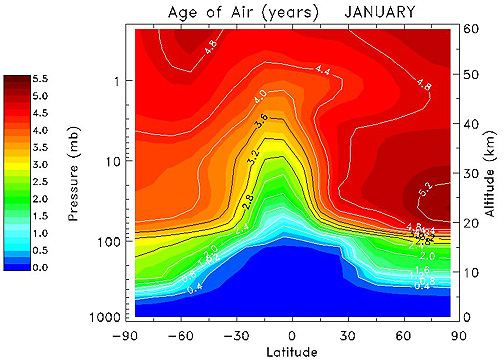
    Transport models can be used to estimate the average "age of air" for the stratosphere. This age is the average amount of time it takes for air parcels to be transported from the ground to a specific latitude and altitude region in the stratosphere. The modeled age is shown in Figure 6.12.6-12.jpg
    We note in Figure 6.12 that the air parcels in the troposphere are very quickly mixed due to convection and weather systems, so that the age of air distribution is relatively uniform in this region. This age diagram is based on an idealized tracer with a tropospheric mixing ratio that increases linearly in time. The age distribution reflects the influence of the Brewer-Dobson circulation.

    Air enters the stratosphere through the tropical tropopause, and ascends through the tropical stratosphere (see also Figures 6.04a-d). As noted in Section 3.2, nearly 90% of the air entering the stratosphere at 16 km never makes it to the top of the stratosphere around 32 km. Most of the air is from the tropics finds its way into the extratropical lower and middle stratosphere, where it enters the descending branch of the Brewer-Dobson circulation. Air that does make it to the top of the stratosphere, undergoes vigorous overturning in the mesosphere by the circulation that exists there (see section 3.8.2). This circulation is induced by gravity wave breaking

    It takes air parcels 4.5 to 5 years to be transported from the ground to the lower mesosphere. Air parcels return to the stratosphere via wintertime descent at middle and high latitudes (Figures 6.04a). The tropical lower stratospheric air is relatively "young", since it has been directly lifted out of the troposphere by the Brewer-Dobson circulation.

    This young tropical stratospheric air contrasts with lower stratospheric air at middle and high latitudes, where ages can exceed 5 years. Older air has a large abundance of chlorine radicals and small abundance of CFCs because it has had a longer period for the CFCs to be destroyed by UV photolysis. In comparison, tropical lower stratospheric air has low concentrations of chlorine radicals and higher CFC amounts. While it takes about 4-5 years for material to reach the upper stratosphere from the troposphere, only a small fraction of all tropospheric air ever makes it that high. The time needed to cycle most of the tropospheric air through the upper stratosphere is in fact many decades.


  • Closed Accounts Posts: 2,693 ✭✭✭Redsunset


    ATMOSPHERIC WAVES AND TRANSPORT OF TRACERS

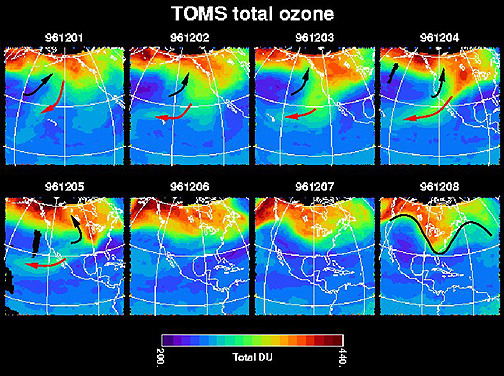
    The overall transport pattern outlined in Figure 6.03 omits an extremely important process for understanding the distribution of ozone in the stratosphere: mixing by large scale weather systems. In Figure 6.13,6-13.jpg

    we can watch the evolution of a large-scale weather system over an 8-day period by watching the effect it has on the total ozone field through mixing processes. The panels show the total ozone field for December 1-8, 1996, over the eastern Pacific and North America.

    A very large scale weather system in the upper troposphere pulled high ozone air south and westward from the high latitudes over the course of a week (see red arrows) and pushed that ozone into the tropics during the first week of December 1996.

    Likewise, low ozone was pulled east and northward by this system out of the lower latitudes and into the higher latitudes (see black arrows). The directions correspond to the air circulation pattern around the low pressure system. The last panel of the figure on December 8, 1996, showed the "wavy" structure in the total ozone field associated with these weather systems. These sorts of weather systems dramatically show how ozone is "mixed" between the high and low latitudes of the northern hemisphere.

    The Brewer-Dobson circulation discussed above is in fact induced by the growth and dissipation of these atmospheric waves. These waves can transmit heat and momentum across large distances, and thus their influence can be global. Much like ocean waves, these waves can either temporarily displace trace gas constituents (much like a small boat displaced by a passing ocean wave ), or they can permanently displace trace gas constituents (like a surfer using the wave to move on shore). Without these wave effects, the temperature field in the polar stratosphere would relax to extremely cold temperatures which would follow the seasonal cycle in solar heating. Therefore, understanding atmospheric waves, and the processes that enhance and dissipate them, is central to understanding ozone transport in the atmosphere.

    The waves in the stratosphere are largely composed of waves generated in the troposphere which propagate upward. Tropospheric waves are induced by a variety of processes (see also Chapter 2, section 5.3). We will now review the types of waves most important for stratospheric transport.
    4.1 Extratropical Rossby Waves and Gravity Waves

    There are two types of waves that are critical for the mixing processes and the Brewer-Dobson circulation: Rossby waves and gravity waves. the Rossby wave exists due to a combination of meridional temperature gradients and the Coriolis force, which arises from the rotation of the planet. The gravity wave, also known as a buoyancy wave, results from the stability or buoyancy of air in a stably stratified atmosphere.

    While gravity waves are important for understanding the entire circulation of the stratosphere and mesosphere, Rossby waves are principally responsible for the Brewer-Dobson circulation. This is because it is the very long wavelength Rossby waves induced by topography, known as the stationary planetary waves, that propagate vertically and break in the stratosphere, causing the wintertime stratospheric sudden warmings in the polar regions that lead to the Brewer-Dobson circulation.

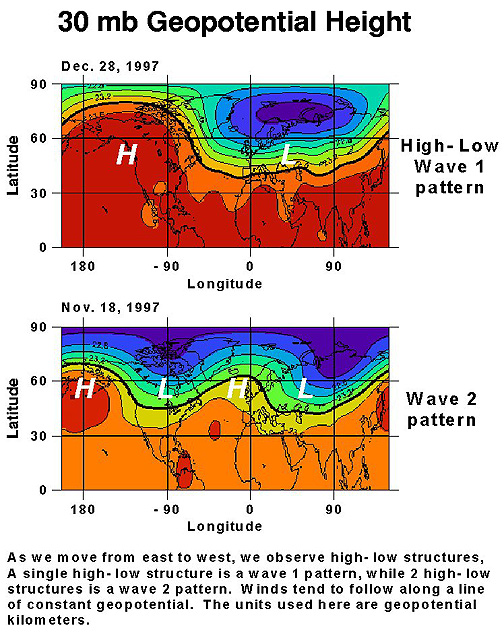
    4.1.1 Rossby Waves: An Illustration -- The very long horizontal scales of Rossby waves in the stratosphere is illustrated in Figure 6.14,6-14.jpg which shows a weather map for the stratosphere at the 30 mb geopotential height level (about 23 km altitude). The wind tends to blow along the lines of constant geopotential height. (Geopotential height is defined and discussed in Chapter 2.) The top image shows the height field on December 28, 1997. The bottom image of Figure 6.14 shows the same 30 mb geopotential height field on Nov. 18, 1997.

    In the top panel image of Figure 6.14, we see the single high-low structure that exists between the Gulf of Alaska and Northern Europe centered roughly along the 60°N latitude. The thick black line highlights the wave structure. Atmospheric scientists refer to this single high-low structure as a planetary wave-1 pattern, since a single wave (one ridge and one trough) straddles the entire planet at that latitude. At 60°N, the wavelength of this wave-1 is 20,000 kilometers. In the bottom panel image, we see two highs and two lows in a double high-low structure extending around the northern high latitudes. It is again centered roughly on 60°N. We refer to this as a planetary wave-2, with a wavelength of 10,000 kilometers at 60°N.

    If we look closely at these fields, we can see other bumps and wiggles on the contours (e.g., on the Dec. 28 image, there is a distinct variation of the black line near the Caspian Sea at about 60°E, 40°N). These smaller scale features are also waves, but their horizontal dimensions are only a couple of thousand kilometers. So while waves-1 and 2 dominate on these two days shown, we can see other, smaller scale waves that have horizontal dimensions of 1,000 to 4,000 kilometers. These waves are referred to as synoptic scales waves. The collection of all of these Rossby waves is known as the Rossby wave spectrum.

    4.1.2 Wave Theory -- Because these waves drive the Brewer-Dobson circulation, affect mixing processes, and control the wind and temperature distributions in the stratosphere, they are extremely important to understand and predict. The development and movement of these waves remains an area of research in the atmospheric sciences. In this section, we will briefly discuss where these Rossby waves originate, how they move into the stratosphere, and where they are dissipated.

    (a) Origin of planetary wave forcing -- As noted previously in this chapter, planetary scale Rossby waves are forced by topography, specifically, the large-scale features like the Rockies and the Himalaya-Tibet complex. They are also forced by land-ocean heating contrasts. These are fixed features, and the waves forced by them are thus stationary or standing ones. Rossby waves may also be induced by instabilities arising from horizontal and/or vertical gradients in the temperature and wind distributions.

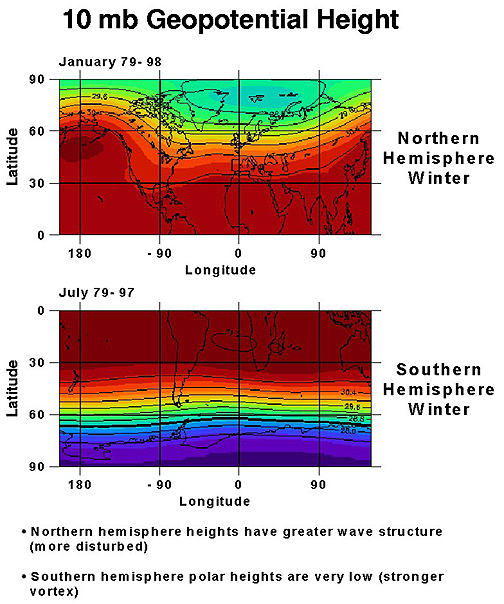
    Because of the hemispheric asymmetries of the wave forcing mechanisms (such as the much greater land area and the larger, more extensive mountain ranges in the northern hemisphere), this wave energy is significantly larger in the northern stratosphere than the southern stratosphere. This is seen in Figure 6.15,6-15.jpg which shows the climatological average winter geopotential height distribution for the northern hemisphere (January) and the southern hemisphere (July) at 10 mb or about 32 km altitude. The northern winter is based on 1979-1998 January data, and the southern winter is based on 1979-1997 July data.

    In the top panel image, we see that in the northern hemisphere, a localized maximum in the height field exists in the North Pacific ocean between 40°N-60°N around the International Dateline (180° longitude).

    This is referred to as the Aleutian anticyclone . Recall that there is a clockwise circulation around anticyclones (high pressure areas) in the northern hemisphere. As a result of this planetary wave feature, the polar vortex is displaced off of the North Pole and is centered just north of Scandinavia near Spitzbergen Island (shown by the deep green-blue colors).

    By contrast, in the bottom panel image, we see that in the southern hemisphere, there are only small planetary wave features. The polar vortex appears to be centered right on the South Pole. This interhemispheric asymmetry has a profound effect on the distribution of ozone and other trace gases in the two hemispheres. Note that in the summer hemisphere, there are virtually no stratospheric waves in the geopotential field.

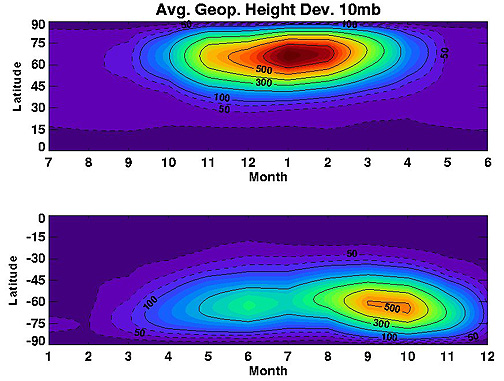
    These large scale waves have the largest influence in the winter hemisphere stratosphere outside of the equatorial region. Figure 6.16 6-16.jpg
    shows the average monthly amplitudes (in terms of geopotential height deviations) of these waves in the 10 mb geopotential height field over the course of the year for the northern hemisphere (top panel) and southern hemisphere (bottom panel). The time axis is labeled in months. The top panel begins with month 7 (July), the bottom with month 1 (January). This allows us to observe a complete winter cycle centered at the middle of the images. The northern hemisphere time axis has been shifted by six months for comparison to the southern hemisphere.

    In Figure 6.16, we see that the northern hemisphere wave amplitudes peak in the northern midwinter (January) and have considerably larger values than the corresponding peak period in the southern hemisphere. The southern hemisphere wave amplitude peaks in late winter/early southern spring (September-October). The early spring peak in southern hemisphere wave activity corresponds to the time when the more isolated southern polar vortex breaks down.

    These stronger northern hemisphere waves produce a stronger Brewer-Dobson circulation, a weaker polar vortex, warmer polar temperatures in response to the stronger Brewer-Dobson circulation, and an earlier breakup of the polar vortex. In addition, because of the stronger Brewer-Dobson circulation, more ozone is transported to the northern polar lower stratosphere, leading to higher ozone levels in the northern hemisphere. This hemispheric asymmetry in wave activity thus has a profound effect on the distribution and mixing processes of ozone and other trace gases between the two hemispheres.

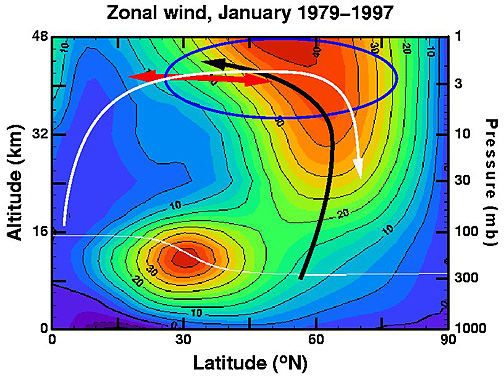
    (b) Movement -- After being generated in the troposphere, planetary waves propagate into the stratosphere, growing in size as they move upward (because of decreasing air density in the stratosphere). This process is illustrated in Figure 6.17, 6-17.jpg
    which shows the polar night jet averaged from 19 years of data (1979-1997).

    In Figure, 6.17, the tropopause is shown by the thin white line under 16 km altitude. The propagation of a planetary wave is schematically illustrated by the thick black arrow.

    The wave develops in the troposphere, propagates vertically into the stratosphere along the axis of the jet core, eventually bending towards the tropics. The wave decelerates the polar night jet (in the region encircled by the blue line) by depositing easterly momentum into the fast moving westerly jet.the Brewer-Dobson circulation (shown as the white arrow) is induced by this wave deceleration and the accompanying stratospheric sudden warming.
    (c) Wave growth and dissipation -- The growth and dissipation of atmospheric waves results in meridional exchange or transport of air in the stratosphere. Periods of rapid growth of extratropical planetary waves, referred to as wave transience, are most common in northern high latitudes during the northern winter. This rapid wave growth can lead to sudden and dramatic changes in the temperature and circulation structure (and hence the ozone distribution) in the stratosphere.
    This is the stratospheric sudden warming phenomenon

    Wave growth also occurs in the southern high latitudes during the southern late winter and spring, although it is less dramatic than its northern hemisphere counterpart. It is this wave transience in the southern hemisphere that is responsible for the breakup of the polar vortex and the Antarctic ozone hole during the early spring there.
    Wave dissipation has two main causes. These are thermal dissipation and wave breaking. Thermal dissipation occurs through radiative processes, while wave breaking refers to a rapid mixing of air parcels from different regions. Both processes are detailed below.

    (1) Thermal dissipation -- Thermal dissipation refers to the process of wave dissipation in which radiative heating and cooling lessen the temperature differences that are associated with Rossby wave formation. These Rossby waves have associated large scale areas of warm and cold temperature perturbations. The warm regions will radiatively cool to space at greater rates than the colder regions and restore the atmosphere to a more uniform temperature field. In general, this thermal damping process becomes more significant with increasing altitude in the stratosphere.

    (2) Wave breaking -- Wave dissipation or damping also occurs by a process referred to as wave breaking. Much like ocean waves breaking on the beach, atmospheric waves grow to large amplitudes and break, thereby causing rapid meridional mixing. This process is particularly evident in the winter middle latitudes. Waves propagate vertically from the troposphere into the stratosphere, and then equatorward into the subtropics.

    As the wave moves upward, the density of the atmosphere decreases, and the strength of the wave consequently grows. This eventually leads to wave "breaking," in which air parcels undergo large and rapid latitudinal excursions causing them to undergo strong, irreversible, meridional mixing. As a result, material (i.e., long-lived tracers) becomes thoroughly mixed throughout the subtropics and lower middle latitudes.

    The strength of the mixing is directly related to the strength of the waves (see Fig. 6.17). This means that greater mixing occurs during the northern midwinter than during the southern midwinter. The well-mixed region occurs on the equatorward side of the polar night jet. This is the "surf zone", where the name "surf zone" is used as an analogy to the surf breaking on a beach. Such ocean wave breaking is characterized by overturning and mixing of water. The wave dissipation occurs as energy is transferred from the larger wave scales to smaller wave scales (finer features), which are thermally dissipated. The planetary wave breaking generally occurs when a wave propagates into a region where the wave speed matches the mean flow.

    Wave breaking processes not only occur for stratospheric planetary waves, but also occur for very small scale gravity waves. Gravity waves result from the buoyancy of the atmosphere. Breaking gravity waves are important in the mesosphere where gravity wave amplitudes become large enough to generate convective instability, overturning, and rapid vertical mixing of air parcels. These gravity waves are also thought to decelerate the mean flow in the upper stratosphere and mesosphere, and hence, also affect the mean circulation.
    4.2 Wave Transport

    As discussed previously, wave growth and dissipation generates meridional mass transport by two processes. First, the Brewer-Dobson circulation results from these waves because of the transfer of easterly momentum and energy via waves from the troposphere to the stratosphere, which act as a break on the westerly polar night jet, creating first a radiative and then a mass imbalance. Secondly, meridional exchange of mass occurs as waves dissipate in the atmosphere, producing a meridional stirring of air. This stirring or mixing tends to occur approximately on isentropic surfaces. Returning to Figure 6.17, these two processes are schematically shown by the white arrow (the Brewer-Dobson circulation) and the double-arrowed red line (mixing).

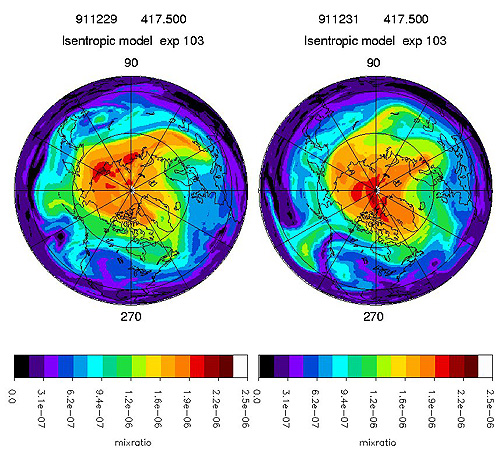
    4.2.1 Wave Mixing -- Planetary or synoptic scale waves can cause irreversible changes in ozone concentration. Figure 6.186-18.jpg shows northern hemisphere ozone mixing ratios from a 3-dimensional transport model on the 417 K (144°C or 291°F) isentropic surface for December 29, 1991 (left) and December 31, 1991 (right). The high ozone levels over the polar region are within the polar vortex which persists throughout the winter.

    These high concentrations are maintained by the combination of the downward component of the Brewer-Dobson circulation, which brings ozone-rich air downward and poleward, and wind patterns which isolate the vortex from middle latitude air. Between the tropics (black-purple colored values) and the polar vortex (red-orange colors), there is a tremendous amount of structure in the ozone field, similar to the stirring patterns in a paint bucket with two colors. It is here that wave mixing occurs, stirring up air parcels and redistributing trace gas constituents.

    A particular event is revealed in Figure 6.18 that occurs over this two day period. Large changes in ozone occur over eastern Scandinavia as a wave distorts the polar vortex and moves a tongue of high ozone air over the region. As the shape of the polar vortex continues to change (not shown), repeated penetrations of tongues of low ozone middle latitude air are seen entering into and out of the polar vortex. As low ozone air moves into the vortex, high ozone air moves south out of the vortex and into the middle latitudes. This exchange of air mixes up ozone amounts in the middle latitudes.

    Eventually, as the year progresses, a climax is reached when the vortex completely breaks apart in the spring period. Once the vortex breaks, it will not reform until the fall. As the vortex breaks up, low ozone air is mixed with high ozone air. The polar region considerably warms, which is why we refer to this breakup as the final warming.

    4.2.2 The Stratospheric Surf Zone -- As previously noted, the stratosphere is divided into three latitudinal regions between the equator and the pole. The tropics, the polar vortex, and the midlatitude "surf zone". Figure 6.18 shows these regions distinctly, with low ozone tropical air, high ozone polar air inside the polar vortex, and the complicated fine structure of high and low ozone air mixing inside the middle latitude surf zone region.

    4.2.3 Wave Influence On Mean Circulation -- These planetary wave induced ozone changes that are illustrated in Figure 6.18 create a high degree of ozone variability across the globe, but this variability does not contribute to the global average of ozone on time scales of months or longer. Rather, the global average of ozone is primarily driven by the Brewer-Dobson circulation.

    This circulation decreases ozone levels in the tropics by lifting low ozone from low altitudes (see Figure 6.03) and increases ozone in middle to high latitudes by pulling high ozone down from higher altitudes. This circulation produces the observed ozone gradient of elevated extratropical latitude stratospheric ozone and low tropical stratospheric ozone. Mixing by waves acts to flatten out this gradient. These wave events are continually pulling low ozone air from the tropics into the extratropical region and high ozone extratropical air into the tropical region.

    Figure 6.18 shows thin filaments of high ozone air from the polar vortex that are pulled into the middle latitudes over central Asia and the Eastern Pacific. These filaments get thinner and elongate with time. Eventually, they are irreversibly mixed into the middle latitude surf zone, never to retreat back into the polar vortex. The net effect of this irreversible process is to weaken the latitudinal (meridional) gradient of ozone between the polar vortex and the middle latitudes and the tropics that was created by the Brewer-Dobson circulation.

    STRATOSPHERE-TROPOSPHERE EXCHANGE

    We now turn to the way in which material actually crosses between the troposphere and stratosphere through the tropopause. The term is Stratospheric-Tropospheric Exchange (STE), and it refers to the transport of material across the tropopause. STE has direct implications on the distribution of atmospheric ozone, in particular, the decrease of lower stratospheric ozone and the increase of tropospheric ozone. STE also impacts the distribution of aircraft emissions and the vertical structure of aerosols and greenhouse gases. We divide the topic of STE into the movement of air into and exit of air from the stratosphere.

    The transport of anthropogenic gases, like chlorofluorocarbons, from the troposphere into the stratosphere effects the chemical balance in both regions and provides the catalysts necessary for stratospheric ozone destruction. Stratospheric-tropospheric exchange also controls the rate of transport between source and sink regions for both tropospheric and stratospheric source gases. A consequence of this is the long lag time between the release of tropospheric trace gases and stratospheric ozone reduction.
    5.1 Mean Meridional Circulation in the Overworld and the Lowermost Stratosphere

    For time scales greater than several months, the mass flux through the tropopause is ultimately driven by large-scale processes related to the Brewer-Dobson circulation. To show this, it is helpful to further divide the stratosphere into the overworld and the lowermost stratosphere. The overworld is the region above the 380K isentropic surface. The lowermost stratosphere is the dark shaded region between the 380K isentropic surface and the tropopause. Figure 6.196-19.jpg shows schematically these two layers of the stratosphere and the dynamical processes that occur in each.

    In Figure 6.19, the tropopause is shown by the thick line using pressure coordinates. The tropopause is near 300 mb at the pole and 100 mb in the tropics. Transport in the overworld is controlled by the Brewer-Dobson circulation. That is, the strength of the upward STE in the tropics and downward STE in the extratropics is controlled by the hemispheric Brewer-Dobson circulation rather than by smaller scale, local transport processes at the tropopause boundary.

    For material descending into the troposphere, once it crosses from the overworld into the lowermost stratosphere, the time scale for it to cross the tropopause is on the order of a season. The actual transport from lowermost stratosphere into the troposphere is governed by smaller scale extratropical processes such as blocking anticyclones, cut-off lows and tropopause folds, discussed below.

    5.1.1 Blocking Anticyclones (Highs) -- Large anticyclones or high pressure areas in the troposphere may persist for days or weeks. These are known as blocking anticyclones or blocking highs. The effect of such features is to lower column ozone in that region through two processes. First, the anticyclonic flow around the high brings lower latitude air poleward. This air will retain characteristics of its tropical or subtropical source region, including concentrations of trace gases, such as ozone.

    Tropical and subtropical air has a lower ozone mixing ratio, reflected in a lower total column ozone, than polar air. This lower ozone air is transported into a region where ozone amounts are usually higher. Secondly, the warmer temperatures associated with a blocking high cause isentropic surfaces to bend upwards, which has the effect of bending the tropopause upwards. Ozone density in the troposphere is lower than in the stratosphere, of course, so an increase in the vertical scale of the troposphere results in a lower column ozone density.

    By pushing transporting tropospheric air poleward and bending the tropopause upwards, blocking highs can increase the time it takes STE processes to occur.

    5.1.2 Cutoff Low Pressure Systems -- Cutoff lows are upper level cyclones which become cut off or separated from the main flow of the upper tropospheric jet stream. They are usually associated with blocking patterns. The majority of cutoff lows form during summer months and can last for several days. In general, they form as the jet stream becomes distorted as an upper tropospheric trough elongates meridionally. As the system becomes cut off, it isolates air with characteristics of its polar source region.

    That is, it will contain cold air, high in potential vorticity, and trace gases with concentrations characteristic of higher latitudes.
    Cutoff lows are obvious mechanisms for horizontal transport and are potentially important for STE. Cut-off lows are capable of large scale cumulus convection. Within convective updrafts, tropospheric air can be transported across the tropopause. This action can eventually erode the tropopause itself, creating a vertically mixed region of stratospheric and tropospheric air. The tropopause may then reestablish itself at a higher altitude above the mixed layer, thereby capturing the stratospheric ozone below.

    5.1.3 Tropopause Folds -- Another mechanism for STE is tropopause folding events. A stratospheric intrusion of air that sinks into the baroclinic zone beneath the upper tropospheric jet stream is known as a tropopause fold. They form by a steepening of the tropopause (and isentropes) at a jet core. Tropopause folds are the dominate and most efficient form of STE in the middle latitudes. Folds usually occur of the western flank of cutoff low systems. Clean, dry stratospheric air, rich in ozone and potential vorticity, is transported downward to tropospheric levels. Observations of the circulation near folding events reveal that tropospheric air is being advected upwards as well. This tropospheric air contains large amounts of water vapor, carbon monoxide, aerosols and low values of potential vorticity.


  • Closed Accounts Posts: 2,693 ✭✭✭Redsunset


    Right people i hope i don't put you asleep with the large posts but everything in them needs to be understood so we can all get a better understanding of how the stratosphere works.

    nobody said it would be easy.

    The thread is just in the explaining stage now cause i feel people won't comment on something they have no clue on.

    so i hope the info helps.

    waiting now on the warming to take off for the winter and it def seems to be making an attempt,perhaps a canadian warming is on the cards.


    30mb9065.gif


  • Closed Accounts Posts: 2,693 ✭✭✭Redsunset


    And we have lift off !!!


    now in a canadian warming,also known as a minor warming.


    here's a pdf of a previous exceptional one.


    http://mls.jpl.nasa.gov/joe/ManneyEtAl_warming_GRL_2001.pdf


  • Advertisement
  • Closed Accounts Posts: 2,693 ✭✭✭Redsunset


    Detailed account of the record strat warming that occured at beginning of year. click on recorded presentation for both

    http://ams.confex.com/ams/17Fluid15Middle/techprogram/paper_154033.htm

    http://ams.confex.com/ams/17Fluid15Middle/techprogram/paper_153709.htm


  • Closed Accounts Posts: 2,693 ✭✭✭Redsunset


    The Polar Vortex

    The polar vortex is a persistent large-scale cyclonic circulation pattern in the middle and upper troposphere and the stratosphere, centered generally in the polar regions of each hemisphere. In the Arctic, the vortex is asymmetric and typically features a trough (an elongated area of low pressure) over eastern North America. It is important to note that the polar vortex is not a surface pattern. It tends to be well expressed at upper levels of the atmosphere (that is, above about five kilometers).


    So just a quick explanation of the PV there to those not familiar with it.


    according to the ECM its due to split,

    ecmwf100f192.gif


    There seems to be height rises predicted too to our north,we'll see what happens.

    forecast_3_nh.gif


    [FONT=verdana,arial,serif]Characteristics of Atmospheric Blocking[/FONT]
    • [FONT=verdana,arial,serif]Splitting of westerly flow into two separate branches over a considerable longitudinal extent[/FONT]
    • [FONT=verdana,arial,serif]Easterly flow to the south of the blocking ridge[/FONT]
    • [FONT=verdana,arial,serif]Pronounced meridional flow both upstream and downstream of blocking ridge[/FONT]
    • [FONT=verdana,arial,serif]Presence of deep troughs both upstream and downstream of blocking ridge[/FONT]


    Not too sure what will happen as we are not expecting a sudden major warming event for a month or more and would like blocking in the correct place.

    The PV has been very weak for a while now and that spike in temperatures we seen recently has i think caused this. (as indicated on chart in a previous post).

    The PV will probably reform though but not guaranteed before we are likely to see a major warming.

    Now this is my view on this and if anyone wants to correct me or add to this ,please do.


  • Posts: 0 [Deleted User]


    Well we got snow after this thread on upper atmospheric warming
    http://www.boards.ie/vbulletin/showthread.php?t=2055469856

    Hows it looking this time ! :)


  • Closed Accounts Posts: 2,693 ✭✭✭Redsunset


    Well we got snow after this thread on upper atmospheric warming
    http://www.boards.ie/vbulletin/showthread.php?t=2055469856

    Hows it looking this time ! :)


    well the PV split last time happened after a record warming and that ment propagation to the surface of easterly winds were felt.can,t see a whole lot from this little one


  • Registered Users, Registered Users 2 Posts: 2,616 ✭✭✭200motels


    Great info, well done.


  • Advertisement
  • Closed Accounts Posts: 2,693 ✭✭✭Redsunset


    ecmwfzm_u_f216.gif


    There is a strong indication now of an easterly push occuring after next weekend.

    remember we live between 50N-60N and 1000 line is almost home.

    The mean zonal wind measured in (metres/second) shows a strong easterly centred off the pole extending through a good portion of the stratosphere(most certainly around siberia)trying to make its present felt to us.

    Im not saying great cold will reach us but the indications are to me of high pressure building and drawing this in closer.important too where it is to sit if it happens.

    You can see the jet stream on chart pushed south too.(Red westerlies centred around 30N higher up in the strat.


    In this chart temps show a marked drop too in the higher latitudes (65N to 85N) and slighter warmer at the pole due to the colder air now slightly shifted over siberia.

    All due i expect from the weakened PV as it gets displaced from the pole.


    ecmwfzm_t_f216.gif

    Remember this is just a forecast,so it can change.


  • Closed Accounts Posts: 2,693 ✭✭✭Redsunset


    STRATALERT TOKYO
    STRATALERT TOKYO 07 DEC2009 0200 UTC30-HPA ANALYSIS 1200UTC 4 DEC1. COLD MINUS 79 75N 30E, WARM MINUS 35 58N 170E, LOW 218 78N 95E, HIGH 400 55N 150W.

    2. CONDITIONS AT 30-HPA HEIGHT FEILD, POLAR VOLTEX IS LOCATED TO THE NORTH OF THE TAYMYR PENINSULA. COLD AIR LIES OVER THE BARENTS SEA. WARM AIR LIES OVER THE BERING SEA. REGARDING ZONAL MEAN FIELD, EASTERLY WIND IS NOT OBSERVED THROUGHOUT THE STRATOSPHERE OVER THE POLAR REGION.

    3. STRATALERT STARTS. MINOR WARMING HAS STARTED AT 30-HPA. TEMPERATURE OVER THE EASTERN SIBERIA HAS INCREASED WITH MAXIMUM 28 DEGREES FROM 27 NOV TO 4 DEC.REMARK: THE HEIGHT DATA SHOULD BE READ IN DECAMETERS ADDING 20 KILOMETERS.=


  • Closed Accounts Posts: 2,693 ✭✭✭Redsunset


    fluxes.gif


    I concentrate on 10hpa and 30hpa zonal wind in second chart at 60N because when there's a major warming the westerly winds slow down and become easterly(drop below 0 line) in the stratosphere and propagate down to the troposphere(if its strong enough like the last one)


    Here's a

    very difficult pdf. only for those really interested.

    http://www.atmos-chem-phys.org/9/3957/2009/acp-9-3957-2009.pdf


  • Closed Accounts Posts: 2,693 ✭✭✭Redsunset


    The split Polar Vortex seen clearly today using the view of 850mb temps.


    PV%20split%202009.JPG


    How dare i play down the importance of a split PV in a previous post.

    The minor warmings have most certainly caused this and now gives us a great chance of a cold spell once again.

    I down played it because it did not happen from a major warming where easterly winds get propagrated down from the strat through to the troposphere,however the last cold spell was not a result of blocking,the easterly energy was so great it took command over much of europe as it spun down.

    This new and potentially severe expected cold spell is due to blocking and then the surface easterlys naturally taking over to help transfer over the displaced PV cold toward us.

    I hope im making sense to you all here as it can be difficult for me too as to all that creates these different atmospheric conditions and as always am open to other corrective ideas.:)


  • Closed Accounts Posts: 2,693 ✭✭✭Redsunset


    Well after all the excitment over the past 4 weeks i've only been barely glancing at whats happening up in our strat over the north pole and for good reason.

    30mb9065.gif


    As you can see from graph,she has took a severe nosedive so has not been good for retaining a displaced polar vortex.no warming makes it stronger remember.

    Now we seem to have new life in the old doll,can she make a sustained climb and go into a proper midwinter warming?

    Hopefully,

    We have stong negative wind reversal high up it the strat forecast that will propagrate down if we get a strong warming.

    ecmwfzm_u_f216.gif


    I know im repeating these but watch for the dive in zonal winds more importantly at 10hpa and 30hpa in second part of chart.we need to see reversal here.
    It looks promising to say the least for a another blast of arctic air in feb sometime so fingers crossed.


    fluxes.gif


    Just to note that some of my explanations on previous charts have expired due to charts being live the ones in this post are good,good.


  • Closed Accounts Posts: 2,693 ✭✭✭Redsunset


    time_pres_TEMP_MEAN_ALL_NH_2010.gif


    Warming showing up on the chart.

    And a strat warming alert has been issued,

    STRATALERT TOKYO 25 JAN

    2010 0300 UTC
    30-HPA ANALYSIS 1200UTC 23 JAN
    1. COLD MINUS 90 70N 18E,
    WARM MINUS 34 73N 85W,
    LOW 179 68N 105E,
    HIGH 413 65N 132W.
    2. CONDITIONS
    AT 30-HPA HEIGHT FEILD,
    POLAR VORTEX IS LOCATED OVER CENTRAL SIBERIA.
    COLD AIR LIES OVER THE GREENLAND SEA.
    WARM AIR LIES OVER THE BAFFIN ISLAND.
    REGARDING ZONAL MEAN FIELD,
    EASTERLY WIND IS OBSERVED ABOVE 20-HPA
    OVER THE POLAR REGION.
    3. STRATALERT EXISTS.
    MINOR WARMING HAS CONTINUED AT 30-HPA.
    TEMPERATURE OVER THE BAFFIN BAY HAS INCREASED WITH
    MAXIMUM 42 DEGREES FROM 16 JAN TO 23 JAN.
    REMARK: THE HEIGHT DATA SHOULD BE READ IN DECAMETERS
    ADDING 20 KILOMETERS.=
    And for those who want to follow the strat alerts,here is the link,http://hirweb.nict.go.jp/cgi-bin/tserdin/AandF/do/


  • Closed Accounts Posts: 4,279 ✭✭✭Su Campu


    Here's today's 12Z 30hPa analysis

    2010012512.30a.np.gif


  • Closed Accounts Posts: 2,693 ✭✭✭Redsunset


    temp10anim.gif


    Animation originally posted by Forkassed showing strat warming at 10mb level.

    Snowaddict is well on top of this too and gives great analysis,so i hope he wont mind me using the zonal wind chart he's posted.

    time_pres_UGRD_ANOM_JFM_NH_2010.gif


    Here's the animation of strat warming at 30mb level,

    temp30anim.gif


  • Closed Accounts Posts: 2,693 ✭✭✭Redsunset


    STRATALERT TOKYO
    STRATALERT TOKYO 27 JAN2010 0200 UTC30-HPA ANALYSIS 1200UTC 25 JAN1. COLD MINUS 89 59N 0, WARM MINUS 38 65N 150E, LOW 181 68N 102E, HIGH 416 63N 118W.

    2. CONDITIONS AT 30-HPA HEIGHT FEILD, POLAR VORTEX IS LOCATED OVER CENTRAL SIBERIA. COLD AIR LIES OVER THE NORWEGIAN SEA. WARM AIR LIES OVER EASTERN SIBERIA. REGARDING ZONAL MEAN FIELD, EASTERLY WIND IS OBSERVED ABOVE 100-HPA TO THE NORTH OF 65N.

    3. STRATALERT EXISTS. MINOR WARMING HAS CONTINUED AT 30-HPA. TEMPERATURE OVER GREENLAND HAS INCREASED WITH MAXIMUM 32 DEGREES FROM 18 JAN TO 25 JAN.REMARK: THE HEIGHT DATA SHOULD BE READ IN DECAMETERS ADDING 20 KILOMETERS.=


  • Closed Accounts Posts: 2,693 ✭✭✭Redsunset


    STRATALERT

    STRATALERT TOKYO 01 FEB2010

    0220 UTC30-HPA ANALYSIS 1200UTC 30 JAN1. COLD MINUS 80 53N 5W, WARM MINUS 38 45N 75E, WARM MINUS 40 77N 153W, LOW 204 63N 13E, HIGH 425 75N 140W.

    2. CONDITIONS AT 30-HPA HEIGHT FIELD, POLAR VORTEX IS LOCATED OVER THE SCANDINAVIAN PENINSULA. COLD AIR LIES OVER THE UNITED KINGDOM. WARM AIR LIES OVER THE LAKE BALKHASH AND THE BEAUFORT SEA. REGARDING ZONAL MEAN FIELD, EASTERLY WIND IS OBSERVED AT 30-HPA TO THE NORTH OF 62N.

    3. STRATALERT EXISTS. MINOR WARMING HAS CONTINUED AT 30-HPA. TEMPERATURE OVER THE LAKE BALKHASH HAS INCREASED WITH MAXIMUM 30 DEGREES FROM 23 JAN TO 30 JAN.REMARK: THE HEIGHT DATA SHOULD BE READ IN DECAMETERS ADDING 20 KILOMETERS.=


    A slight cooling i see today.hope she doesn't dive.

    pole30_nh.gif


  • Advertisement
  • Closed Accounts Posts: 2,693 ✭✭✭Redsunset


    Table shows Monthly Mean 30 hPa North Pole Temperatures in °C.

    RJ: monthly mean of the sunspot number in January;

    QBO: the phase of the Quasi-Biennial Oscillation (determined using the wind between 50 and 40 hPa (45 hPa) in January and February)

    TRT: (Transition Time) indicates the timing of the transition to summer conditions (early: TMar >= -51°C and/or TApr >= -44°C; the mean zonal wind in 60°N has to be easterly by April 9th.);

    *FW indicates the occurrence of a Major Final-Warming;

    CW stands for Canadian Warmings; * indicates the occurrence of a Major Mid-Winter Warming; C stands for a cold monthly mean (about half a standard deviation below the average).

    After the winter 1984/85 the 30-year mean is given with the standard deviation. Data source: 1955/56 - 1956/57 Muench and Borden (1962), 1957/58 - 2000/01 FUB-analyses, 2001/02 - 2006/07 ECMWF operational analyses.


    104026.JPG
    104028.JPG
    MONTHLY MEAN 30 hPa NORTH POLE TEMPERATURES (°C)


  • Closed Accounts Posts: 2,693 ✭✭✭Redsunset


    30mb year by year comparison,

    30 hPa
      [FONT=verdana,arial,serif]90N - 65N
      2009, 2008, 2007, 2006, 2005, 2004, 2003, 2002, 2001, 2000, 1999, 1998, 1997, 1996, 1995, 1994, 1993, 1992, 1991, 1990, 1989, 1988, 1987, 1986, 1985, 1984, 1983, 1982, 1981, 1980-79
      [/FONT]


    • Closed Accounts Posts: 4,279 ✭✭✭Su Campu


      I made a graph of those 30hPa data, showing the January temperature vs Sunspot Number RJ.

      The trendlines show a decrease in RJ but no change in temperature over the last 50 years.

      104033.JPG


    • Posts: 31,118 ✭✭✭✭ [Deleted User]


      Interesting to note that the minimum temperatures show a falling line that almost matches the slope of the RJ line.


    • Closed Accounts Posts: 2,693 ✭✭✭Redsunset


      STRATALERT
      STRATALERT TOKYO 03 FEB2010

      0200 UTC30-HPA ANALYSIS 1200UTC 1 FEB1.

      COLD MINUS 80 53N 10W, WARM MINUS 36 45N 63E, WARM MINUS 42 67N 97W, LOW 209 63N 8E, HIGH 414 70N 120W.

      2. CONDITIONS AT 30-HPA HEIGHT FEILD, POLAR VORTEX IS LOCATED OVER THE SCANDINAVIAN PENINSULA.
      COLD AIR LIES NEAR IRELAND. WARM AIR LIES OVER CENTRAL ASIA AND THE BOOTHIA PENINSULA. REGARDING ZONAL MEAN FIELD, EASTERLY WIND IS OBSERVED AT 30-HPA TO THE NORTH OF 65N.

      3. STRATALERT EXISTS. MINOR WARMING HAS CONTINUED AT 30-HPA. TEMPERATURE NEAR THE CASPIAN SEA HAS INCREASED WITH MAXIMUM 28 DEGREES FROM 25 JAN TO 1 FEB.REMARK: THE HEIGHT DATA SHOULD BE READ IN DECAMETERS ADDING 20 KILOMETERS.=


    • Closed Accounts Posts: 2,693 ✭✭✭Redsunset


      Just looking here and i could be wrong but i might be on to something.

      6034073


      Each downward push of decreasing negative zonal wind shoves the dashed line ahead to correspond with it.

      The dashed line is almost at ground level now.


      So what am i trying to say,

      Well the cold weather we experienced earlier this year caused by november warming is shown by negative winds on chart.
      Notice dashed lines here too reaching 1000.And looking back to feb last year,they never got down as far.
      Interesting i think.

      6034073


      PS it was the Polar Vortex split that caused the feb snow in east last year,negative winds remained that bit higher up,but to due the extensive warming it tore the PV to bits.

      PPS The little daisy is back warming again at 30mb


      Let me know if the charts are not visable,because sometimes i see an x where they should be.


    • Closed Accounts Posts: 2,693 ✭✭✭Redsunset


      Just looking here and i could be wrong but i might be on to something.


      https://us.v-cdn.net/6034073/uploads/attachments/195037/104467.JPG


      Each downward push of decreasing negative zonal wind shoves the dashed line ahead to correspond with it.

      The dashed line is almost at ground level now.


      So what am i trying to say,

      Well the cold weather we experienced earlier this year caused by november warming is shown by negative winds on chart.
      Notice dashed lines here too reaching 1000.And looking back to feb last year,they never got down as far.
      Interesting i think.


      https://us.v-cdn.net/6034073/uploads/attachments/195037/104468.JPG


      PS it was the Polar Vortex split that caused the feb snow in east last year,negative winds remained that bit higher up,but to due the extensive warming it tore the PV to bits.

      PPS The little daisy is back warming again at 30mb


      Let me know if the charts are not visable,because sometimes i see an x where they should be.


    • Closed Accounts Posts: 2,693 ✭✭✭Redsunset


      t60_90n_30_current.gif

      As you can clearly see mid november was a new warming record,whereas our latest does not touch last years record.

      Mountain of data (If interested)

      http://acdb-ext.gsfc.nasa.gov/Data_services/met/metdata/annual/


    • Closed Accounts Posts: 2,693 ✭✭✭Redsunset


      Almost missed it but we are now in a MAJOR MIDWINTER WARMING.

      Winds have reversed at 10hpa 60N.


      u60n_10_2009.gif


      Polar votex should split soon.

      The models might have a serious headache now getting a hold on this in a few days time.


    • Advertisement
    • Closed Accounts Posts: 2 duyueyu


      redsunset wrote: »
      OVERVIEW OF THE STRATOSPHERE'S COMPOSITION, STRUCTURE, AND DYNAMICS

      In order to understand transport of ozone in the stratosphere, we need to understand some key concepts. First, stratospheric air is very thin and becomes even thinner with increasing altitude. Second, stratospheric air is very stable, and vertical motion in the stratosphere is quite slow. This is because of the temperature structure there: temperatures rise with altitude. Third, the very long lived gases in our atmosphere become uniformly mixed by transport processes.

      Finally, the stratosphere can be divided into four distinct regions: (1) the tropics, which stretch from about 20°N to 20°S; (2) the middle latitudes or "surf zone"; (3) the polar vortex; and (4) the lowermost stratosphere. The structure of the stratosphere is primarily discussed in Chapter 2 as part of a discussion on the structure of the entire atmosphere. Here in this section, we will re-emphasize some of the key points of Chapter 2 with respect to mixing and transport processes in the stratosphere. We will discuss the density of air in the stratosphere, and how the temperature structure affects the stability (or buoyancy) of air. We will then discuss the well-mixed nature of our atmosphere. Finally, we will describe the basic regions of the stratosphere (a key background description for all of the subsequent sections of this Chapter).
      2.1 The Density and Temperature of Air

      The stratosphere is not a good place to be. First, the ozone in the stratosphere, which protects us from biologically destructive solar ultraviolet light, exists at such high levels that the air itself is toxic. Second, even this toxic air is much too thin for normal breathing. Finally, temperatures in the stratosphere are lethally frigid.

      2.1.1 Air Density Change With Altitude -- The density of the atmosphere decreases with altitude. This density decrease is notable on high mountain tops (such as Mt. Everest) where the lower air density makes breathing more difficult. In fact, commercial airliners must be pressurized to provide enough air for normal breathing by passengers. The density of air at an altitude of 16 km (50,000 feet) is only about 13% of the density of air at the surface. The red curve in the top panel of Figure 6.016-01.jpg shows a typical vertical profile of density from the ground to 60 km. The density of air near the top of the stratosphere is nearly zero.

      2.1.2 Air Temperature Change With Altitude -- The temperature of the atmosphere at first decreases with altitude and then increases. Temperatures decrease with altitude in the troposphere, the region between the surface and about 11 km. This is the region where we live and where weather occurs. Temperatures are first steady and then increase in the stratosphere, the region of the atmosphere from 11 km to about 47 km. The black curve in the top panel of Figure 6.01 shows a typical vertical profile of temperature from the ground to 60 km. The temperature is given in degrees Kelvin, abbreviated K, where Kelvin temperature = Celsius temperature (°C) + 273. Thus, 273 K corresponds to 0°C (or 32°F).

      Temperatures drop to just under 220 degrees Kelvin (-53°C or -63°F) at the top of the troposphere. Temperatures begin to rise in the stratosphere, though temperatures remain bitterly cold by most surface standards.

      2.1.3 The Tropopause -- The troposphere is separated from the stratosphere by the tropopause. Shown in Figure 6.01 as the horizontal black line at 11 km, the tropopause is an important feature of the atmosphere, as it marks the region where the temperature structure changes. Below the tropopause, temperatures decrease with altitude, while above the tropopause, temperatures increase up to about 47 km, which marks the top of the stratosphere. The troposphere and stratosphere are thus defined by their vertical temperature structures.
      2.2 Potential Temperature and the Stability of Stratospheric Air

      It is commonly recognized that warm air rises, and cold air sinks. This is because warm air is less dense than cold air. A simple test of this is to put a layer of cold water (perhaps with a dye) on top of a layer of warm water. The layers will overturn and mix. In the troposphere (where we live and see our weather), it is almost always the case that colder air overlays warmer air. The warm air is heated at the surface and it rises up. Under the right conditions, water vapor condenses out of the air and we see large clouds that appear to boil upwards. This is a process known as convection. Thunderstorms form by such convection.

      2.2.1 Static Stability -- Because temperature increases with altitude in the stratosphere, warmer air overlays colder air. As a result of this temperature structure, convection never happens in the stratosphere. If we could displace an air parcel to a higher altitude in the stratosphere, it would be colder than its surroundings. Cold air is more dense than warm air, and the parcel would sink back to its original location, though it would overshoot slightly because of its momentum. After overshooting, it would drop to a location where it would be warmer than its surroundings. Warm air is less dense than cold air, and the parcel would rise back to its original location, though it would once again overshoot slightly. This process would continue in a series of vertical oscillations about some equilibrium altitude where the parcel density and the surrounding air (ambient) density were the same.

      Such up and down oscillations of air (like a bob on the end of a rubber band) are indeed observed in the atmosphere. In the stratosphere, this oscillation has a period of about 40 seconds. In the troposphere, the same sort of displacement has a period of about 70 seconds. The faster oscillation in the stratosphere occurs because of the fact that air in the stratosphere gets warmer with altitude. This means that the air has greater static stability or greater buoyancy in the stratosphere. The greater stability in the stratosphere is the reason why vertical motions of air are not easily accomplished there. We speak of the stratosphere as being "stably stratified".

      2.2.2 Potential Temperature and Static Stability -- The stability is calculated from the vertical change of a quantity known as potential temperature. We discussed potential temperature in Chapter 2, Sections 3.3.2 and 5.2.1. Recall that potential temperature is defined as the temperature an air parcel would have if compressed adiabatically (i.e., without any heat being added or taken away, such as would happen if water vapor condensed out of the parcel) from its existing pressure to a reference pressure of 1000 millibars. The way potential temperature changes with height determines the static stability of the air. If potential temperature rises with height, the air is said to be stably stratified. If it falls with height, air is said to be unstably stratified. If it does not change with height, the air is said to be neutrally stratified.

      2.2.3 Potential Temperature Profile in the Stratosphere -- In the stratosphere, potential temperature always rises with height. That is, the stratosphere is always stably stratified. Figure 6.01 Bottom Panel shows a typical potential temperature vertical profile.
      In Figure 6.01, potential temperature is given in degrees Kelvin (K). We can see in the figure how potential temperature becomes quite large at higher altitudes in the stratosphere, reaching almost 400 K (127°C or 261°F) at 16 km altitude and 500 K (227°C or 441°F) at 20 km altitude. (Recall that this is the temperature the air at that level would have if compressed adiabatically to the 1000 mb).

      2.2.4 Isentropic Surfaces and the Motion of Stratospheric Air -- If we choose a particular potential temperature, all of the air with this particular potential temperature will form a surface called an isentropic surface. In fact, potential temperature divided by 25 is about equal to the altitude in kilometers (i.e., 400 K = 400/25 = ~16 km and 500 K =500/25= 20 km). Because potential temperature becomes so large at higher altitudes in the stratosphere, it is difficult to move air upward or downward. Stratospheric air tends to remain on an isentropic surface for many days. Vertical motions are consequently very small.

      2.2.5 Potential Temperature as a Vertical Coordinate -- Potential temperature is widely used as a vertical coordinate because air in the stratosphere tends to move along surfaces of constant potential temperature. The potential temperature of an air parcel is only changed by addition or removal of heat. This is known as a diabatic process, the opposite of an adiabatic process. Thus, the potential temperature of an air parcel remains about constant even if its temperature and pressure are changing.
      2.3 Air Composition and Its Well-Mixed Nature

      Air is primarily composed molecular nitrogen and molecular oxygen, with an assortment of minor or trace gases, such as argon, carbon dioxide, water vapor, and ozone, as well as many others, making up the rest. A parcel of air contains about 78% nitrogen molecules (N[SIZE=-2]2[/SIZE], molecular weight of 28), 21% oxygen molecules (O[SIZE=-2]2[/SIZE], molecular weight of 32 kg/kmol), and the remaining 1% are the trace gases. From this basic composition, the apparent molecular weight of air is about 28.964 kg/kmol. Both molecular nitrogen and oxygen decrease with altitude at exactly the same rate as overall air density. This means that the composition of air is approximately the same in both the troposphere and the stratosphere. The relative amounts of nitrogen and oxygen (78% and 21%) persist up to about 120 km, where atmospheric pressure is a tiny fraction of that of surface pressure.

      2.3.1 Turbulent Diffusion and the Homosphere -- While the molecular oxygen is heavier than molecular nitrogen, the two gases do not stratify in our atmosphere according to their weights. The gases don't stratify because parcels of air are thoroughly mixed into a uniform soup by wind currents, convection, and large-scale circulation patterns. These stirring processes are such that there is very little variation in the atmosphere for gases like nitrogen and oxygen. Such mixing is known as turbulent diffusion and it is very important from the surface up to about 120 km. This region is known as the homosphere, the region of the atmosphere where gases are uniformly mixed.

      2.3.2 The Heterosphere -- Above 120 km, gases begin to stratify according to molecular weight. Air is so thin at this altitude that individual molecules are able to accelerate to high speeds before bumping into another molecule. The lighter gases accelerate more than the heavier gases, and as a result, the atmosphere begins to stratify according to their molecular weight. This region above 120 km is called the heterosphere, the region of the atmosphere where gases stratify according to their molecular weight.

      2.3.3 Trace Gas Variability -- Many of the trace gases have variable concentrations. These include variations in both place and time. Trace gases variability can be due to a number of different reasons. Among the reasons for trace gas variability are phase change (e.g., water vapor changes to liquid water), chemical reaction (e.g., nitric acid is formed in the polar stratosphere when certain reactions occur, as shown in Chapter 11), creation by human activity (e.g., chlorofluorocarbons are developed), or photochemistry (e.g. ozone is created and destroyed by ultraviolet light from the sun). Each of these can cause trace gases to display large variations in their atmospheric concentrations.
      2.4 The Stratosphere

      We already know that the atmosphere is partitioned into distinct regions based on the temperature structure in the region. Temperatures fall with altitude in the troposphere. Temperatures rise with altitude in the stratosphere (see Figure 6.01). It is at the tropopause where the transition from decreasing temperature with altitude to increasing temperature with altitude occurs. The tropopause separates the troposphere from the stratosphere (see Chapter 2).

      2.4.1 Position of the Tropopause -- The position of the tropopause varies with latitude. In the tropics, the tropopause is located at an altitude of about 16 km or 50,000 feet. This corresponds to the 380 K isentropic surface. In the polar regions, the tropopause is as low as 8 km or 30,000 feet. Figure 6.026-02.jpg shows a color image of zonally-averaged January temperatures from the South Pole to the North Pole and between the surface and 48 km (158,000 feet), averaged from 1979-1998. The tropopause is superimposed on Figure 6.02 as the thick black line. The tropopause is highest in the tropics, and lowest at polar latitudes.
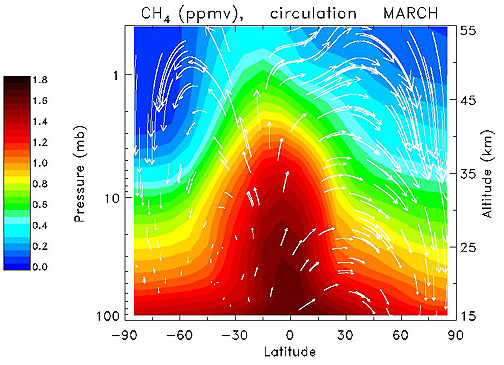
      2.4.2 Regions of the Stratosphere -- The stratosphere itself can be divided into four distinct regions: (a) the tropics, which stretch from about 20°N to 20°S; (b) the middle latitudes or "surf zone," (c) the polar vortex; and (d) the lowermost stratosphere.

      (a) The tropics -- The tropics is a region of the stratosphere that stretches from about 20°N to 20°S. It is here that ozone has its photochemical source region, since it is here that there is enough of the necessary highly energetic ultraviolet radiation from the Sun to create ozone. As we shall see in section 3, ozone is transported out of this region and poleward by a broad circulation pattern.

      (b) The surf zone -- The middle latitudes of the stratosphere is known as the "surf zone." Much like surf on a beach is characterized by turbulent overturning and mixing of water, the stratospheric surf zone is analogously characterized by a turbulent looking mixture of air masses, each of which contain differing amounts of ozone. Because of the equator-to-pole circulation pattern, tropical air contains less ozone than polar air. As a result of weather systems in the middle latitudes, tropical (low ozone) and polar (high ozone) air are mixed together. This gives the surf zone its turbulently mixed appearance. (For a preview, look ahead at Figure 6.18, which shows the complicated structure of the surf zone.)

      (c) The polar vortex -- In winter, stratospheric winds typically blow from west to east (referred to as the westerlies by meteorologists). As discussed in Chapter 2, a band of strong winds referred to as a jet stream sets up along the zone of greatest temperature change. In the stratosphere, this occurs in winter along the polar night terminator, the line that divides sunlight from the long polar night. (This occurs north of the Arctic Circle and south of the Antarctic Circle.) The jet stream that sets up here is called the polar night jet. It should not be confused with the polar jet stream, which together with the subtropical jet stream are features of the upper troposphere. The region poleward of the northern polar night jet is known as the Arctic polar vortex, while the region poleward of the southern polar night jet is known as the Antarctic polar vortex, which is a region of air isolated from the rest of the stratosphere where the long polar night allows extremely cold temperatures to develop. The degree of isolation, however, is quite different between the Arctic and Antarctic (see Chapter 11). Special conditions inside the more isolated Antarctic polar vortex allow human-produced chlorofluorocarbon (CFC) compounds to destroy ozone each spring, creating the "ozone hole" phenomenon (see Chapters 1, 5, 11).

      Figure 6.02 shows the situation for January, the northern hemisphere winter and southern hemisphere summer. It reverses itself six months later. The wind patterns are indicated by the white lines on Figure 6.02, with jet streams indicated by the bold J's on the figure. Solid white lines indicate westerly winds, while dashed white lines indicate easterly winds.

      The (northern) polar night jet is located in the middle to upper stratosphere, with its core of fastest wind speeds around 32 kilometers.
      We see in Figure 6.02 that in the summer hemisphere, the polar vortex has vanished. Stratospheric winds weaken and actually reverse direction, becoming easterly. This seasonal dynamical variability is discussed in Chapter 2, but it is related to the long period of sunlight over the summer pole (during the polar day) and the presence of ozone, which absorbs some of the solar energy and warms the region. This results in a reverse temperature gradient, and hence the winds reverse direction and become easterly.

      (d) The lowermost stratosphere -- A special region of the stratosphere is known as the lowermost stratosphere. This part of the stratosphere contains a mixture of both tropospheric and stratospheric air. Air in the troposphere has a different chemical composition (or fingerprint) than air in the stratosphere. In the lowermost stratosphere region, we find a mixture of the two. The lowermost stratosphere is delineated on the bottom by the tropopause and at the top by the 380 K potential temperature surface (shown in Figure 6.02 as the dashed line). In the tropics, the lowermost stratosphere is separated on the bottom at the core of the subtropical jet stream.
      hi,i want to know more about the stratosphere,but i can not see the figures in it.maybe the link is unvalid. could you please post them again? thank you.


    Advertisement