Advertisement
If you have a new account but are having problems posting or verifying your account, please email us on hello@boards.ie for help. Thanks :)
Hello all! Please ensure that you are posting a new thread or question in the appropriate forum. The Feedback forum is overwhelmed with questions that are having to be moved elsewhere. If you need help to verify your account contact hello@boards.ie
Hi all! We have been experiencing an issue on site where threads have been missing the latest postings. The platform host Vanilla are working on this issue. A workaround that has been used by some is to navigate back from 1 to 10+ pages to re-sync the thread and this will then show the latest posts. Thanks, Mike.
Hi there,
There is an issue with role permissions that is being worked on at the moment.
If you are having trouble with access or permissions on regional forums please post here to get access: https://www.boards.ie/discussion/2058365403/you-do-not-have-permission-for-that#latest

Irish Weather Statistics

1111214161723

Comments

  • Registered Users, Registered Users 2 Posts: 13,666 ✭✭✭✭sryanbruen


    Here's August's CET graph. The last 18.0c CET August was 2003 and the only 19.0c CET August was 1995 with 19.2c though 1997 was close with 18.9c.

    Despite all the poor Augusts in modern times, the last August with a CET under 14.0c was way back in 1986.

    DWTKe5w.png

    Data comes from the UK Met Office.


  • Registered Users, Registered Users 2 Posts: 13,666 ✭✭✭✭sryanbruen


    Multiple factors will play a lot in how the temperatures will be like, record breaking or not. One such factor is thickness. It was the thickness that gave the one day wonder of 1 July 2015 with a maxima of 36.7c. This was hotter than ANY day of Summer 1976 as a reminder. This one day wonder or mini heatwave in late June/early July 2015 is what I'm going to discuss here in this post.

    This mini heatwave was very impressive for the UK - not much so for Ireland.

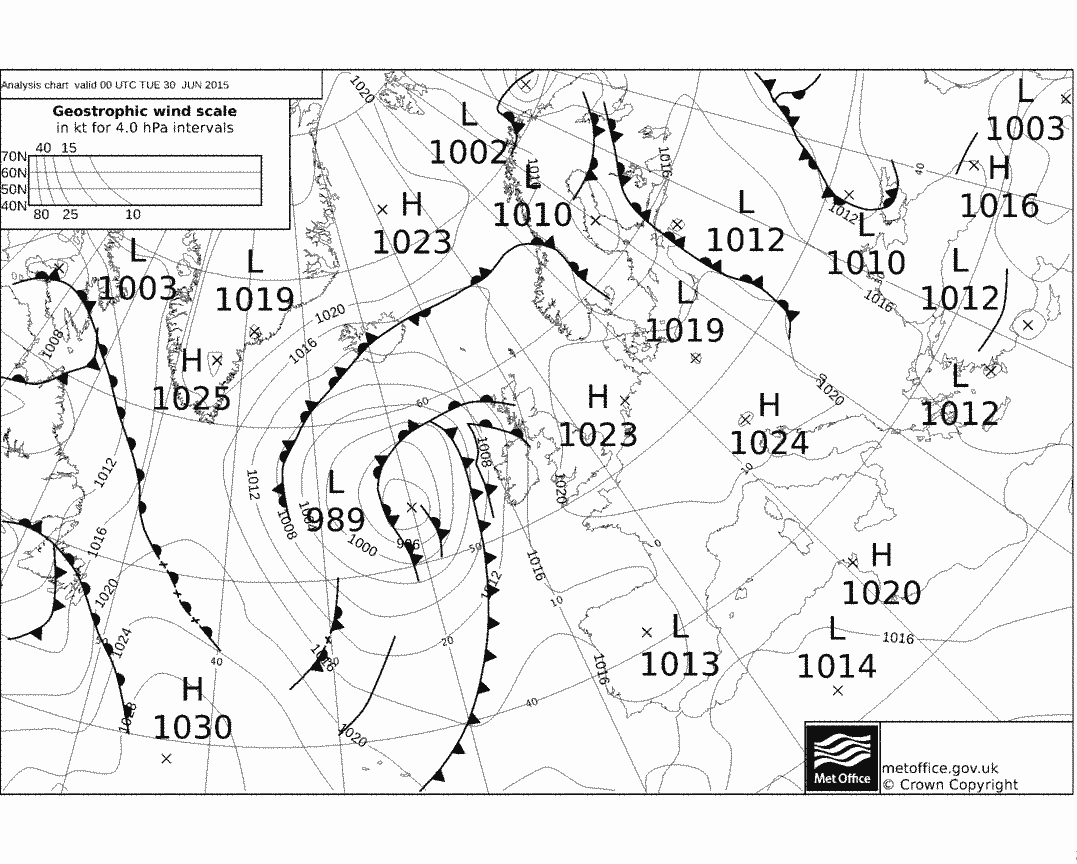
    The UKMO fax chart below from 30 June 2015 shows a 1023mb area of high pressure building to the east of the UK into central Europe and up to Scandinavia with a cold front just out to the west of Ireland. The winds are going anticlockwise around this front from a southerly with air being pumped up from Iberia.

    If you notice to the north of Europe, there is northern blocking which would indicate how Summer 2015 was going to go down after this Spanish plume/mini heatwave.
    BRA_1_2015063000_45.png

    850hPa temperatures were already surpassing 15c to the south of England on 30 June. Heathrow reached a maximum temperature of 32.5c which made it the warmest June day in the UK since 2011. Glasnevin, Co. Dublin got up to 26.1c in abundant sunshine (the highest June temperature in Ireland at this time since 2010) but this was to become the highest temperature of the entire year in Ireland making it the lowest annual maximum temperature since 2011. Phoenix Park reached a maximum of 25.6c on the same day. Many western regions barely even reached 20c though close to the front. Belmullet's maximum of June 2015 for instance was only 18.3c on the 29th.

    archives-2015-6-30-12-1.png

    The pattern continued into the 1st July 2015 but the front was further in over Ireland and it was even hotter in the UK than the previous day. The temperature at Heathrow was 32.5c at 09:00 GMT and 34.1c at 1000 GMT, before falling back to 31.5c by 11:00 GMT. The maximum of 36.7c was recorded at 14:13 GMT. The Heathrow figure for 09:00 GMT made it the highest night-time temperature on record in the UK (2100 to 0900 GMT). The 36.7c figure made it the highest July temperature on record for the UK beating the previous record of 36.5c on 19th July 2006. It was also the highest temperature overall in the UK since August 2003. It was reported that 40c was recorded in Lincolnshire in July 1808 but due to how far back this was, this is disregarded as an official temperature. Castleconnell, Co. Limerick recorded 25.6c on July 1st for Ireland.

    archives-2015-7-1-12-0.png

    archives-2015-7-1-12-1.png

    Satellite for 10:53 GMT on 1st July 2015.

    eJrwv6z.jpg

    UK Met Office's article on the event: https://www.metoffice.gov.uk/climate/uk/interesting/july2015

    Data comes from Met Éireann and the UK Met Office.


  • Registered Users, Registered Users 2 Posts: 13,666 ✭✭✭✭sryanbruen


    Here's September's CET graph.

    I find it quirky how after the first decade or so of the twentieth century, September absolute maxima tended to be lower though there have been notable exceptions such as 2016, yet Septembers have overall gotten warmer and warm Septembers aren't a rare occasion nowadays.

    yKBE3NO.png

    Data comes from the UK Met Office.


  • Registered Users Posts: 2,023 ✭✭✭Donegal Storm


    sryanbruen wrote: »

    The pattern continued into the 1st July 2015 but the front was further in over Ireland and it was even hotter in the UK than the previous day. The temperature at Heathrow was 32.5c at 09:00 GMT and 34.1c at 1000 GMT, before falling back to 31.5c by 11:00 GMT. The maximum of 36.7c was recorded at 14:13 GMT. The Heathrow figure for 09:00 GMT made it the highest night-time temperature on record in the UK (2100 to 0900 GMT). The 36.7c figure made it the highest July temperature on record for the UK beating the previous record of 36.5c on 19th July 2006. It was also the highest temperature overall in the UK since August 2003. It was reported that 40c was recorded in Lincolnshire in July 1808 but due to how far back this was, this is disregarded as an official temperature. Castleconnell, Co. Limerick recorded 25.6c on July 1st for Ireland.

    I was working in London back then and remember that day well, I recall stepping outside at 6am and being hit by a wall of heat, was like being in the tropics. What made it even more unusual was that the hottest July temp on record was on a hazy and largely cloudy afternoon, just shows how hot the airmass was.


  • Registered Users, Registered Users 2 Posts: 13,666 ✭✭✭✭sryanbruen


    From UK Met Office:
    We classify less than 1.0mm of rain in a day as a ‘dry day’. Using this threshold, several sites have had 54 consecutive dry days (starting 30 May), including a few which have had less than 1mm in the entire 54 day period.

    The sites and their total rainfall over the 54 days are:

    Heathrow (0.4 mm)
    Hampton Water works (0.6 mm)
    Kenley Airfield (1.0 mm)
    Cambridge NIAB (1.0 mm)
    Cavendish (1.6 mm)
    High Wycombe (1.8 mm)
    Shoreham Airport is close behind with 53 consecutive days of less than 1mm of rain.

    Church Lawford has had 52 consecutive dry days starting on 1 June.

    The longest run of days with no rain at all this summer so far is 48 days at Brooms Barn, near Bury St Edmunds, since 5 June. Also most of our observing sites in East Anglia have had no rain at all since 21 June.

    https://www.metoffice.gov.uk/news/releases/2018/heatwave-continues-with-temperatures-into-the-mid-30s-celsius


  • Registered Users, Registered Users 2 Posts: 13,666 ✭✭✭✭sryanbruen


    Here's October's CET graph.

    There has been no October with a CET under 9c since 1993 though October 1992 and 1993 were both two consecutive very cold Octobers (-3 to -4c below average over most parts of Ireland). The last time October had a CET under 8c was 1992 and the last time October had a CET under 7c was in 1896. Notice how cold October 1740 was (with a CET of only 5.3c!).

    0MTF1p5.png

    Data comes from Met Éireann.


  • Registered Users, Registered Users 2 Posts: 13,666 ✭✭✭✭sryanbruen


    One of my most anticipated projects is to create monthly weather summaries for Ireland for the months that Met Éireann have not produced one of before. To start the project off, I have done July 1983. I have attached the PDF file for my summary.

    I did the same layout as Met Éireann's monthly weather summaries as much as I could - though use my own logo (which is for my site/blog). I wrote it from the appropriate period of time as in act like it was wrote in August 1983 than July 2018 in the case of the records on the summary.

    *Sunshine figures are estimates and I included Casement Aerodrome on the graph because I could not find a third station outside Dublin that recorded sunshine in July 1983 in Met Éireann's historical data - I know several stations that did but Met Éireann have not made their sunshine data available in the archive online (such as Valentia Observatory).

    Here's an image of how the front of it looks:

    uledubr.png

    Would you like me to do others?


  • Registered Users, Registered Users 2 Posts: 13,666 ✭✭✭✭sryanbruen


    Here's November's CET graph. What I find intriguing about November is the fact of how many really cold ones occurred during the Glassberg Minimum or early 20th century - I have labelled each of the notable solar activity periods on this graph.

    As I said in my cold Novembers post, the last time November had a CET under 5c was 1993 whilst the last time November had a CET under 4c was ridiculously far back in 1925.

    t9fNIqb.png

    Data comes from the UK Met Office.


  • Banned (with Prison Access) Posts: 3,288 ✭✭✭mickmackey1


    I remember July 1983 for a thunderstorm that woke me up in the middle of the night - not an easy thing to do!


  • Advertisement
  • Registered Users, Registered Users 2 Posts: 13,666 ✭✭✭✭sryanbruen


    One of the many weather events that certainly stand out in the hearts of Irish weather enthusiasts along with others like Winter 1947 and the Big Snow of 1982 is the thunderstorm of 25/26 July 1985.

    According to Met Éireann:

    Widespread and spectacular thunderstorm activity occurred throughout the evening of the 25th July 1985 and continued overnight and into the morning of the 26th. Hundreds of farm animals were killed by lightning and large hailstones damaged tillage crops and crops of apples and fruit. The flooding which accompanied the storm affected farm buildings, houses, supermarkets, and stores in worst hit areas.

    At midday on 25th July 1985, much of Ireland was under a blanket of high cloud with pressure ranging from 1014 mb in the south of the country to 1016 mb up north. As the continental airflow attempted to displace the moist Atlantic air, pressure gradually fell. As pressure continued to drop, by midnight on the 26th, a shallow low was spotted moving slowly off the southeast coast of Ireland with winds generally slack. This shallow pushed northeastwards during the morning of the 26th clearing by the afternoon. You can see by the synoptics below that it was a very volatile setup indeed.

    1JYAjnn.png

    archives-1985-7-26-0-0.png

    archives-1985-7-26-0-1.png

    6iDfspG.gif

    Naas, Co. Kildare recorded up to 30mm in the space of 30-40 minutes whilst 28mm fell at Oak Park, Co. Carlow within 30 minutes and 29mm at Coon, Co. Kilkenny within 30 minutes. At the same stations, 22mm fell at Oak Park and 21mm fell at Coon within 15 minutes! The return period for events like this is over 100 years showing you how uncommon and rare it is.

    The July 1985 thunderstorm does not seem remarkable in comparison to the 11 June 1963 thunderstorm that gave more than 75mm of rainfall at Mount Merrion in Dublin within one hour. However, what stood out was the intensity of the large hailstones, the frequency of the lightning flashes and the amount of regions affected by the heavy rain and hail when in comparison, it was mainly that particular region of Dublin that was affected on 11 June 1963.

    Other notable rainfalls from this thunderstorm include:

    76.8mm at Castleshane, Co. Monaghan on 25 July
    61.8mm at Emyvale, Co. Monaghan on 25 July
    58.4mm at Coolgreany Castlewarren, Co. Kilkenny on 25 July
    57.2mm at Naas C.B.S, Co. Kildare on 25 July
    52.4mm at Kilmacthomas, Co. Waterford on 25 July
    52.2mm at Skerries, Co. Dublin on 25 July
    46.9mm at Curragh Racecourse, Co. Kildare on 25 July
    46.2mm at Duleek, Co. Meath on 25 July
    30.1mm at Tibradden Larch Hill, Co. Dublin on 26 July

    This is an RTÉ Archive video on the thunderstorm of July 1985 featuring actual footage: https://www.rte.ie/archives/collections/news/21200391-freak-storm-causes-damage/

    All data comes from Met Éireann.


  • Banned (with Prison Access) Posts: 3,288 ✭✭✭mickmackey1


    sryanbruen wrote: »
    The July 1985 thunderstorm does not seem remarkable in comparison to the 11 June 1963 thunderstorm that gave more than 75mm of rainfall at Mount Merrion in Dublin within one hour.
    I thought the hourly record was 52mm? - https://www.met.ie/climate/weather-extreme-records


  • Registered Users, Registered Users 2 Posts: 13,666 ✭✭✭✭sryanbruen


    I thought the hourly record was 52mm? - https://www.met.ie/climate/weather-extreme-records

    It's confusing alright, MÉ's own PDF on the 11 June 1963 thunderstorms state the following which would mean 82.6mm of rain though it says at least 3 inches fell within the hour.

    Maybe it's not official, I don't know.

    Perhaps something to ask them unless somebody else here knows, good spotting.

    fp7mIyP.png


  • Registered Users, Registered Users 2 Posts: 13,666 ✭✭✭✭sryanbruen


    I estimate (for the sake of this post) that July will end up with a CET of 19.2 or 19.3c.

    Here's what the CETs for 2018 and 1976 are for June/July combined

    2018 - 17.7c
    1976 - 17.9c

    W/ August

    1976 - 17.8c

    To beat 1976, August 2018 will need a CET of at least 18.1c.


  • Registered Users, Registered Users 2 Posts: 13,666 ✭✭✭✭sryanbruen


    The agrometeorological bulletin for January 1979 says the lowest grass minimum that month was -24.6c at Ballinrobe, Co. Mayo on the 1st and also -20.5c at Dunsany, Co. Meath on the 2nd but the Met Éireann records pages on their old and new site say the lowest grass minimum on record in Ireland was -19.6c at Glasnevin on 12th January 1982? Both of the values above are lower than this so only leads to confusion.

    http://edepositireland.ie/bitstream/handle/2262/71014/Agromet%20Bull%207901.pdf?sequence=1&isAllowed=y

    Not to mention, Philip Eden's Weatherwise book says that Phoenix Park recorded 33.4c on 16 July 1876? I have never seen this figure before. It also is 0.1c higher than the 33.3c record for Kilkenny Castle in June 1887. The below chart is the 500mb height synoptic for 16 July 1876. Looks very warm and dry but 33.4c? That's hard to believe.

    archives-1876-7-16-12-0.png


  • Registered Users Posts: 2,023 ✭✭✭Donegal Storm


    Maybe unreliable figures? The grass min at Dunsany on the 2nd was just -15.5C despite a similar air min to the previous night. Both air and grass min are missing from Jan '79 for Ballinarobe


  • Advertisement
  • Registered Users, Registered Users 2 Posts: 13,666 ✭✭✭✭sryanbruen


    Climatological note no. 1 on Ireland's extreme temperature records (up to December 1971) says that Mullingar recorded 29.8c on 29 June 1949 but Met Éireann's table of highest June temperatures per decade since the 1940s (on their preliminary report for Summer 2018 heatwave) says that the highest June temperature of the 1940s was 27.7c at Shannon Airport on 23 June 1949. The monthly maximum temperature records for Irish stations that was released in October 2010 also states the 29.8c June 1949 temperature as a record high for Mullingar.

    Maybe it was just a small mistake.

    http://edepositireland.ie/bitstream/handle/2262/70477/Climatological%20Note%20No.%201.pdf?sequence=1&isAllowed=y

    http://archive.met.ie/climate-ireland/extreme_maxtemps.pdf

    1GNG4pZ.png


  • Registered Users, Registered Users 2 Posts: 13,666 ✭✭✭✭sryanbruen


    I was looking at the grass minima in Dublin Airport's weather records. Found the interesting fact that an absolute grass minima of -10c or lower at the station has become less rare (not necessarily more extreme) in the past 18 years as shown by the graph below. Wonder if it's a similar case with other stations like Oak Park.

    tedO2rr.jpg

    Data comes from Met Éireann.


  • Registered Users, Registered Users 2 Posts: 13,666 ✭✭✭✭sryanbruen


  • Registered Users, Registered Users 2 Posts: 5,890 ✭✭✭Charles Babbage


    How does Glasnevin have a grass minima of -19.6°C on 12th January 1982 and there is nothing close to this in the chart at Dublin airport which is only about 6Km away?
    Might there not be local heating effects at the airport in recent years with so much traffic?


  • Registered Users, Registered Users 2 Posts: 13,666 ✭✭✭✭sryanbruen


    How does Glasnevin have a grass minima of -19.6°C on 12th January 1982 and there is nothing close to this in the chart at Dublin airport which is only about 6Km away?
    Might there not be local heating effects at the airport in recent years with so much traffic?

    That's one thing I was wondering that I forgot to mention whilst creating that graph. Here is the three main Dublin stations' daily grass minimum temperatures for January 1982 along with Glasnevin's ones. It seems Glasnevin is out on its own for its extremely low grass minimum as Phoenix Park's lowest was -15.5c and Casement Aerodrome's lowest was -13.9c. Dublin Airport's exact figure was -10.1c for interest. Merrion Square (another Dublin station) had its lowest grass minimum at just -8.5c.

    Fi3gqYl.png

    In relation to the above from January 1979, I wonder why they would allow to share faulty figures on their bulletin?

    Lots of stats today....

    Data comes from Met Éireann.


  • Advertisement
  • Registered Users, Registered Users 2 Posts: 8,219 ✭✭✭Gaoth Laidir


    I have no idea where Glasnevin's station was/is located, but it could be that the station was shaded from the low winter sunshine during the daytime, so the grass max might not have gotten as high as the other stations, which are well-exposed to the sun. So come evening time, the Glasnevin station was starting from a lower baseline, hence more scope to fall to lower.


  • Registered Users Posts: 117 ✭✭echat


    sryanbruen wrote: »

    Is that July 1876 figure of 92.3 Fahrenheit, the highest ever temperature recorded at the Phoenix Park?


  • Registered Users, Registered Users 2 Posts: 6,183 ✭✭✭Elmer Blooker


    I have no idea where Glasnevin's station was/is located, but it could be that the station was shaded from the low winter sunshine during the daytime, so the grass max might not have gotten as high as the other stations, which are well-exposed to the sun. So come evening time, the Glasnevin station was starting from a lower baseline, hence more scope to fall to lower.
    I'm certain that the Glasnevin station was/is in the Botanic Gardens.
    The city was under deep snow in January 1982 so I presume that -19.6c was recorded in some sort of frost hollow?
    The lowest temperatures seem to be recorded in the lowest lying ares when there is snow cover, I can remember being surprised by some of the temperatures recorded at Knock in December 2010, this would be the highest M.E. station but recorded higher minima than lower lying areas.


  • Registered Users, Registered Users 2 Posts: 13,666 ✭✭✭✭sryanbruen


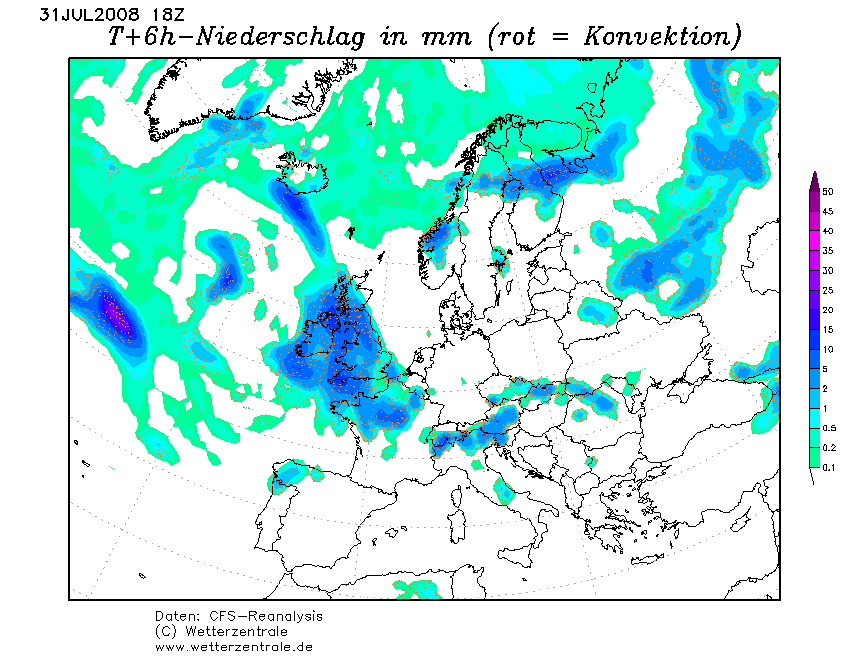
    Nearly 10 years ago, on 31 July 2008, a stationary band of heavy rain moved across Munster during the evening bringing more than 40mm at several stations. Stations south of the Shannon Estuary had totals exceeding 60mm. Limerick was among the worst areas affected by the heavy rainfall. Castlemahon in the county had a 24-hour daily rainfall of 90.1mm measured at 09:00 UTC on August 1st (see other Limerick stations' rainfall totals in the table below). This accounts for about 10% of the station's normal rainfall for an entire year. The large majority of this rain fell within 7 hours including an estimate of 84.7mm during the period. Such exceptional rainfall in a period like 7 hours has a return period exceeding at least 250 years. Rain from preceding days led soils to be close to saturation and consequently, there was no capacity in the soil to absorb excessive amounts of rainfall. As a result of this unprecedented rainfall, the River Arra in Newcastle West overflowed its banks leaving many houses and businesses severely flooded.

    Station|Rainfall total (mm)
    Newcastle West|84.9
    Ballyhahill|71.0
    Springfield|63.9
    Athea|63.3
    Patrichswell|48.4
    Adare|43.0


    archives-2008-7-31-12-0.png

    archives-2008-7-31-12-1.png

    CFSR_1_2008073118_4.png

    adXEQMy.png

    OY4byqG.jpg


    Data comes from Met Éireann.


  • Registered Users, Registered Users 2 Posts: 13,666 ✭✭✭✭sryanbruen


    I noticed that June 2018 fell within Dublin Airport and Cork Airport's top 10 sunniest months on record.

    EsBTaHg.png

    hUn5CNR.png

    I remembered now that I didn't share the December CET graph so here it is. December has been a very interesting month in modern times; December 2010 and 2015 were literally polar opposites of each other.

    HwnIBqz.png

    Data comes from the UK Met Office and Met Éireann.


  • Registered Users, Registered Users 2 Posts: 13,666 ✭✭✭✭sryanbruen


    Summary #2 of my project is complete, it's on January 1979. You can see the PDF attached.

    Winter 1978-79 as I said previously is very forgotten for some reason in Ireland, you never heard it mentioned even though it had snow depths on par with 2010 and the depth of cold on January 2nd 1979 was the coldest of the 20th century for most parts.


  • Registered Users, Registered Users 2 Posts: 13,666 ✭✭✭✭sryanbruen


    Dublin Airport's rainfall total for July 2018 overall at 40.0mm was unremarkable and the driest since 2014. Literally all of this fell in the second half of the month bar St. Swithin's Day (the 15th). There has been a trend for wetter Julys in modern times as shown by the graph with every July's rainfall total and 10 year running average. However, since 2016, this trend has been going downwards at the station.

    MUhzITU.png

    Ss3KRJx.png

    Data comes from Met Éireann.


  • Registered Users, Registered Users 2 Posts: 13,666 ✭✭✭✭sryanbruen


    July 2018's final CET came in at 19.1c. This makes it the third hottest July on record since 1659 for the CET and the fourth hottest month on record overall. Here's the top 10 hottest months on record for the CET including July 2018.

    Rank|CET|Month
    1.|
    19.7
    |
    July 2006
    2.
    |
    19.5
    |
    July 1983
    3.
    |
    19.2
    |
    August 1995
    4.
    |
    19.1
    |
    July 2018
    5.
    |
    18.9
    |
    August 1997
    6.
    |
    18.8
    |
    July 1783
    7.
    |
    18.7
    |
    July 1976/July 1852/August 1975
    8.
    |
    18.6
    |
    August 1947/July 1995
    9.
    |
    18.5
    |
    July 1921
    10.
    |
    18.4
    |
    July 1808/July 1757


    Data comes from the UK Met Office.


  • Registered Users, Registered Users 2 Posts: 13,666 ✭✭✭✭sryanbruen


    Provisionally, it was the third hottest July on record too for the UK back to 1910 behind only July 2006 and 1983 (much like the CET).

    https://www.metoffice.gov.uk/news/releases/2018/july-2018-statistics

    A warm month for Ireland but not a record breaker, July 2013, 2006, 1989 and 1983 were hotter in modern times.

    https://cli.fusio.net/cli/bulletin/data/2018/07/sum_072018.pdf


  • Registered Users, Registered Users 2 Posts: 13,666 ✭✭✭✭sryanbruen


    Looks like 1976 will remain the daddy of Summers for the UK whilst 1995 remains for Ireland. Ah well, maybe in another 42 years or 23 years.


  • Advertisement
  • Registered Users, Registered Users 2 Posts: 13,666 ✭✭✭✭sryanbruen


    Shannon Airport's daily mean temperatures for June 1970 (its previous warmest June on record) and June 2018. Both months were fairly close to each other until the end when 2018 smashed 1970 out of the water.

    VNBOxqL.png

    Data comes from Met Éireann.


  • Registered Users, Registered Users 2 Posts: 13,666 ✭✭✭✭sryanbruen


    The end of January 2002 produced some stormy weather over Ireland and this was to continue (get much worse) into February. On the 1st day of the month, a vigorous depression pushed in from the Atlantic Ocean with a central pressure of 930mb just to the northwest of Ireland. Bands of heavy rain were associated with this depression coupled with southwesterly gale force winds. All of this coincided with very high tides especially in the Irish Sea where Dublin was the worst affected region. A tide of approximately a half metre higher than the previously recorded highest tide (which was in 1924) entered Dublin port and proceeded to overtop or breach sea defenses protecting Dublin Ports East Wall and North Wall, and Dublin City's Ringsend areas.

    You can see why the depression was so deep as it was carried in by a powerful jet stream with speeds surpassing 230 km/h.

    archives-2002-2-1-12-0.png

    archives-2002-2-1-12-5.png

    This was East Wall, Co. Dublin in February 2002:

    zPC5hUI.jpg

    Parts of Dublin in February 2002:

    jbcErgw.png

    vjJhu7k.jpg

    pe2mf6o.png

    Cork in February 2002:

    BQEAodU.png

    http://www.storm-surge.info/dublin-floods-2002
    http://www.dublincity.ie/sites/default/files/content/WaterWasteEnvironment/waterprojects/Documents/City_Council_Flood_presentation_September_09_T.Leahy.pdf
    https://www.independent.ie/regionals/droghedaindependent/news/town-escaped-disastrous-flood-in-2002-27100995.html

    A randomly chosen event for today. We're coming up to the 10th anniversary of another event this Thursday.

    Data comes from Met Éireann.


  • Registered Users Posts: 117 ✭✭echat


    Anyone aware if a list of Irish heatwaves has ever been compiled? I saw a list by Met Éireann but it only covers since 2000:

    https://www.met.ie/recent-warm-weather-report-up-to-6th-july-2018

    Definition: A heatwave occurs where there are 5 consecutive days or more with maximum temperature over 25 degrees Celsius (i.e. daily maximum temperature > 25 °C.)


  • Registered Users, Registered Users 2 Posts: 16,954 ✭✭✭✭nacho libre


  • Registered Users, Registered Users 2 Posts: 13,666 ✭✭✭✭sryanbruen


    echat wrote: »
    Anyone aware if a list of Irish heatwaves has ever been compiled? I saw a list by Met Éireann but it only covers since 2000:

    https://www.met.ie/recent-warm-weather-report-up-to-6th-july-2018

    Definition: A heatwave occurs where there are 5 consecutive days or more with maximum temperature over 25 degrees Celsius (i.e. daily maximum temperature > 25 °C.)

    No but I've been working on one for you for the past day since you requested. The excel file attached is what I've done so far. Disclaimer: This is only based on the data available. There will most certainly have been more heatwaves than the file shows at certain long-term stations.

    Couldn't get into table or PDF format because the table is very long and big - will only get longer.

    Data comes from Met Éireann.


  • Registered Users Posts: 117 ✭✭echat


    Sorry Syran, I did not mean to put you to so much work. From your list so far they occurred in 17 different years with 1995 out on its own but August left to come for 2018. The top seven years are listed below. Is there a data source with the daily maximum temperatures? What other measurements are of most relevance to how humans cope with higher temperatures? Humidity?

    1995: 25
    2018: 16
    1976: 16
    2013: 14
    2006: 12
    1989: 10
    1983: 9


  • Registered Users, Registered Users 2 Posts: 13,666 ✭✭✭✭sryanbruen


    echat wrote: »
    Sorry Syran, I did not mean to put you to so much work. From your list so far they are spread over 17 years with 1995 out on its own but August left to come for 2018. The top seven years are listed below. Is there a data source with the daily maximum temperatures? What other measurements are of most relevance to how humans cope with higher temperatures? Humidity?

    1995: 25
    2018: 16
    1976: 16
    2013: 14
    2006: 12
    1989: 10
    1983: 9

    Nonsense, this is what I do everyday! :D. Nothing to be sorry about.

    All the available data can be shown in the historical data that I showed you the link to on MÉ's site. Here is the link as a reminder again: https://www.met.ie/climate/available-data/historical-data

    Any questions people ask me in regards to this thread is actually helpful to me because it allows me to create graphs, tables etc that I wouldn't be doing if it weren't for people's questions.


  • Registered Users, Registered Users 2 Posts: 13,666 ✭✭✭✭sryanbruen


    Thanks to Donegal Storm giving me an excel file of many Irish stations' every 25.0c+ day since their records began. It has allowed me further to compile my list that I made ages ago of the highest absolute maximum temperature in Ireland for every year as far back as possible. Using this file, I have been able to go back to 1961. I cannot guarantee that these are the highest of some of the years but they're the highest out of the file. If any higher maximums are found, it will be updated. I have also updated some of the years that I had previously on the list because I discovered higher maximum temperatures than what MÉ's weather bulletins have showed in that file.

    Been busy doing this and also updating the Irish heatwaves excel file with more stations.

    2018: 32.0°C at Shannon Airport on June 28th
    2017: 28.4°C at Phoenix Park on June 21st
    2016: 30.4°C at Mount Dillon on July 19th
    2015: 26.1°C at Dublin (Glasnevin) on June 30th
    2014: 28.8°C at Durrow on July 25th
    2013: 31.0°C at Dooks on July 19th
    2012: 28.3°C at Ardfert (Liscahane) on May 25th
    2011: 26.0°C at Cavan (Drumconnick) & Athy (Chanterlands) on June 3rd
    2010: 27.1°C at Elphin on May 22nd and Ardee (Boharnamoe) on May 23rd
    2009: 28.6°C at Galway (University College) on June 2nd
    2008: 25.9°C at Ardtamon on July 27th and Cork (Clover Hill) on July 28th
    2007: 27.0°C at Dooks on June 9th and Cavan (Drumconnick) on June 11th
    2006: 32.3°C at Elphin on July 19th
    2005: 30.3°C at Kildalton on July 12th
    2004: 27.3°C at Birr on August 1st
    2003: 30.4°C at Boora on August 8th
    2002: 26.5°C at Cavan (Drumconnick) on August 5th
    2001: 28.4°C at Ardee (Boharnamoe) on July 28th
    2000: 28.5°C at Cavan (Drumconnick) on June 18th
    1999: 28.0°C at Warrenstown and Athy (Chanterlands) on July 9th
    1998: 26.7°C at Cork (Clover Hill) on August 8th
    1997: 28.4°C at Ardfert on May 31st
    1996: 27.0°C at Ardfert (Liscahane) and Shannon Airport on June 16th, Kilfinnane Education Centre and Killarney (Muckross Hse.) on June 17th
    1995: 30.8°C at Kilkenny on August 2nd
    1994: 26.8°C at Portlaoise (Coolnamona) on August 1st
    1993: 28.6°C at Cork (Clover Hill) on June 27th
    1992: 27.3°C at Cork (Clover Hill) on June 27th
    1991: 28.4°C at Cahirciveen on September 5th
    1990: 31.0°C at Dublin (Glasnevin) on August 2nd
    1989: 30.5°C at Lanesboro (Doire Dharog) on July 19th
    1988: 26.0°C at Dungarvan (Carriglea) on June 23rd
    1987: 29.0°C at Waterford Airport on July 5th
    1986: 27.0°C at Clonsast (Bord na Móna) on June 27th
    1985: 25.1°C at Dublin (Merrion Square) on July 2nd & September 30th
    1984: 27.9°C at Cork (Clover Hill) on July 27th
    1983: 32.2°C at Carlow (Oak Park) on July 14th
    1982: 27.0°C at Glencolumbkille (Drimroe) on June 4th
    1981: 26.2°C at Cork (Clover Hill) on August 25th
    1980: 26.5°C at Enniscorthy (Voc. Sch.) on August 20th
    1979: 25.8°C at Enniscorthy (Voc. Sch.) on July 16th & 17th, Ballybrittas on July 27th and Dublin (Glasnevin) on July 28th
    1978: 26.5°C at Boora on May 31st
    1977: 28.7°C at Ballybrittas on July 7th
    1976: 32.5°C at Boora on June 29th
    1975: 31.5°C at Ballybrittas on August 3rd
    1974: 28.0°C at Thurles (Sugar Factory) on August 25th
    1973: 28.7°C at Boora on August 15th
    1972: 28.7°C at Killarney (St. Finans Hosp.) on July 19th
    1971: 26.9°C at Enniscorthy (Voc. Sch.) on July 8th
    1970: 27.9°C at Warrenstown on June 10th
    1969: 29.6°C at Fermoy (Moore Park) on July 15th
    1968: 26.6°C at Tuam (Airglooney) on June 12th
    1967: 26.4°C at Ballybrittas on June 17th
    1966: 26.2°C at Ballincurra on July 22nd
    1965: 25.2°C at Ballybrittas on June 29th
    1964: 26.0°C at Ballybrittas on August 3rd
    1963: 26.8°C at Dublin (Rathfarnham Castle) on July 30th
    1962: 25.0°C at Clonsast (Bord na Móna) on June 8th
    1961: 28.4°C at Gurteen (Agr. Coll.) on September 1st

    Data comes from Met Éireann.


  • Registered Users Posts: 117 ✭✭echat


    That's fantastic work Syran. When Met Éireann and CSO finish their data rescue project, pre-1961 will be available https://www.cso.ie/en/methods/climate/csoclimatedatarescue/


  • Advertisement
  • Registered Users, Registered Users 2 Posts: 13,666 ✭✭✭✭sryanbruen


    Irish heatwaves excel file updated with more stations attached.

    You can also view this as a table here: https://bruener45.wixsite.com/britishislesclimate/irish-heatwaves


  • Registered Users Posts: 117 ✭✭echat


    Huge work Syran, thanks. You went from 116 heatwaves yesterday to 334 which really shows that Ireland can be warm. Surprisingly this century does not dominate - August and July 1976 do. A good August 2018 is needed!

    The highest mean maximum is 29.9 (Enniscorthy in 1983 with the maximum there at 31.2 which is very close to the mean) so that 30 is a barrier still standing for the mean maximum in a heatwave.


  • Registered Users, Registered Users 2 Posts: 13,666 ✭✭✭✭sryanbruen


    This is every ice day that Cavan (Loretto College) recorded. An ice day is a day where the maximum temperature does not get above 0c all day. This station of course holds Ireland's all-time low maximum on record for any month of -9.8c on 21st December 2010.

    Day|Maximum temperature|Minimum temperature
    27 Dec 1995|-4.0|-12.0
    28 Dec 1995|-1.0|-10.5
    28 Dec 2000|-2.0|-7.5
    29 Dec 2000|-1.5|-11.1
    24 Dec 2009|-1.1|-6.7
    8 Jan 2010|-1.0|-10.8
    28 Nov 2010|-0.4|-5.7
    2 Dec 2010|-0.5|-6.1
    3 Dec 2010|-0.3|-7.8
    6 Dec 2010|-0.2|-7.4
    7 Dec 2010|-1.1|-11.4
    8 Dec 2010|-0.5|-12.1
    18 Dec 2010|-3.0|-9.9
    19 Dec 2010|-1.5|-11.1
    20 Dec 2010|-6.3|-13.9
    21 Dec 2010|-9.8|-12.8
    22 Dec 2010|-4.9|-14.4
    23 Dec 2010|-2.1|-14.2
    24 Dec 2010|-2.3|-14.2


    Data comes from Met Éireann.


  • Registered Users Posts: 1,685 ✭✭✭Mobhi1


    December 2010 was cold.


  • Registered Users, Registered Users 2 Posts: 13,666 ✭✭✭✭sryanbruen


    Mobhi1 wrote: »
    December 2010 was cold.

    yd60lCU.gif


  • Registered Users, Registered Users 2 Posts: 1,484 ✭✭✭Jpmarn


    Which is more common in Ireland, Very hot days of temperature maxing out at 30c or over or Ice days when temperatures only max out at 0c or below? Take your time to answer this question. At least we’ve seen both these days this year but I think the very hot days leading. December 2010 brought a good deal of ice days. It's not every year that you get very hot days nor ice days. Yet you seldom come across such days in the one year such as 2018.


  • Advertisement
  • Registered Users Posts: 2,021 ✭✭✭Artane2002


    Jpmarn wrote: »
    Which is more common in Ireland, Very hot days of temperature maxing out at 30c or over or Ice days when temperatures only max out at 0c or below? Take your time to answer this question. At least we’ve seen both these days this year but I think the very hot days leading. December 2010 brought a good deal of ice days. It's not every year that you get very hot days nor ice days. Yet you seldom come across such days in the one year such as 2018.

    I have no evidence to back this up but I'd say ice days used to be more common than 30c+ days but recently I'd say 30c+ has become more common than ice days. I'm sure someone will have a better answer.


  • Registered Users, Registered Users 2 Posts: 13,666 ✭✭✭✭sryanbruen


    Jpmarn wrote: »
    Which is more common in Ireland, Very hot days of temperature maxing out at 30c or over or Ice days when temperatures only max out at 0c or below? Take your time to answer this question. At least we’ve seen both these days this year but I think the very hot days leading. December 2010 brought a good deal of ice days. It's not every year that you get very hot days nor ice days. Yet you seldom come across such days in the one year such as 2018.

    That's a very good question and will require a lot of compiling lists. I will be looking for any day that failed to reach above 0c or reached/exceeded 30c at any station i.e. so like if only one station fits the criteria, that day will be considered in answering your question. I do this because of regional variation.

    Meanwhile, I've been up to making a weather record table for Dublin Airport - will do more if people love them.

    I have attached the Word document containing the table if the table image here is too small (for some reason, not all of the table is showing up when I copy and paste it into Paint) or you want to make use of the data for yourself.

    3rWFie2.png

    Data comes from Met Éireann.


  • Banned (with Prison Access) Posts: 3,288 ✭✭✭mickmackey1


    I would guess that 1947 produced ice and tar-melt days ;)


  • Registered Users, Registered Users 2 Posts: 8,913 ✭✭✭Danno


    IIRC, we've had 4 ice days and three over 30s days in 2018. Will check the records soon and confirm.


  • Registered Users Posts: 2,023 ✭✭✭Donegal Storm


    sryanbruen wrote: »
    That's a very good question and will require a lot of compiling lists. I will be looking for any day that failed to reach above 0c or reached/exceeded 30c at any station i.e. so like if only one station fits the criteria, that day will be considered in answering your question. I do this because of regional variation.

    I should be able to put together an SQL query that lists every ice day and 30C+ day. I'll have a look this evening when I'm home


  • Advertisement
Advertisement