Advertisement
If you have a new account but are having problems posting or verifying your account, please email us on hello@boards.ie for help. Thanks :)
Hello all! Please ensure that you are posting a new thread or question in the appropriate forum. The Feedback forum is overwhelmed with questions that are having to be moved elsewhere. If you need help to verify your account contact hello@boards.ie
ENSO index and the Irish Winter: An ongoing study.
Options
-
11-10-2010 12:14pm#1Over the last while, the question has been asked more than once here on Boards.ie if the El Nino/La Nina Southern Oscillation, or the 'ENSO' has any bearing on the overall weather patterns during the winter here in Ireland.
The truth is, it is hard to say. The primary driving force of the weather over Ireland during the winter (and at any other season for that matter!!) is the North Atlantic Oscillation (NAO), which a lot more often than not is in a postive state bringing a typical zonal westerly based pattern over Ireland with the usual sunshine and scattered showers and the odd wet dark day.
In this thread however, I am hoping to see if there is any connection between the ENSO index and the Irish weather/climate pattern during the winter months (that is, December/January/February). Can a pattern be established? I don't know but as this will be an ongoing study over the next month or so maybe I might find some connection, dealing with specific parameters, such as MSLP anomalies, temperature and rainfall deviations and so forth and how they might coincide with the Nino index in any given year or over a number of years.
Will welcome very much any criticisms or differing views from my own interpretations (because that is all they are, my intepretations) of the data & statistics that will be used in this thread. There are deeper, darker and more intricate scientific minds than mine here on Boards who may see differing data patterns to me!
Just to add, I will be using data from just 4 synoptic stations from around country, and primarily focus on just 2, that is Malin Head and Valentia, with data from Claremorris and Dublin Apt used in some cases just to give a sense of the whole. In all cases, the data used will be from the the winter of 1956 up to the winter 2010. Not nearly enough to establish a climitological pattern of how each postive/neutral/negative might affect Ireland but nontheless, might give an idea.
By the way. You can blame Nacho Libre for promting me to do this in the first place..
Sorry for the long winded introduction. Time to get to work!
Part One.
La Nina Winter (cold Nino phase) and mean sea level pressure patterns over Ireland.
As mentioned already, the primary driving force of the winter weather over Ireland is the Icelandic low to the north and the Azores high to the south with us inbetween somewhere under all that stratus gloom.
The 1961-1990 30 year winter season Mean Sea Level (MSLP) gradient pattern over Ireland reflects this nicely: (forgive bad artistry )
)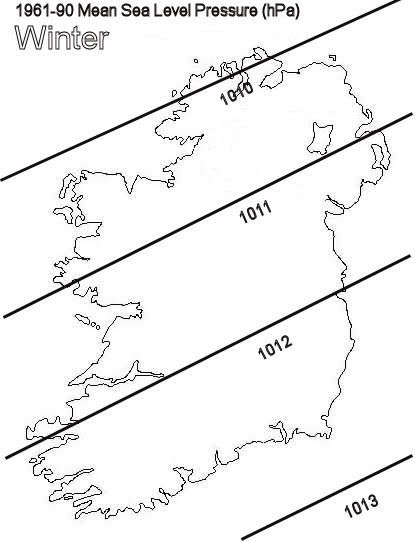
(Data on map based on Dec/Jan/Feb 61-90 MSLP averages of Johnstown Castle, Belmullet, Valentia, Dublin Apt, Claremorris & Malin Head)
A slightly west of South-west gradient pattern with typifies the predominant weather pattern over Ireland during the winter months.
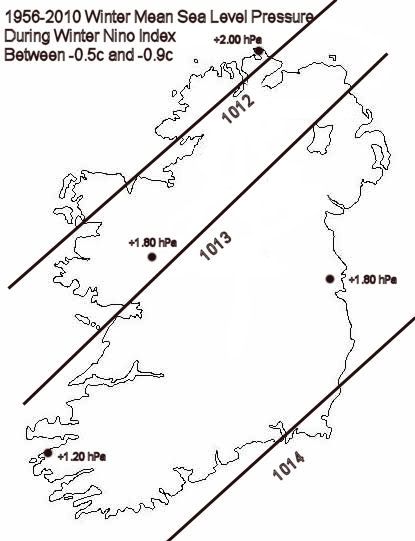
Interestingly, when I averaged out the winter MSLP values that occurred during La Nina winters since 1956, a notable increase in the average MSLP values became evident: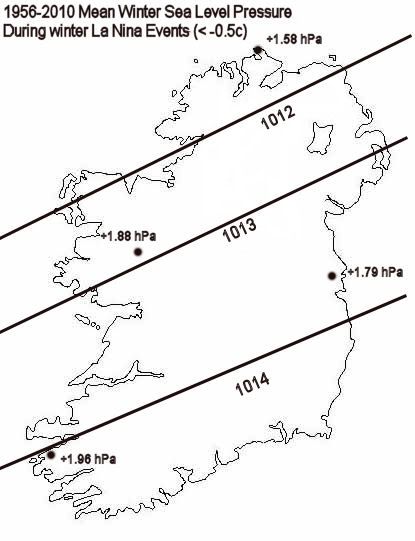
(mean MSLP values based on winter cold nino years since 1956 to 2010 and based on MSLP values from Malin Head, Claremorris, Dublin Apt and Valentia)
As can be seen from the map above, the average MSLP values during the winter season appear rise a little during cold nino phase winter events (< -0.5c), by as much as 2.0 hPa in the south, and 1.5 hPa in the north, which despite the actual rise, suggests a slight tightening (from the 61-90 mean) of the gradient pattern over Ireland during the winter season as a whole.
As to the strength of winter La Nina events and MSLP deviations over Ireland, a further breakdown of averages was needed! (I have been writing this post for exactly an hour now an I is getting tired!!!!!!)
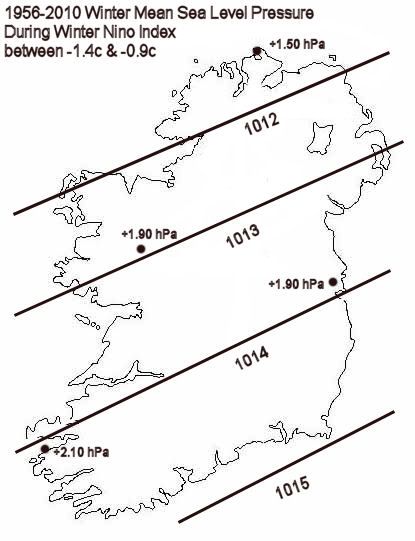
Below are maps showing mean winter MSLP averages and deviations when the winter nino index are between -2.0c and -1.5c (strong La Nina); -1.5c & -0.9c (moderate La Nina) and -0.9c & -0.5c (weak La Nina) respectively: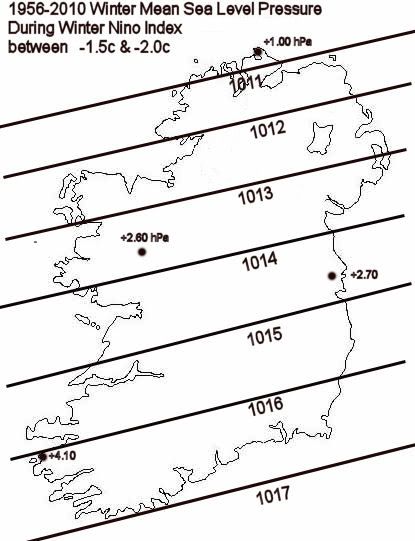
Going from the maps above, it is interesing to see that during strong La Nino events, that the mean gradient isobar pattern increases substantially, despite a positive MSLP value anomaly from the 61-90 norm. Also interesting is that this mean gradient pattern widens out a little during moderate La Nina winters and even more so during weak winter La Nina events.
Edit: Finish off:
Going from the maps above, it is interesting to see that during strong La Nino events, that the mean gradient isobar pattern increases substantially, despite a positive MSLP value anomaly from the 61-90 norm. Also interesting is that this mean gradient pattern widens out a little during moderate La Nina winters and even more so during weak winter La Nina events.
1st map shows the average mean sea level pressure that occurred over Ireland during strong winter La Nina events since 1956, of which there was 4: 1973-1974/1988-1989/1975-1976/1999-2000. Average out over these 4 years, the MSLP gradient pattern that emerges is remarkably tight. The isobar gradient between Malin Head and Valentia for example equated to 5.19 hPa, which is around 2.40 hPa above the actual 61-90 normal gradient difference between the 2 stations. Despite this apparent isobar gradient tightening, MSLP anomalies from the 61-90 norm also increased, and quite markedly at Valentia, by as much as 4.10 hPa and much less so at Malin Head, which sees an increase of just 1.0 hPa. Also of note is the more westerly alignment of the gradient pattern against the actual normal.
This would seem to suggest that strong La Nina winter events has the effect of increasing the isobaric gradient over the north Atlantic in general between a stronger than average Azores High and fairly vigorous Icelandic low, resulting in a fairly mobile zonal winter pattern over Ireland. In later chapters, we will see how this pattern coincides with winter rainfall and temperature deviations across the country.
Both Figure 2 and Figure 3, which show both the average MSLP patterns over Ireland of moderate to weak winter cold Niño phases during the winter months, suggest that the isobaric gradient slackens a good deal during moderate to weak winter La Nina events over the north Atlantic.
The mean MSLP of the moderate winter La Nina (nino index of between -0.9c &-1.4c) events since 1956, which equates to 5 years (1999-2000/2007-2008/1995-1996/1971-1972/1984-1985) does show slacker gradient pattern as compared to stronger La Nina winter events, with the mean gradient difference between Malin Head and Valentia of 2.98 hPa, which is over 2.00 hPa lower than the during strong cold phase winters. MSLP anomalies lower a good deal at Valentia but rise a little at Malin Head with the gradient pattern a little more to the SW, which is closer to normal.
This pattern may indicate that the Icelandic low is a little weaker than normal during moderate La Nina winters allowing more ridging from the Azores High during the winter months over Ireland. How this coincides with temperature and rainfall anomalies during these events I have yet to find out but will discuss in later chapters!!!
During weaker winter La Nina events (3rd pic), the average mean sea level pattern over Ireland becomes a little more interesting. Not only does it show a marked ‘backing’ to the SSW of the mean gradient flow, but an increased widening of isobars over the east of the country, but a tightening over the NW. Also interesting is that Malin Head sees an increase in its MSLP anomaly, by up to 2.00 hPa, while Valentia sees a further drop, if still a little above average. This may suggest that ridging to the north and east would be more likely to occur during weak winter La Nina’s than during moderate to strong cold nino phase winter events. Again, this is open to interpretation as I need to assess the mean temperature and rainfall patterns over Ireland during weak winter La Nina events and will discuss these later on in this thread, but it is interesting the note that the winter of 1962-1963 in Ireland occurred during a weak winter La Nina event!!! (-0.6c)
Chart showing gradient depth of mean sea level pressure between Malin Head and Valentia during winter La Nina years since 1956: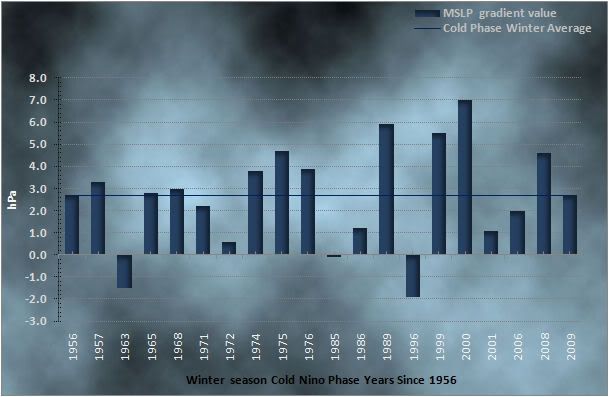
Out of the 20 La Nina winters since 1956, only 2 have had a winter mean where Malin Head's mean SLP value came out higher than Valentia. 1962-1963 and 1995-1996.
In Part 2, will look at winter rainfall averages and how they may deviate from the norm over the country during La Nina winters.") 21
21
Comments
-
That's an impressive piece of work - very thesis-like!!
Looking forward to reading the rest ..0 -
-
Good stuff DE. I was one of those asking this very question earlier so this thread is very much appreciated.0
-
Deep Easterly wrote: »Thanks Fiona!. I am trying to avoid the thesis like style. I never want to go through that again!

Shhhhhhhhhhh I am currently doing something very similar to this for an actual Thesis:eek::o
However you've probably done more work on it than me to this point:D0 -
WMO: Moderate to strong La Niña to continue into 2011
Monday, October 11th, 2010 at 2:27 pm
GENEVA (BNO NEWS) -- Moderate to strong La Niña conditions are now well-established in the equatorial Pacific Ocean, and are likely to continue at least until the first quarter of next year, according to the El Niño/La Niña Update issued by the World Meteorological Organization (WMO) on Monday. These conditions may possibly further strengthen during the next 4 to 6 months.
La Niña is characterized by unusually cool ocean temperatures in the central and eastern tropical Pacific. It is the opposite of El Niño, which is characterized by unusually warm ocean temperatures.
Both events can last for 12 months or more and disrupt the normal patterns of tropical precipitation and atmospheric circulation, and have widespread impacts on climate in many parts of the world accompanied by the associated climate-related risks.
"Almost all forecast models predict continuation and possible further strengthening of this La Niña episode for the next 4-6 months, taking the event well into the first quarter of 2011," the WMO said in a statement.
The U.N.-agency said this is because of the strong interaction between the oceanic and atmospheric aspects of the current event and the large area of below-average subsurface temperatures.
The current La Niña developed quickly in June and July 2010, following the dissipation of the 2009/2010 El Niño in April. Since August, the event has been moderate to strong.
In the central and eastern equatorial Pacific, sea surface temperatures are around 1.5 degrees Celsius cooler than average. The atmosphere across the tropical Pacific is now well coupled to this sea surface temperature pattern, with strengthened trade winds and reduced cloudiness over a substantial part of the central and eastern equatorial Pacific.
The subsurface waters of the central and eastern equatorial Pacific also strongly reflect La Niña conditions, with temperatures being 2 to 6 degrees Celsius below average. This large volume of anomalously cold water will likely maintain or strengthen the cold waters already at the ocean surface.
The WMO said the current La Niña has similarities to past events, but believes its impact upon local climates will differ from those in the past.
http://wireupdate.com/wires/11133/wmo-moderate-to-strong-la-nina-to-continue-into-2011/0 -
Advertisement
-
Weathercheck wrote: »Shhhhhhhhhhh I am currently doing something very similar to this for an actual Thesis:eek::o
That is very interesting Mathew. Maybe this thread will help you with some stuff or maybe not. If you find any information in this thread contrary to your own research findings please post them up as I don't really want to use this thread just to promote my own ideas on the influence (if any) of Nino events on the Irish weather. I would much prefer a consensus!0 -
Hey DE,
That's an interesting read. As a matter of interest when you have the ENSO correlation done would it be useful to repeat your methods using the NAO as the variable? Just to see if there may be a stronger correlation between the two i.e. that a stronger NAO cancels out any perceived influences of a strong ENSO event.
Haven't studied any of this since my undergraduate days so its an inquiry more so than advice on how to bring your little project further. 0 -
Hey DE,
That's an interesting read. As a matter of interest when you have the ENSO correlation done would it be useful to repeat your methods using the NAO as the variable? Just to see if there may be a stronger correlation between the two i.e. that a stronger NAO cancels out any perceived influences of a strong ENSO event.
Haven't studied any of this since my undergraduate days so its an inquiry more so than advice on how to bring your little project further.
Good advice and will be taken on board, but for the time being it will be interesting to see if the ENSO does have a bearing on a stronger NAO during the winter months, rather than the stronger NAO seemingly canceling out the effect of the ENSO influence.
I know that sounds a little confusing, it does to me anyway!0 -

In the ocean, large-scale wave-like motions play a large role in ENSO (El Niño - Southern Oscillation). In this figure we see a perspective view of the entire Tropical Pacific Ocean.
The animation follows the evolution of sea level (the undulating surface) and sea-surface temperature (color) for a Warm event followed by a Cold event as simulated by the numerical model of Battisti(1988). This model is a version of the Zebiak-Cane model, one of the first coupled atmosphere-ocean models used to make predictions of ENSO. Motions in the real world are significantly more complex than those shown here.
The relatively small motions in sea level shown here (10 - 20 centimeters) are indicative of much larger motions in the opposite direction in the depth of the thermocline below the surface. (Thermocline animation) Vertical displacements of the thermocline are particularly important along the equator in the eastern half of the Pacific basin, where they control the availability of cold water that can reach the surface through the process known as upwelling.
For example, when the sea level is low, the thermocline tends to be shallow, indicating that unusually cold water is near the surface. Upwelling motions can then bring this cold water to the surface, resulting in cold conditions. When the sea level is high the situation is reversed, with cold water lying too deep to reach the surface. The result is a warm event.
The waves on the thermocline are caused by winds blowing over the ocean, and they can freely propagate for some time before they die out. The reflections of the waves off the western boundary are an important process in the delayed-oscillator theory for ENSO.
Don't know if this is any use to your study.0 -
Don't know if this is any use to your study.
Very interesting post Redsunset. Your amount of knowledge and understanding on the ENSO phenomena scares me! My study for the time being is just trying to establish a connection, if there is any, between the nino index and how might coincide with the actual weather in Ireland during the winter period. But maybe when that is all done with and concluded maybe go onto the more complex stuff such as your suggestion as I am still only learning myself about how the ENSO works, but learning I am. 0 -
Advertisement
-
Deep Easterly wrote: »Very interesting post Redsunset. Your amount of knowledge and understanding on the ENSO phenomena scares me! My study for the time being is just trying to establish a connection, if there is any, between the nino index and how might coincide with the actual weather in Ireland during the winter period. But maybe when that is all done with and concluded maybe go onto the more complex stuff such as your suggestion as I am still only learning myself about how the ENSO works, but learning I am.
Thanks however i can't take the credit,their not my words.
Although i do understand what its saying.
Oh so much to learn and so little time eh:)0 -
Oh so much to learn and so little time eh:)
Maybe having too much time is the problem..;)
I would very much appreciate though if you could connect your understanding of the ENSO and its relation to the Irish weather during the course of this thread because what I may conclude you may not. 0 -
Have a read of this site,loads of info. Now all we got to do is make the connection with us
http://climatechange1.wordpress.com/
Introduction
High pressure cells are areas of descending air while ascending air is found in low pressure cells. Air travels from high to low pressure in a circuitous fashion, crossing isobars (lines of equal pressure). When isobars are close together, the wind velocity is greater. Speculatively, the speed and volume of flow depends upon the pressure differential and also the size of the cells involved.
The Trade Winds originate in high pressure cells centred at about 30° of latitude in winter and 50° of latitude in summer. Air flows from these high pressure cells towards low pressure cells at the inter-tropical convergence near the equator. There is a wind with a westerly component that flows towards the poles from these same high pressure cells. High pressure cells are largely cloud free. High pressure cells establish and endure most strongly over cold waters that are free of the diurnal flux in temperature evident over the land. However, a large high also establishes north of the Himalayas, on land, dominating the northern circulation in winter.
The intensity of the wind in the trade wind zone drives wave action that determines the surface area of the ocean and thereby evaporation. Under high and relatively invariable levels of sunlight, the rate of evaporation from tropical waters is the prime factor determining surface temperature. But, the trade wind also drives the flow of the equatorial currents and determines the degree of upwelling of cold waters from below. This cools the eastern margins of the oceans. Cool waters are driven in a westerly direction by the trades.
It is plain therefore that warm tropical waters are associated with slackness in the trade winds. In the Pacific this is the ‘El Nino’ situation. The reverse, ‘La Nina’ is characterized by vigorous trade winds, enhanced surface cooling by evaporation and strongly upwelling cold waters. These phenomena are seen in tropical latitudes in all oceans.
One notes that the flux in global temperature closely follows that in the tropics. It is common parlance that ‘teleconnections’ link change in temperature of the Pacific Ocean to change in the weather around the globe. The El Nino Southern oscillation (ENSO) is seen as the major mode of inter-annual variation in the climate of the earth.
Since the intensity of the Trade winds depends upon the pressure differential between subtropical high pressure cells and lows located at the equatorial convergence, we can infer the strength of the trades via the flux in surface atmospheric pressure0 -
Type in exact location either, like valentia.
If these don't help lad then nothing will,its perfect for designing a huge graph and your the expert on them.
http://iridl.ldeo.columbia.edu/home/.blyon/.cpc/.ENSO_temp_anom.html
These maps allow you to click on any location you desire to view the time series of temperature and precipitation. These time series show how these quantities have varied during past El Niño and La Niña events.
Point Selected: 53N, 9W
Seasonal Temperature (departure from mean)
RED BARS: El Niño, BLUE BARS: La Niña, GREY BARS: Neutral
December-FebruaryMarch-May

Legend for bar colors
June-AugustSeptember-November

Base Period (all plots) 1950-1998For seasonal temperatures during warm, cold, and non-ENSO phases
CLICK desired region on MAP
http://iridl.ldeo.columbia.edu/home/.blyon/.cpc/.ENSO_prcp_anom.html
Point Selected: 52.5N, 7.5W
Seasonal Precipitation (Departure from long-term average)
December-FebruaryMarch-May
 June-AugustSeptember-November

ClimatologyLegend
[*]Bar color: Red - El Niño, Blue - La Niña,
Grey - Neutral
[*]Precipitation: departure from average (mm)
[*]Dashed Lines: drawn every 25 mm
[*]Sea Surface Temperature: NINO 3.4
[*]Data: UEA, Base period 1961-1990
[/SIZE]0 -
Here they all are sorry for the messy posts.See what you can get out of them.
Time series
These maps allow you to click on any location you desire to view the time series of temperature and precipitation. These time series show how these quantities have varied during past El Niño and La Niña events.- Precipitation (percentiles)
- Precipitation (departure from mean)
- Temperature (percentiles)
- Temperature (departure from mean)

These plots, which are called 'composites', show the average effect of El Niño or La Niña on precipitation. They are made by taking the average of the precipitation from several El Niño or La Niña events. Specific Events
These plots show the departures of precipitation from the 1961-1990 average during specific El Niño and La Niña events. You can view the plots a year at a time, or view an animation of all years. When you look at the plots a year at a time, you can click on the image to bring up a menu that allows you to zoom (using the controls at the side of the plot) on particular regions.
El NiñoSeasonYears IncludedDec-Jan-Feb1957-58, 1965-66, 1968-69, 1969-70, 1972-73, 1982-83, 1986-87, 1991-92, 1994-95, 1997-98, Animate Mar-Apr-May 1958, 1969, 1982, 1983, 1987, 1991, 1992, 1993, 1997, 1998, Animate Jun-Jul-Aug 1957, 1963, 1965, 1972, 1982, 1986, 1987, 1991, 1997, Animate Sep-Oct-Nov 1957, 1963, 1965, 1972, 1982, 1986, 1987, 1991, 1994, 1997, Animate
La Niña
Season Years Included Dec-Jan-Feb 1949-50, 1955-56, 1967-68, 1970-71, 1973-74, 1975-76, 1984-85, 1988-89, Animate Mar-Apr-May 1950, 1956, 1964, 1971, 1973, 1974, 1975, 1988, 1989, Animate Jun-Jul-Aug 1950, 1954, 1955, 1956, 1964, 1970, 1973, 1975, 1988, Animate Sep-Oct-Nov 1950, 1955, 1956, 1964, 1970, 1973, 1975, 1988, 1998, Animate0 -
Absolutely incredible stuff Redsunset. Thanks for taking the time to post up all those links and information. Certainly will come in very handy indeed.
A sun themed tune to help you relax after all that!!!
0 -
Good man ,i searched really hard for them.:)
Chilling out to a bit of BOB,nice one.
0 -
To continue this on, a short post on mean winter rainfall percentages during La Nina winters. In part one, we seen averaged out from all the la nina winters since 1956, mean sea level pressure during the winter season tends to run a little higher than normal during the season; so, how does the mean rainfall for the season work out? does it correspond with the MSLP anomalies?
Here are some badly put together maps to see. Values are used from met eireann stations Malin Head, Dublin Apt, Johnstown Castle, Valentia and Claremorris, and the percentage figures are based on the deviations from 61-90 average rainfall totals from each station.
Firstly, Winter season mean rainfall % during strong negative nino episodes (MSLP anom charts included to give a better scope)
as discussed in part one, the mean sea level pressure over Ireland during strong La Nina's on average is higher than normal, but with a stronger than average gradient from north to south. Mean rainfall anomalies for the same seem to correspond nicely, with mean winter rainfall averages being slightly above further northwest, and a bit below further southeast. Fairly typical of a normal zonal set up during the winter months.
Mean % of normal winter rainfall during moderate la nina events:
Mean rainfall % during moderate La nina events seem to fall very slightly in the west, but increase slightly towards the SE. while they remain below average in the east. This reflects nicely the slight backing of the mean gradient flow of the MSLP to the SW as well as a slight widening of the gradient.
During weak La Nina winters, mean seasonal rainfall % totals fall even further in the west, but increase in the east, as the maps below show:
These rainfall anomalies seem to suggest once again that blocking events to the east and north are more likely to occur during weak la nina winters, with Atlantic lows running a little bit more to the south of normal with an increase chance of blocking to the north and east.
I haven't gone into much detail on the maps above as I am dying with the flu at the moment and my patience with writing in detail is low. But anything I did write is only from my persepctive. The maps above should allow others to make comparrisons between mslp and rainfall anomalies during the winter season during la nina events, and will welcome any alternative interpretations of the data used.
In part 3. How does temperature anomalies correspond with the data used above during la nina winters? Tune in next time to find out!!!!0 -
Good work Deep, I think it should be submitted to Google Scholar....Easterly, D., 2010: ENSO index and the Irish Winter: An ongoing study.
Boards.ie Wea. Forum, 68445545 0
0 -
The main effect of La Nina seems to be a stronger zonal index across large parts of the northern hemisphere. As to what kind of temperature trends are contained in that stronger zonal flow, the scatter is so large as to make prediction more or less the same challenge as before we identify the La Nina.
You would expect that if La Nina had a strong modulating effect on seasonal temperature, it would certainly show up in North America which is closest to the signal's location in the North Pacific. But in the years listed, there is a huge disparity in individual monthly anomalies at given locations. Two cases listed (1949-50 and 1975-76) have almost a total reversal of temperature trends. Over the Great Lakes region, Dec 1949 into Jan 1950 was a very mild period with frequent record highs, whereas Dec 1975 into Jan 1976 was very cold with some record lows on almost the same dates as the 1950 record highs (Jan 24 for the record lows, Jan 25-26 for the record highs). Then in both winters, there was a pattern change in mid-February giving a cold end to the winter in 1950 and a very mild conclusion in 1976.
The scatter of the other examples is fairly random on either side of normal.
American long range forecasters usually say that a La Nina winter will bring cool, wet conditions to the Pacific northwest, dry and mild across the southern half of the U.S. and stormy in the Great Lakes. This is probably the gross signal of all cases averaged out, but there again, variations are considerable.
I would imagine you might find the same scatter of actual cases across the Atlantic and into Ireland and the U.K. Just looking at the list, 1955-56 was a much colder winter than 1988-89.
At the same time, I think the large-scale, averaged-out signals are important and give us some understanding of global climate process, but we need to be aware that we are only explaining about 20-40 per cent of the variance with some of these large-scale teleconnections and that month to month variability remains a big factor and one that is apparently unrelated to the large-scale processes (with the caveat that the strongest signals like the 1998 El Nino can begin to dominate the monthly scale variability).
It's sort of like the analogy where you have a symphony orchestra, and the conductor decides to bring in an extra row of violins or brass -- a somewhat different blended sound is achieved, but it's not a case where the listener hears entirely different music. Anyway, that's my two cents worth about the ENSO question. A lot of the weaknesses of ENSO based long-range forecasts could be seen last winter when the Mid-Atlantic states had their heaviest snowfalls in recorded history. This was really close to being a total contra-indication of the El Nino climatology.
Atlantic signals have a much more robust performance as signals because the Atlantic is a smaller ocean, it tends to greater extremes of blocking than the Pacific, and the land masses in the northern part of the basin are glaciated therefore can sustain much stronger blocking highs than similar latitudes of the North Pacific. When we talk about changes in the Pacific circulation, we need to keep in mind that basically it is always a zonal set-up, in my part of the world we just don't get long-lasting blocking highs off to our north, except for shallow surface features that tend to feed surface cold south. From about October to February, there is usually a progression of strong frontal systems across the coast here, and it takes a very unusual change in the jet stream location to bring about anything but mild, rainy and windy conditions as the dominant. When there is a block nearby, we tend to flip to the extreme of having severe cold nearby and snow along the coast, but usually these spells just end suddenly whenever the raging zonality returns.0 -
Advertisement
-
Good post M.T, and riddled with common sense as usual. I agree with you, the scatter from one individual year to the next is just too random to be narrowed down that easily. All I am trying to do with this thread is trying to establish a 'normal', which does not actually mean a normal, if you know what I am saying.
Still, it is interesting I think to put a particular nino index in an Irish context to see if there is any long term trend. Strangly, in the little bit of research I have done, La nina winters do tend to be fairly zonal but in a fairly weak way; neutral nino winters I have discovered are more likely to spur on a more violent zonal index. 0 -
-
Not by a long shot. :cool:0
-
We have since had a bloody cold winter followed by a bloody warm winter (only so far!!) so I think it is high time for Deep Easterly to refresh this thread with a further observation or two on this theory of his. 0


 https://www.youtube.com/watch?v=CuZPyEEYuX0


Advertisement