Advertisement
If you have a new account but are having problems posting or verifying your account, please email us on hello@boards.ie for help. Thanks :)
Hello all! Please ensure that you are posting a new thread or question in the appropriate forum. The Feedback forum is overwhelmed with questions that are having to be moved elsewhere. If you need help to verify your account contact hello@boards.ie
Hi all! We have been experiencing an issue on site where threads have been missing the latest postings. The platform host Vanilla are working on this issue. A workaround that has been used by some is to navigate back from 1 to 10+ pages to re-sync the thread and this will then show the latest posts. Thanks, Mike.
Hi there,
There is an issue with role permissions that is being worked on at the moment.
If you are having trouble with access or permissions on regional forums please post here to get access: https://www.boards.ie/discussion/2058365403/you-do-not-have-permission-for-that#latest
There is an issue with role permissions that is being worked on at the moment.
If you are having trouble with access or permissions on regional forums please post here to get access: https://www.boards.ie/discussion/2058365403/you-do-not-have-permission-for-that#latest
CC3 -- Why I believe that a third option is needed for climate change
Comments
-
That's amazing. I was looking through current sst charts and came across this very nice one that shows the sharp thermal contrast between the gulf stream and the still cold water around the Canadian maritimes. I go to post it and I see your post!
https://www.ospo.noaa.gov/data/ocean/ohc/images/sst_naQG3_ddc.gif 0
0 -
Interesting.. in more ways that one:
I've noticed that in the last few months, there seems to be a slight steer away from the narrative of excess and dangerous warming towards one that that is now trying to fill us with fear about a potentially dangerous cooling... if we don't repent of our sins.
The plot thickens.
So wait, it could cause a massive cooling of the northern hemisphere by 2300, which would cause a 0.5-metre rise in sea levels around the north Atlantic basin? So warming and now cooling both cause a rise in sea levels? Hmmm...
Current Arctic extent has just about caught up with 2012 and is above 2016 and 2019, along the same line as 2018. He conveniently left out those years.
 0
0 -
I remember stories about the imminent collapse of the gulf stream from at least 30 years ago.
It was the fact that melting glaciers reduce the salinity of the sea water causing it to sink quicker and slowing down the flow northwards.
now to watch the video to see if the same story is being repeated.
Edit: nothing new in the video, but the only comment I do have is the sea ice extent measurement, if at the start of the melt season in march the extent figures are higher than "usual" (whatever that is) then it probably means that the ice is very fragmented and spread out.
When the sea ice is fragmented and spread out it will melt much quicker than if it was tight and having a lower extent.
2020 figures then could be suggesting a tight formation of sea ice that will be slow to melt later in the season, we'll find out in September.0 -
Interesting.. in more ways that one:
I've noticed that in the last few months, there seems to be a slight steer away from the narrative of excess and dangerous warming towards one that that is now trying to fill us with fear about a potentially dangerous cooling... if we don't repent of our sins.
The plot thickens.
Did you actually watch this video?
He said that according to our best available science, it is very unlikely that there will be a full shutdown of the gulf stream in at least the next 300 years, and even a weakening of the gulf stream would not cause cooling because the reduction in transported heat would be more than offset by the warming caused AGW
And this isn't new, Scientists have known about the potential weakenig of the gulf stream due to meltwater from Greenland for decades and are measuring it to get a better undestanding of what the tipping points could be and what effects such weakening will have0 -
-
-
It is implied throughout the entire that Northern Europe could experience cooling if the Gulf stream is weakened.So where did you get the narrative that we have switched from global warming to ‘a potentially dangerous cooling’
That was nowhere in the video you posted
It is a regional affect, not global.0 -
So where did you get the narrative that we have switched from global warming to ‘a potentially dangerous cooling’
That was nowhere in the video you posted
Pretty obvious you didn't watch the video. All options are on the table now. Only 200 years ago, the climate was in a colder state, so it isn't surprising that the climate could enter another such phase in another 200 years time.
Away from that, and assuming this long range forecast is correct, but this looks like some pretty serious temps in Antarctica forecast for the middle part of the month. Any explanation? or is this just down to 'natural variability'?
New Moon
0 -
I did watch the video
The AMOC transports heat. If the AMOC shuts down in 3 hundred years time, it won't cool the planet, it could cause the north atlantic to cool down, but that heat in the tropics won't simply disappear, it could lead to catestrophic warming in other parts of the world
People who are concerned with Climate Change are not just worried that it will get hotter, we are concerned that it destabalises existing climate systems causing mass disruption to ecology, economies and agriculture
Climate change, or Global warming, whatever you want to call it, risks destablaising climate systems all around the world, this is why it needs to be taken extremely seriously because if you think the social and economic disruption caused by Coronavirus is bad, it would be absolutely nothing compared to what we will see if we allow the planet to warm by 2c+ over preindustrial levels.
I don't know why antarctica is projected to be so cold this year. Its the middle of winter there, and weather is weather It could be 20c warmer than average the week after
You need to look at climate, not weather when talking about climate change0 -
Advertisement
-
I did watch the video
The AMOC transports heat. If the AMOC shuts down in 3 hundred years time, it won't cool the planet, it could cause the north atlantic to cool down, but that heat in the tropics won't simply disappear, it could lead to catestrophic warming in other parts of the world
People who are concerned with Climate Change are not just worried that it will get hotter, we are concerned that it destabalises existing climate systems causing mass disruption to ecology, economies and agriculture
Climate change, or Global warming, whatever you want to call it, risks destablaising climate systems all around the world, this is why it needs to be taken extremely seriously because if you think the social and economic disruption caused by Coronavirus is bad, it would be absolutely nothing compared to what we will see if we allow the planet to warm by 2c+ over preindustrial levels.
I don't know why antarctica is projected to be so cold this year. Its the middle of winter there, and weather is weather It could be 20c warmer than average the week after
You need to look at climate, not weather when talking about climate change
So what about the statement in the video that a cooling of the Atlantic could cause a 0.5-metre rise in sea level in the Atlantic basin?0 -
The cooling wouldn't cause the rise in sea levels, the shutdown of the gulf stream would cause thisA rapidly flowing Gulf Stream in effect whisks water away from the eastern U.S. seaboard. Using satellite altimetry, Ezer has found that the sea-surface elevation across the width of the Gulf Stream has a slope. On the coastal side, sea level can be 3, 4, or 5 feet lower than on the east side. When the current is stronger, the slope is steeper, aided by the Earth’s rotation. But when the Gulf Stream flow slows, that slope decreases, pushing more water up against the land, causing flooding during high tides.
West Antarctica’s glaciers and floating ice shelves are becoming increasingly unstable.
ALSO ON YALE E360
Abrupt sea level rise looms as an increasingly realistic threat. Read more.
Oceanographers say that the Gulf Stream could well slow even more in coming decades as the melting of Arctic Ocean ice and the Greenland ice sheet dump huge quantities of fresh water into the North Atlantic and disrupt longstanding ocean circulation patterns.
https://e360.yale.edu/features/flooding-hot-spots-why-seas-are-rising-faster-on-the-u.s.-east-coast#:~:text=On%20the%20coastal%20side%2C%20sea,causing%20flooding%20during%20high%20tides.0 -
I'll keep this in mind once the hurricane season gets into full swing, or the next flooding event here or in the UK, or heat event on continent, because, as we know, all these weather events will be more solid proof of 'climate change' in the eyes of the cretinous media and their loyal subjects.
I don't know why antarctica is projected to be so cold this year. Its the middle of winter there, and weather is weather It could be 20c warmer than average the week after ou need to look at climate, not weather when talking about climate changeNew Moon
0 -
Well first of all, not every hurricane, heatwave or flooding event is discussed relative to climate change, only the most extreme ones areI'll keep this in mind once the hurricane season gets into full swing, or the next flooding event here or in the UK, or heat event on continent, because, as we know, all these weather events will be more solid proof of 'climate change' in the eyes of the cretinous media and their loyal subjects.
Ironically, you're always going to be able to argue that such debates are light on evidence, because extreme events by definition, are rare, and rare events do not have the statistical data to say for certain what their base probability is. By the time the link is established fully, there is no debate anymore, or the events are so common, that they're no longer noteworthy enough to become the topic of a thread on this forum
When I was growing up, temperatures of 30c were considered extreme in the UK. Now practically every single year has at least one event where temperatures in the SE UK breaches 30c
Temperatures approaching 40c in Europe were unthinkable, now they're a normal Summer with temperatures reaching close to 40c in Europe only a few weeks ago barely deserving mention in the media
https://www.severe-weather.eu/mcd/extreme-heat-greece-turkey-mk/
Patterns of Hurricane behaviour over time are climactic data. Given that there might only be a few dozen hurricanes and typhoons a year, and maybe only a a handful of major storms, it gives each one much more climactic significance
Unprecedented weather or extremely rare weather events are evidence of climate change if they are part of a larger trend. Slightly cooler than the recent average temperatures in a cherry picked part of the world is just normal weather fluctuation
Any hurricane is an extreme weather event but many of the hurricanes in the past decade or two have been notably different, either in their power or their behaviour (higher, wetter, bigger, stalling for days etc)0 -
I don't think that statement about hurricanes recently is particularly supported by actual evidence. Some of the most damaging hurricane impacts are well back in the past. I could mention the Galveston hurricane of 1900 and two intense hurricanes that hit Florida in the 1920s as evidence that if anything the actual trend is slightly in the opposite direction, but personally I find it steady-state although cyclical in nature.
The 1980s were generally a decade of weak Atlantic hurricane development especially before 1988. So relative to that weak decade the recent past has picked up in intensity. But the 1940s and 1950s were probably just as intense as the recent decades.
If I had to name the single most prolific hurricane season, 1780 had five very damaging hurricanes in the Caribbean region. Of course we don't know what the total seasonal count was that far back with no observation of many parts of the hurricane theatre.
Harvey drenched Houston with an enormous rainfall but here again, similar things have happened in the past, they sometimes happened more over less populated areas but I don't think we can really take impacts on cities as a primary guide to inter-decadal comparisons, if something similar happened in a less populated area, it still shows that the phenomenon is recurring.
Similar analysis could be applied to typhoons and Australian, Indian Ocean and South Pacific theatres as well as the south coast of Mexico.
There was a much stronger tropical cyclone in 1970 in the Bay of Bengal than this recent one that attracted a lot of attention, IIRC the death toll from that was upwards of 200,000 people in Bangladesh and India.
I realize the theory is that slightly warmer ocean temperatures will intensify storms, but the ebb and flow of anomalies and the feedback loops where powerful storms begin to cool local areas of the sea surface come into play.
People might also want to offer up Sandy (late October 2012) as a singularity but in my research into 19th century events, I found two similar landfalling hurricanes in 1849 (Oct 6-7) and 1861 (Nov 1-3) that brought similar amounts of rain to many parts of the northeast U.S. and into the Great Lakes region. The details are different, this is what makes comparing long-term severe weather frequencies difficult, there is always going to be some detail that is unprecedented, that is the nature of severe weather events.0 -
M.T. Cranium wrote: »I don't think that statement about hurricanes recently is particularly supported by actual evidence.
Same applies for European summers, which is some what conflated by 2019. I happened to be holidaying in France when it was 43.3c. The closest I had been to that was 39.8c in Tunisia back in the 90s. I do remember 03's summer as a friend suffered heat stroke that year while in France. I wouldn't however use these experiences to determine frequencies of weather extremes.
The phenomenon of feeling weather was less extreme in the past is likely linked to our access to information at the time in comparison to today and the sensitivity to climate change today brings such events to the forefront of media. Weather at one time was local, now we have reports of every weather extreme across the global, which can mimimic the growth in extremes, when in fact just the focus of attention has moved towards reporting extreme weather events.
Pre 00s climate was not the topic du jour so it took up significantly less space in media outlet publications.
Using French records of highest recorded, if you remove 2019 as weather anomaly and not indicative of a climate pattern change, +40c has been recorded in each decade from 1900.
2019 certainly seems like an anomaly, this is not to say that average temperatures in France are not on the rise, but a previous comment about exceptionally hot summers in Europe being unheard or is not what the data suggests.
Taken from Wiki.
Temperature Location Date Recorded
44.1 °C (111.4 °F) Conqueyrac, Gard 12-Aug-03
44.1 °C (111.4 °F) Saint-Christol-lès-Alès, Gard 12-Aug-03
44 °C (111 °F) Toulouse, Haute-Garonne 8-Aug-1923
43.9 °C (111.0 °F) Entrecasteaux, Var 7-Jul-82
43.7 °C (110.7 °F) Saint-Andiol, Bouches-du-Rhône 4-Aug-03
43.7 °C (110.7 °F) Le Blanc, Indre 1-Aug-47
43.4 °C (110.1 °F) Sartène, Corse-du-Sud 23-Jul-09
43.2 °C (109.8 °F) Broût-Vernet, Allier 13-Jul-83
43.1 °C (109.6 °F) Chusclan, Gard 12-Aug-03
43.1 °C (109.6 °F) Decize, Nièvre 11-Aug-03
43 °C (109 °F) Cazals, Lot 4-Aug-03
43 °C (109 °F) Léon, Landes 30-Jun-68
42.8 °C (109.0 °F) Montpellier, Hérault 19-Jul-1904
42.7 °C (108.9 °F) Figari, Corse-du-Sud 4-Aug-17
42.7 °C (108.9 °F) Le Cannet, Alpes-Maritimes 12-Jul-82
42.6 °C (108.7 °F) Orange, Vaucluse 12-Aug-03
42.5 °C (108.5 °F) Mont-de-Marsan, Landes 1-Aug-47
42.5 °C (108.5 °F) Saint-Raphaël, Var 30-Jul-83
42.3 °C (108.1 °F) Hyères, Var 10-Jul-82
42.3 °C (108.1 °F) Montgivray, Indre 18-Aug-12
42.2 °C (108.0 °F) Le Luc, Var 5-Aug-17
42.2 °C (108.0 °F) Châteauroux, Indre 9-Aug-1923
42.1 °C (107.8 °F) Montclus, Gard 21-Aug-12
42 °C (108 °F) Paray-le-Monial, Saône-et-Loire 27-Jul-83
42 °C (108 °F) Bergerac, Dordogne 27-Jul-47
42 °C (108 °F) Bergerac, Dordogne 12-Jul-49
42 °C (108 °F) Ponte Leccia, Haute-Corse 27-Jul-98
41.8 °C (107.2 °F) Gourdon, Lot 4-Aug-03
41.8 °C (107.2 °F) Montauban, Tarn-et-Garonne 4-Aug-03
41.8 °C (107.2 °F) Figari, Corse-du-Sud 3-Aug-17
41.6 °C (106.9 °F) Carpentras, Vaucluse 26-Jul-83
41.6 °C (106.9 °F) Chaumont, Haute-Marne 28-Jul-1921
41.5 °C (106.7 °F) Châtillon-sur-Seine, Côte-d'Or 19-Aug-12
41.4 °C (106.5 °F) Angoulême, Charente 8-Aug-1923
For reference the 2019 records removed.
Temperature Location Date Recorded
46.0 °C (114.8 °F) Verargues, Hérault 28-Jun-19
45.9 °C (114.6 °F) Gallargues-le-Montueux, Gard 28-Jun-19
45.4 °C (113.7 °F) Villevieille, Gard 28-Jun-19
45.1 °C (113.2 °F) Marsillargues, Hérault 28-Jun-19
44.6 °C (112.3 °F) Saint-Chamas, Bouches-du-Rhône 28-Jun-19
44.5 °C (112.1 °F) Varages, Var 28-Jun-19
44.4 °C (111.9 °F) Nîmes, Gard 28-Jun-19
44.4 °C (111.9 °F) Peyrolles-en-Provence, Bouches-du-Rhône 28-Jun-19
44.3 °C (111.7 °F) Carpentras, Vaucluse 28-Jun-19
44.3 °C (111.7 °F) Moules-et-Baucels, Hérault 28-Jun-19
44.3 °C (111.7 °F) Vinon-sur-Verdon, Var 28-Jun-19
44.3 °C (111.7 °F) Istres, Bouches-du-Rhône 28-Jun-19
44 °C (111 °F) Montpellier airport Frejorgue, Hérault 28-Jun-19
43.9 °C (111.0 °F) Brignoles, Var 28-Jun-19
43.5 °C (110.3 °F) Uzès, Gard 28-Jun-19
43.4 °C (110.1 °F) Salon de Provence, Bouches-du-Rhône 28-Jun-19
42.8 °C (109.0 °F) Avignon, Vaucluse 28-Jun-19
42.4 °C (108.3 °F) Paris, Île-de-France 25-Jul-19
42.4 °C (108.3 °F) Perpignan, Pyrénées-Orientales 28-Jun-19
42.3 °C (108.1 °F) Grospierres, Ardèche 27-Jun-19
42.2 °C (108.0 °F) Château-Arnoux-Saint-Auban, Alpes-de-Haute-Provence 28-Jun-19
42 °C (108 °F) Aix en Provence, Bouches-du-Rhône 28-Jun-19
42 °C (108 °F) Grospierres 27-Jun-19
41.9 °C (107.4 °F) Sisteron, Alpes-de-Haute-Provence 28-Jun-19
41.9 °C (107.4 °F) Saint-Julien-de-Peyrolas, Gard 27-Jun-19
41.5 °C (106.7 °F) Aubenas, Ardèche 27-Jun-19
41.4 °C (106.5 °F) Laragne-Montéglin, Hautes Alpes 28-Jun-19
41.4 °C (106.5 °F) Digne les Bains, Alpes-de-Haute-Provence 28-Jun-19
0 -
Advertisement
-
M.T. Cranium wrote: »I don't think that statement about hurricanes recently is particularly supported by actual evidence. Some of the most damaging hurricane impacts are well back in the past. I could mention the Galveston hurricane of 1900 and two intense hurricanes that hit Florida in the 1920s as evidence that if anything the actual trend is slightly in the opposite direction, but personally I find it steady-state although cyclical in nature.
The 1980s were generally a decade of weak Atlantic hurricane development especially before 1988. So relative to that weak decade the recent past has picked up in intensity. But the 1940s and 1950s were probably just as intense as the recent decades.
If I had to name the single most prolific hurricane season, 1780 had five very damaging hurricanes in the Caribbean region. Of course we don't know what the total seasonal count was that far back with no observation of many parts of the hurricane theatre.
Harvey drenched Houston with an enormous rainfall but here again, similar things have happened in the past, they sometimes happened more over less populated areas but I don't think we can really take impacts on cities as a primary guide to inter-decadal comparisons, if something similar happened in a less populated area, it still shows that the phenomenon is recurring.
Similar analysis could be applied to typhoons and Australian, Indian Ocean and South Pacific theatres as well as the south coast of Mexico.
There was a much stronger tropical cyclone in 1970 in the Bay of Bengal than this recent one that attracted a lot of attention, IIRC the death toll from that was upwards of 200,000 people in Bangladesh and India.
I realize the theory is that slightly warmer ocean temperatures will intensify storms, but the ebb and flow of anomalies and the feedback loops where powerful storms begin to cool local areas of the sea surface come into play.
People might also want to offer up Sandy (late October 2012) as a singularity but in my research into 19th century events, I found two similar landfalling hurricanes in 1849 (Oct 6-7) and 1861 (Nov 1-3) that brought similar amounts of rain to many parts of the northeast U.S. and into the Great Lakes region. The details are different, this is what makes comparing long-term severe weather frequencies difficult, there is always going to be some detail that is unprecedented, that is the nature of severe weather events.
The most recent studies have found a satistically significant increasing trend in the number of major storms over the past 4 decades, now, you might not think 4 decades is long enough to come to a conclusion, but we're stuck with the data that we have, previous records are too heterogenious to properly compare using observed records.
If you look at cyclone activity globally rather than focusing on individual regions where there may be more natural cycles in play, you can smooth out these cycles to get a better overall view on how climate change is affecting global tropical cyclone activity.
You can hypothesise that in the 1700s there were more powerful storms but there will always be once in a century storms, often even several of those storms in the same century due to the way probabilty works. The problem is that climate change models predict that there may be fewer hurricanes overall, but that there will be more major hurricanes, and that those hurricanes will cause increased flooding due to warmer oceans feeding them and warmer air allowing them to hold more moisture
We have model based predictions, and we can compare those predictions to the actual outcomes that we are observing, and the evidence is mounting that there is a statistically significant rise in the number of severe storms globally
I've posted a study below, the conclusions of the researchers are that there was a recent decadal increase of 8% in the number of major storms globallyTheoretical understanding of the thermodynamic controls on tropical cyclone (TC) wind intensity, as well as numerical simulations, implies a positive trend in TC intensity in a warming world. The global instrumental record of TC intensity, however, is known to be heterogeneous in both space and time and is generally unsuitable for global trend analysis. To address this, a homogenized data record based on satellite data was previously created for the period 1982–2009. The 28-y homogenized record exhibited increasing global TC intensity trends, but they were not statistically significant at the 95% confidence level. Based on observed trends in the thermodynamic mean state of the tropical environment during this period, however, it was argued that the 28-y period was likely close to, but shorter than, the time required for a statistically significant positive global TC intensity trend to appear. Here the homogenized global TC intensity record is extended to the 39-y period 1979–2017, and statistically significant (at the 95% confidence level) increases are identified. Increases and trends are found in the exceedance probability and proportion of major (Saffir−Simpson categories 3 to 5) TC intensities, which is consistent with expectations based on theoretical understanding and trends identified in numerical simulations in warming scenarios. Major TCs pose, by far, the greatest threat to lives and property. Between the early and latter halves of the time period, the major TC exceedance probability increases by about 8% per decade, with a 95% CI of 2 to 15% per decade.
https://www.pnas.org/content/117/22/11975
Every year that passes will give us more data to add to the statistical significance of these trends but we cannot wait until there is absolutely no uncertainty because 1. that will never happen, and 2, by that time it will be much too late to delay or reverse the worst impacts of climate change0 -
But your table doesn't show thisUsing French records of highest recorded, if you remove 2019 as weather anomaly and not indicative of a climate pattern change, +40c has been recorded in each decade from 1900.
2019 certainly seems like an anomaly, this is not to say that average temperatures in France are not on the rise, but a previous comment about exceptionally hot summers in Europe being unheard or is not what the data suggests.
Taken from Wiki.
There was no 40+ years in the 1910s,1930s, 1950s, or 1970s, the frequency of such heatwaves was closer to once every 20 years, and the heatwaves were not widespread or long lasting
In fact, it shows that over the past 119 years, there have been 14 years when temperatures exceeded 40c and 5 of those occured in the past 20 years
20 is 16% of 120, so in 16% of the years, there were 35% of the years surpassing 40c
Here's a graph of those data showing how often per decade this 40c barrier was breached,In the 2010s 3 years broke that record, I suggest that the 2020s will likely see at least 50% of years record temp
0 -
The most recent studies have found a satistically significant increasing trend in the number of major storms over the past 4 decades, now, you might not think 4 decades is long enough to come to a conclusion, but we're stuck with the data that we have, previous records are too heterogenious to properly compare using observed records.
If you look at cyclone activity globally rather than focusing on individual regions where there may be more natural cycles in play, you can smooth out these cycles to get a better overall view on how climate change is affecting global tropical cyclone activity.
You can hypothesise that in the 1700s there were more powerful storms but there will always be once in a century storms, often even several of those storms in the same century due to the way probabilty works. The problem is that climate change models predict that there may be fewer hurricanes overall, but that there will be more major hurricanes, and that those hurricanes will cause increased flooding due to warmer oceans feeding them and warmer air allowing them to hold more moisture
We have model based predictions, and we can compare those predictions to the actual outcomes that we are observing, and the evidence is mounting that there is a statistically significant rise in the number of severe storms globally
I've posted a study below, the conclusions of the researchers are that there was a recent decadal increase of 8% in the number of major storms globally
Every year that passes will give us more data to add to the statistical significance of these trends but we cannot wait until there is absolutely no uncertainty because 1. that will never happen, and 2, by that time it will be much too late to delay or reverse the worst impacts of climate change
But in a warming world, where global ocean heat content is supposed to be increasing, why are we seeing no statistically significant increase in global ACE? Regional variability aside, the overall global trend should be increasing. A higher number of stronger, more powerful and longer-lasting storms should show a much more significant trend than just 0.4 (about 0.05%) per annum, given that ACE is related to max wind squared. Where's all that extra energy gone?
http://tropical.atmos.colostate.edu/Realtime/index.php?arch&loc=global 0
0 -
Interesting to note that the global ACE is closely aligned to the solarcycle, hmmmm?0
-
Gaoth Laidir wrote: »But in a warming world, where global ocean heat content is supposed to be increasing, why are we seeing no statistically significant increase in global ACE? Regional variability aside, the overall global trend should be increasing. A higher number of stronger, more powerful and longer-lasting storms should show a much more significant trend than just 0.4 (about 0.05%) per annum, given that ACE is related to max wind squared. Where's all that extra energy gone?
http://tropical.atmos.colostate.edu/Realtime/index.php?arch&loc=global
ACE is a crude measurement that only looks at wind speed and duration. It doesn’t account for the size of the storm. There is evidence that storms are getting bigger and more destructive
A Cat 5 hurricane like IRMA with a diameter of about 640km was bigger than most Cat5 hurricanes but only half the diameter of Sandy (1400km)
Sandy had a much lower ACE (I can’t even find it easily because it’s so unremarkable)
That One of the most destructive storms on record barely ranked on the ACE rating system shows that it is clearly missing some important parameters
The study I linked to used satellite photos to include the size of all global tropical cyclones in their calculations. There are also multiple other studies that measure the destructiveness of storms using different methodologies that conclude that storms have been getting worse as the planet warms0 -
Advertisement
-
ACE is a crude measurement that only looks at wind speed and duration. It doesn’t account for the size of the storm. There is evidence that storms are getting bigger and more destructive
A Cat 5 hurricane like IRMA with a diameter of about 640km was bigger than most Cat5 hurricanes but only half the diameter of Sandy (1400km)
Sandy had a much lower ACE (I can’t even find it easily because it’s so unremarkable)
That One of the most destructive storms on record barely ranked on the ACE rating system shows that it is clearly missing some important parameters
The study I linked to used satellite photos to include the size of all global tropical cyclones in their calculations. There are also multiple other studies that measure the destructiveness of storms using different methodologies that conclude that storms have been getting worse as the planet warms
The theory stated in the article you posted relates storm intensity to a warming world. So what do they mean by intensity? Have the goalposts now shifted and intensity no longer refers to max winds and minimum pressure and storm longevity (something you're quick to quote when these numbers become interesting, e.g. in the case of Patricia)? It's now moved on to not so much how hard she blows but rather where she blows? The real estate of the landfall point is now a factor? Had Sandy not made landfall where it did we would not be talking about it. It briefly reached Cat 3 earlier on and was barely a Cat 1 when it did hit, so all the damage was done by the storm surge. As MT has shown, this is not the first time this area has been hit by such storms, but when you put 100 million people (more importantly, Americans) in the way then everything stops and the media frenzy starts.
The actual number of Atlantic Cat 3+ storms in the past 40 years shows a meagre rise of around 0.5 storms per decade, or an increase of just +1.5 storm days per decade. This is in the most sensitive basin in the world. In the NW Pacific the trend is even less pronounced (+0.2 storms and +0.8 days per decade), despite a rise of around 0.7 °C in 0-100 m water heat content there. Yet we are to believe that there are clear and unequivocal signs of destructive increases in this basin, home to hundreds of millions of vulnerable populations, but the data don't reflect this.
Storm size is one thing, but even that study said that it couldn't find a trend in a 28-year dataset and had to extend out to 39 years (cherrypicking, as you say?) to find one. This is exactly of the same magnitude of the natural variability of the system (AMO, etc.), to which the Atlantic storm activity and that of other basins are primarily linked.
ACE is one of the prime measurements used by the NHC and other bodies in classifying individual storms and seasons. Just because it is not showing any appreciable trend is not a reason to discard it. If indivicual storms really are becoming stronger then ACE should be showing it. Size doesn't matter.0 -
Gaoth Laidir wrote: »The theory stated in the article you posted relates storm intensity to a warming world. So what do they mean by intensity? Have the goalposts now shifted and intensity no longer refers to max winds and minimum pressure and storm longevity (something you're quick to quote when these numbers become interesting, e.g. in the case of Patricia)? It's now moved on to not so much how hard she blows but rather where she blows? The real estate of the landfall point is now a factor? Had Sandy not made landfall where it did we would not be talking about it. It briefly reached Cat 3 earlier on and was barely a Cat 1 when it did hit, so all the damage was done by the storm surge. As MT has shown, this is not the first time this area has been hit by such storms, but when you put 100 million people (more importantly, Americans) in the way then everything stops and the media frenzy starts.
The actual number of Atlantic Cat 3+ storms in the past 40 years shows a meagre rise of around 0.5 storms per decade, or an increase of just +1.5 storm days per decade. This is in the most sensitive basin in the world. In the NW Pacific the trend is even less pronounced (+0.2 storms and +0.8 days per decade), despite a rise of around 0.7 °C in 0-100 m water heat content there. Yet we are to believe that there are clear and unequivocal signs of destructive increases in this basin, home to hundreds of millions of vulnerable populations, but the data don't reflect this.
Storm size is one thing, but even that study said that it couldn't find a trend in a 28-year dataset and had to extend out to 39 years (cherrypicking, as you say?) to find one. This is exactly of the same magnitude of the natural variability of the system (AMO, etc.), to which the Atlantic storm activity and that of other basins are primarily linked.
ACE is one of the prime measurements used by the NHC and other bodies in classifying individual storms and seasons. Just because it is not showing any appreciable trend is not a reason to discard it. If indivicual storms really are becoming stronger then ACE should be showing it. Size doesn't matter.
The study did find a trend in the original 28 year dataset, but the dataset was too small to give it statistical significance at the 95% confidence interval. Extending the dataset didn't change the trend they found earlier, it gave them enough data to say that it is a signal and not just noise.
Size absolutely does matter when it comes to the destructive power of storms. the size of the windfield affects the storm surge and the larger the wind field the more energy there is in the storm system, the longer that storm will affect each place it hits, while hitting more places the size can affect how much wind and rain damage it can cause as it can take longer for the storm to overpass or dissapate
ACE only measures 2 things, peak wind speed, and duration
It has its uses because it can be extended back further in time to before we had good satelilite measurements to record the size and pressure of the storm system, and because the calculations are much easier to make
There is a better more comprehensive measurement called Integrated Kinetic Energy (IKE) which takes the ACE measurements and expands on it with zonal wind speed calculations it can also calculate the storm surge potentia for each storm as it reaches landfall
https://www.aoml.noaa.gov/hrd/ike/Calculator_AllQuad.php
But it is limited to the power of a storm at landfall rather than the power of all storms in a basin, or globally over a season
Track Integrated Kinetic Energy builds further on that system to include the storm along it's whole track from when it becomes a tropical cycone rather than just at the point it makes landfall but there don't seem to be enough scientists working on building the data to properly analyse historical annual or decadal trends using these metrics0 -
The study did find a trend in the original 28 year dataset, but the dataset was too small to give it statistical significance at the 95% confidence interval. Extending the dataset didn't change the trend they found earlier, it gave them enough data to say that it is a signal and not just noise.
I haven't read the whole paper as I'm not going to pay for it. Maybe you have read it all. In any case, the trend is almost indiscernable compared to other measurable parameters.Size absolutely does matter when it comes to the destructive power of storms. the size of the windfield affects the storm surge and the larger the wind field the more energy there is in the storm system, the longer that storm will affect each place it hits, while hitting more places the size can affect how much wind and rain damage it can cause as it can take longer for the storm to overpass or dissapate
ACE only measures 2 things, peak wind speed, and duration
It has its uses because it can be extended back further in time to before we had good satelilite measurements to record the size and pressure of the storm system, and because the calculations are much easier to make
There is a better more comprehensive measurement called Integrated Kinetic Energy (IKE) which takes the ACE measurements and expands on it with zonal wind speed calculations it can also calculate the storm surge potentia for each storm as it reaches landfall
https://www.aoml.noaa.gov/hrd/ike/Calculator_AllQuad.php
But it is limited to the power of a storm at landfall rather than the power of all storms in a basin, or globally over a season
Track Integrated Kinetic Energy builds further on that system to include the storm along it's whole track from when it becomes a tropical cycone rather than just at the point it makes landfall but there don't seem to be enough scientists working on building the data to properly analyse historical annual or decadal trends using these metrics
Exactly, so the argument above is purely theoretical at this point. Whatever about the lack of observational evidence of a trend in IKE, the meagre ACE and severe storm number trends do not justify the mass frenzy we see during hurricane season. There are many more powerful natural drivers of the variation we see, but much of the general population and media know nothing about them and even less about what happened before the age of instant shares on social media.
Going by your logic, a larger more powerful storm taking longer to wind down should mean that its winds remain higher for longer, adding to its ACE value. We aren't seeing this. Then the question is if larger storms have lower max windspeeds overall, which would explain the lack of increase in ACE, given that it's a square relationship to windspeed. But we're constantly being led to believe that no, these storms are getting higher and higher max windspeeds (I reference again Patricia, for example, or Haiyan). The most active decade on record was the NW Pacific in the 1960s, with the record 39 storms in 1964 and 11 supertyphoons in 1965. No year has come close since. This is quite a trend for the most active basin on the planet.0 -
Ireland has a permanent maritime climate so all the money and effort of Irish society isn't going to change what is permanent
Cut emissions for cleaner air but anything else and people become nuisance cheerleaders for what effectively is the mindnumbing notion of human control of planetary temperatures.
Planetary climate on a solar system scale is determined by a spectrum where each planet's climate, including the Earth's, exists within that spectrum.0 -
The study did find a trend in the original 28 year dataset, but the dataset was too small to give it statistical significance at the 95% confidence interval. Extending the dataset didn't change the trend they found earlier, it gave them enough data to say that it is a signal and not just noise.
Thank you for stating that a 28-year dataset is not enough. And, also - thank you for stating the highlighted piece above.0 -
Thank you for stating that a 28-year dataset is not enough. And, also - thank you for stating the highlighted piece above.
It depends on what you're measuring whether 28 years is enough data to achieve 95% confidence
Storm seasons have large natural variability and few datapoints for each season
I'm glad you agree with the conclusions of that study, that storms have been getting stronger by about 8% a decade
Not that it is good news, but accepting the science is a necessary step towards focusing on the solutions to the problem0 -
I remember reading a Discovery magasine article in 1983 before computer modeling surfaced in any meaningful way. One of the articles came from a nobel prize winner who was witnessing the evolution of mathematical involvement in physical sciences.
"A Langrangian is not a physical thing;it is a mathematical thing - a
kind of differential equation to be exact.But physics and maths are so
closely connected these days that it is hard to separate the numbers
from the things they describe.In fact,a month after [Philip]
Morrison's remarks,Nobel Prize winner Burton Richter of the Stanford
Linear Accelerator Center said something that eerily echoed it: "
Mathematics is a language that is used to describe nature" he said
"But the theorists are beginning to think it is nature.To them the
Langrangians are the reality " Discover Magazine ,1983
I know that all the timekeeping conclusions (clockwork solar system) inherited from the late 17th century are bogus so experimental theorists didn't have to include interpretation in their models where cause and effect are present but recently they only affirm what Richter knew back in the early 1980's.
"However, this set of partial differential equations is so complex that there is no known exact solution to them (except in a few simple cases). It remains one of the great mathematical challenges (and there is a one million dollar prize awaiting whoever manages to prove a solution always exists). Instead, these equations are solved “numerically” in the model, which means they are approximated." Climate change modeling
https://www.carbonbrief.org/qa-how-do-climate-models-work
I feel sorry for my fellow human beings who are mostly decent but are stuck in a self-inflicted labyrinth of mathematical modeling and the hot air it generates. In this respect, I have not seen anyone who experiences the horror of modeling using timekeeping and a wayward RA/Dec framework when it comes to planetary temperatures in terms of cause and effect .
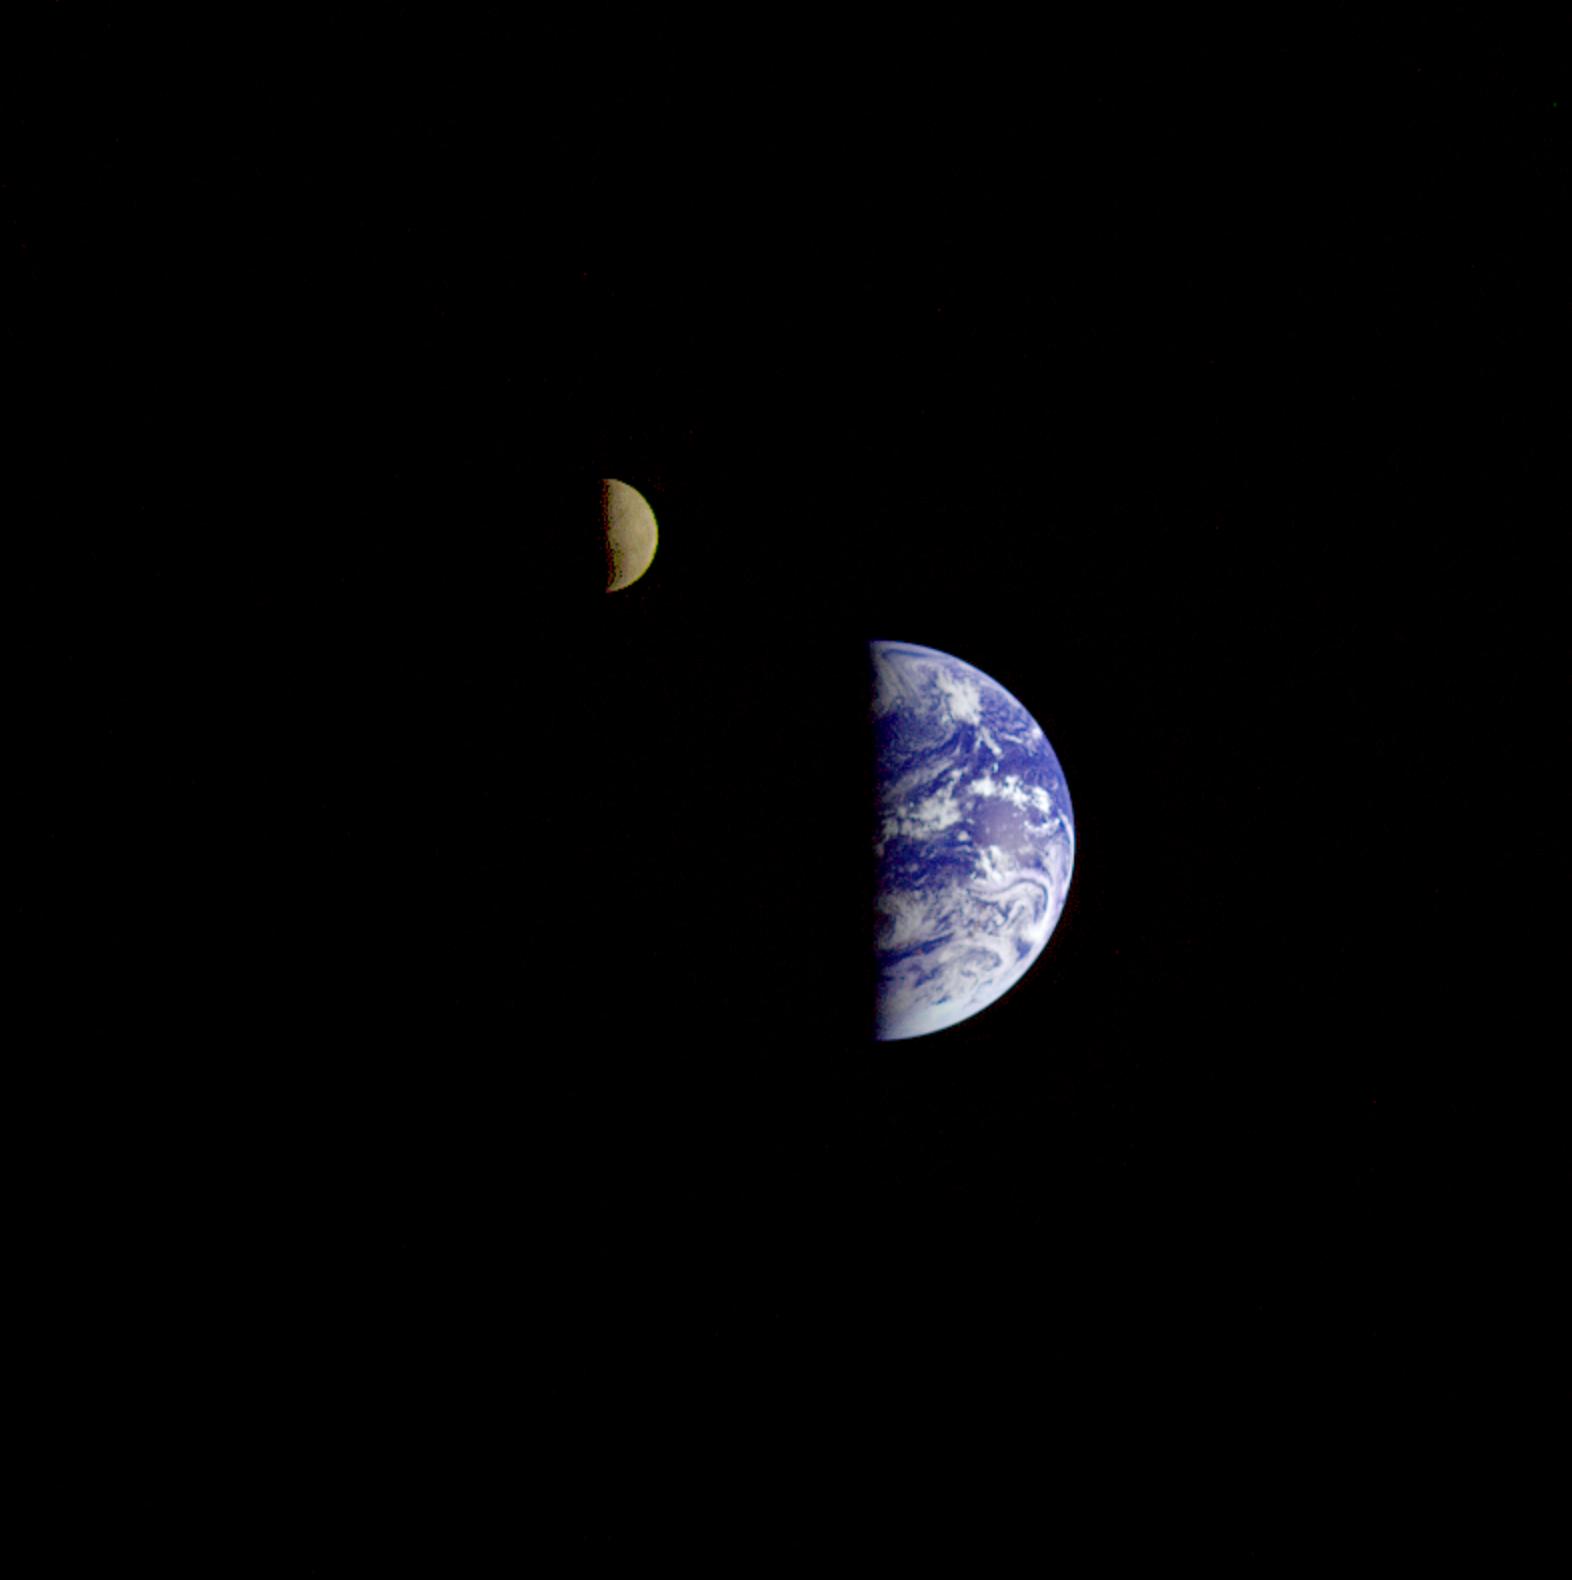
https://apod.nasa.gov/apod/ap170319.html
My goodness !, what did humanity do to make people manipulate imaging to suit an awful RA/Dec conclusion and from there on to even worse convictions.0 -
I dont see what the big deal is with record hot temperatures in Siberia recently...the sun its at its strongest right now and Siberia is a huge mass of land...warm air moves from the south to northern areas in summertime like it has always done the hot air has to go somewhere...
Im sure there are places that are colder than normal right now just like when we get fine weather in ireland they get our usual weather in spain and they get floods...This is the way it has always been it used to be called weather...nowadays as with everything its a crisis...0 -
It's weather, https://www.heraldnet.com/news/alaskas-top-temp-is-100-degrees-set-in-1915/I dont see what the big deal is with record hot temperatures in Siberia recently...the sun its at its strongest right now and Siberia is a huge mass of land...warm air moves from the south to northern areas in summertime like it has always done the hot air has to go somewhere...
Im sure there are places that are colder than normal right now just like when we get fine weather in ireland they get our usual weather in spain and they get floods...This is the way it has always been it used to be called weather...nowadays as with everything its a crisis...
Sometimes it just pushes cold or warm air where it usually doesn't go.FAIRBANKS, Alaska — If you think this summer’s heat wave is hot, just be glad you weren’t around in 1915.
The highest temperature ever recorded in Alaska was 100 degrees on June 27, 1915, in Fort Yukon, according to official records of the National Weather Service. Records date back to 1904.
The highest reliable temperature in Alaska’s second-largest city was 96 degrees on June 15, 1969, the Fairbanks Daily News-Miner reported.
“There’s no reason to doubt that,” said National Weather Service meteorologist Rick Thoman. “It was in the mid 90s at other Interior Alaska weather stations that day and there were thundershowers around.”
There is a recording of 99 degrees in Fairbanks on July 28, 1919, but weather officials doubt the accuracy of that reading since there were no other temperatures from nearby cities that high.0 -
I have been adding the NYC monthly data to my Toronto data study, the more extreme values are already posted in the thread. There seems to be a good correlation in monthly rankings although there's a small subset of months where NYC runs considerably warmer (relative to normal) as the storm track takes a position between the two locations.
But probably 80% of the months are within a few ranks of each other in the two data sets and quite a few of the top fives are the same, if maybe in scrambled order.
What jumped out at me was the fact that Dec 2015 was even more anomalously warm for NYC than for the CET or Toronto. It is the warmest December at all three locations and by a wide margin, but in the case of NYC it was almost five C deg warmer than the previous max. This points to a process that we don't fully understand yet, whether human activity is a large factor or not, a sudden and not very prolonged burst of extreme warmth that is not obviously related to the solar cycle. In North America two other such bursts of extreme heat were noted in September 1881 and July 1936 but neither of these showed up in Europe.
The weather patterns in Dec 2015 suggest that the source of the anomalous warmth was the Gulf of Mexico as there was no evidence of Pacific warmth intruding in either Nov or Dec 2015 (for example PHX was below normal both of those months, but Houston TX had extreme warmth early in Dec 2015). This extreme warming event cannot be easily explained as an AGW phenomenon as it has not happened on the same scale again. It came towards the end of a rather weak solar cycle peak, so I don't think we can say a hyperactive Sun had much to do with it either.
For whatever reason the Gulf of Mexico shed a lot of anomalous heat in Nov-Dec 2015. This sparked a general release of subtropical heat all the way from the south central U.S. to Britain and Ireland in the path of the Gulf stream. The month was 7 to 8 C deg above normal in many places, including Norfolk VA where it was 28 C on Christmas Day.
If we have future events like this on a more regular basis, it is going to send extreme warmth into higher latitudes because each time it happens there will be a tendency for storm tracks to shift further north.
I think in my own subconscious, this event (which I noticed at the time in the sort of chaos of my day to day weather forum activity which is probably too much for real concentration on research, with the forecasts and contests that I manage) is probably part of the foundation for my thinking that prolonged natural warming seems inevitable and if this has been produced entirely or largely by human activity then I can't really see how anything we do now would reverse the tendency. The best we can hope to achieve is a slowdown of the greenhouse gas increase.
I don't actually think this Dec 2015 is a manifestation of human activity. I think maybe there is enough of a long lag in the inter-glacial peak of warming that we are entering that peak warmth period now, even if Milankovitch drivers are backing off slightly -- every other natural cycle has a lag built in, so it would not surprise me if responses to Milankovitch cycles have a lag -- the conservative nature of ocean temperature is the main reason for this.
Looking through the three data sets to try to identify perhaps one other similar event. Summer 1911 seems to have some similar correlations. It was also very warm in the same large area in the summer of 1955.
The amount by which previous records were broken in Dec 2015 is, however, unprecedented in all data sets. Having lived through a new record warm December back in 1982, that one only edged out the previous record by a small margin (and failed to do so at NYC with no warm signal in Europe at all); since then several Decembers have been warmer. In general, December and February seem to be the most warmed of all the months in the North American data. I suppose this is part of the phenomenon of shorter winter seasons, not as impactful on January (yet).0 -
Advertisement
-
Seems to be an awful lot of ancient permafrost melting then burning globally, strange that it lasted so long seeing as its just normal weather, nothing to see here I suppose.0
-
One perspective on that is the LIA riding on the backs of three long solar downturns (Sporer and Maunder, even through the Dalton minimum) cut into a trend that was establishing itself in the MWP and the modern warming is just the return to the normal slight warming trend that the MWP represented vs the climate of the first millennium.
Thus we are only now seeing any increase over the MWP and to be perfectly honest nobody knows what climate conditions might have prevailed in these arctic permafrost regions in the MWP.
There are times in the Neolithic when more open seas existed at high latitudes and Atlantic whale populations sustained a human hunting population in the high arctic of present-day Nunavut, Canada. That population had to retreat several times when their whale harvesting became impossible due to climate change.
AGW proponents explain that as a function of better Milankovitch drivers in play that far back.
I see a compromise being possible that allows for some of all these perspectives but with the underlying theme of inevitable warming. Inevitable warming requires a different political response from either intervention (won't work) or denial (can't be justified).0 -
What do you mean "the sun is at it's strongest now"I dont see what the big deal is with record hot temperatures in Siberia recently...the sun its at its strongest right now and Siberia is a huge mass of land...warm air moves from the south to northern areas in summertime like it has always done the hot air has to go somewhere...
Im sure there are places that are colder than normal right now just like when we get fine weather in ireland they get our usual weather in spain and they get floods...This is the way it has always been it used to be called weather...nowadays as with everything its a crisis...
Do you just mean Summer in the Northern Hemisphere? Which happens every year? So couldn' really account for record warmth this particular year?
Did you know that the sun is approaching a 'Grand Solar Minimum' where it is at it's lowest output over multiple solar cycles?
So rather than the sun being at it's strongest, it's actually weaker than it has been for centuries0 -
M.T. Cranium wrote: »I have been adding the NYC monthly data to my Toronto data study, the more extreme values are already posted in the thread. There seems to be a good correlation in monthly rankings although there's a small subset of months where NYC runs considerably warmer (relative to normal) as the storm track takes a position between the two locations.
But probably 80% of the months are within a few ranks of each other in the two data sets and quite a few of the top fives are the same, if maybe in scrambled order.
What jumped out at me was the fact that Dec 2015 was even more anomalously warm for NYC than for the CET or Toronto. It is the warmest December at all three locations and by a wide margin, but in the case of NYC it was almost five C deg warmer than the previous max. This points to a process that we don't fully understand yet, whether human activity is a large factor or not, a sudden and not very prolonged burst of extreme warmth that is not obviously related to the solar cycle. In North America two other such bursts of extreme heat were noted in September 1881 and July 1936 but neither of these showed up in Europe.
The weather patterns in Dec 2015 suggest that the source of the anomalous warmth was the Gulf of Mexico as there was no evidence of Pacific warmth intruding in either Nov or Dec 2015 (for example PHX was below normal both of those months, but Houston TX had extreme warmth early in Dec 2015). This extreme warming event cannot be easily explained as an AGW phenomenon as it has not happened on the same scale again. It came towards the end of a rather weak solar cycle peak, so I don't think we can say a hyperactive Sun had much to do with it either.
For whatever reason the Gulf of Mexico shed a lot of anomalous heat in Nov-Dec 2015. This sparked a general release of subtropical heat all the way from the south central U.S. to Britain and Ireland in the path of the Gulf stream. The month was 7 to 8 C deg above normal in many places, including Norfolk VA where it was 28 C on Christmas Day.
If we have future events like this on a more regular basis, it is going to send extreme warmth into higher latitudes because each time it happens there will be a tendency for storm tracks to shift further north.
I think in my own subconscious, this event (which I noticed at the time in the sort of chaos of my day to day weather forum activity which is probably too much for real concentration on research, with the forecasts and contests that I manage) is probably part of the foundation for my thinking that prolonged natural warming seems inevitable and if this has been produced entirely or largely by human activity then I can't really see how anything we do now would reverse the tendency. The best we can hope to achieve is a slowdown of the greenhouse gas increase.
I don't actually think this Dec 2015 is a manifestation of human activity. I think maybe there is enough of a long lag in the inter-glacial peak of warming that we are entering that peak warmth period now, even if Milankovitch drivers are backing off slightly -- every other natural cycle has a lag built in, so it would not surprise me if responses to Milankovitch cycles have a lag -- the conservative nature of ocean temperature is the main reason for this.
Looking through the three data sets to try to identify perhaps one other similar event. Summer 1911 seems to have some similar correlations. It was also very warm in the same large area in the summer of 1955.
The amount by which previous records were broken in Dec 2015 is, however, unprecedented in all data sets. Having lived through a new record warm December back in 1982, that one only edged out the previous record by a small margin (and failed to do so at NYC with no warm signal in Europe at all); since then several Decembers have been warmer. In general, December and February seem to be the most warmed of all the months in the North American data. I suppose this is part of the phenomenon of shorter winter seasons, not as impactful on January (yet).
Arctic amplification and the increasingly meandering jet stream explain what you have observed
Jennifer Francis explains why in the talk below
0 -
M.T. Cranium wrote: »One perspective on that is the LIA riding on the backs of three long solar downturns (Sporer and Maunder, even through the Dalton minimum) cut into a trend that was establishing itself in the MWP and the modern warming is just the return to the normal slight warming trend that the MWP represented vs the climate of the first millennium.
Thus we are only now seeing any increase over the MWP and to be perfectly honest nobody knows what climate conditions might have prevailed in these arctic permafrost regions in the MWP.
There are times in the Neolithic when more open seas existed at high latitudes and Atlantic whale populations sustained a human hunting population in the high arctic of present-day Nunavut, Canada. That population had to retreat several times when their whale harvesting became impossible due to climate change.
AGW proponents explain that as a function of better Milankovitch drivers in play that far back.
I see a compromise being possible that allows for some of all these perspectives but with the underlying theme of inevitable warming. Inevitable warming requires a different political response from either intervention (won't work) or denial (can't be justified).
What is driving this 'inevitable warming'. The word 'natural' doesn't cut it, the warming needs to have a cause, what is the cause of the current 'natural warming'
We are moving out of an interglacial cycle and into one where the polar ice caps are no longer going to be a permanent feature of our global climate.
It's not a slow natural increase, it's a rapid decline over a few decades, in geological timescales, it's very much a sudden change that only ever happens in nature when there is a very obvious cause (massive geological activity, astroid impact etc)0 -
What do you mean "the sun is at it's strongest now"
Do you just mean Summer in the Northern Hemisphere? Which happens every year? So couldn' really account for record warmth this particular year?
Did you know that the sun is approaching a 'Grand Solar Minimum' where it is at it's lowest output over multiple solar cycles?
So rather than the sun being at it's strongest, it's actually weaker than it has been for centuries
It is a surface rotation that has been going on for as long as the Earth has been traveling around the Sun and isolated at the North and South polar latitudes like a beacon.
The distance Ireland travels from when it exits the circle of illumination (sunrise) and crosses the area in constant illumination until it re-enters the circle of illumination (sunset) is at its maximum on the June Solstice hence 'Sun at its strongest'.
The distance between sunrise and noon is always symmetrical from noon to sunset regardless of latitude so this seasonal heating and cooling fluctuations towards and away from the polar latitudes are naturally referenced to the Equator.
https://www.youtube.com/watch?v=xvbV9llG5L8
In astronomy and Earth sciences, the priority is observations-interpretations-conclusions unlike mathematical modelers who conjure up observations-experiments-predictions and try to pass predictions off as facts.0 -
It is a surface rotation that has been going on for as long as the Earth has been traveling around the Sun and isolated at the North and South polar latitudes like a beacon.
The distance Ireland travels from when it exits the circle of illumination (sunrise) and crosses the area in constant illumination until it re-enters the circle of illumination (sunset) is at its maximum on the June Solstice hence 'Sun at its strongest'.
The distance between sunrise and noon is always symmetrical from noon to sunset regardless of latitude so this seasonal heating and cooling fluctuations towards and away from the polar latitudes are naturally referenced to the Equator.
https://www.youtube.com/watch?v=xvbV9llG5L8
In astronomy and Earth sciences, the priority is observations-interpretations-conclusions unlike mathematical modelers who conjure up observations-experiments-predictions and try to pass predictions off as facts.
ooookaaay
I know what the summer solstice is, it happens every year, so it doesn't explain why this particular year is seeing such unprecedented temperatures with places in Siberia reaching 38c0 -
ooookaaay
I know what the summer solstice is, it happens every year, so it doesn't explain why this particular year is seeing such unprecedented temperatures with places in Siberia reaching 38c
The accurate recording of temps in the likes of Siberia goes back barely 100 years, so your assumptions on the matter count for little:rolleyes:0 -
ooookaaay
I know what the summer solstice is
I know modelers who suggest that the Sun is directly shining on one of the tropic latitudes on the Solstice as part of a description which involves the planet's circle of illumination tilting back and forth off the equator -
https://apod.nasa.gov/apod/ap170319.html
That is to make the scheme of incidental radiation work between winter and summer in distinct hemispheres using a perception that the Sun wanders up and down off a planet with a zero degree inclination -
https://qph.fs.quoracdn.net/main-qimg-15ff25f1aeb918cab9c6a7e72e61b008.webp
It is comical to say the least but no more so than any other concept thrown at planetary temperature fluctuations. The reason planetary temperatures fluctuate towards either poles at different times and places in the Earth's orbital position is far more interesting.
https://www.youtube.com/watch?v=xvbV9llG5L8&t=10s
The idea here is that the longer a location spends in solar radiation as it rotates across the fully illuminated face from the time it exits the circle of illumination until the time it re-enters it. This treatment has a more global or planetary feel to it rather than the exclusive hemispherical treatments presently in operation.0 -
Advertisement
-
-
That video I posted a while back explained how the decrease in pollutants & aerosols has caused the Arctic region to warm and sea ice to decrease even more than it was already doing since the 'lockdown' began.ooookaaay
I know what the summer solstice is, it happens every year, so it doesn't explain why this particular year is seeing such unprecedented temperatures with places in Siberia reaching 38cNew Moon
0 -
That video I posted a while back explained how the decrease in pollutants & aerosols has caused the Arctic region to warm and sea ice to decrease even more than it was already doing since the 'lockdown' began.
Even if that is the explanation it’s terrible news that human particulate atmospheric pollution is masking some of the effects of anthropogenic global warming. It means the underlying warming is worse than we have already measured0 -
When permafrost stops being perma or frosty, you don’t need thermometers to tell you that it’s not normal
Actually it ebbs and flows - which is why the likes of Wooly Mammoths etc. got stuck in it thousands of years ago, which again suggests nothing we see in the region currently is out of the ordinary0 -
The heat wave in Siberia this year is being caused by a massive blocking high in the upper atmosphere. One could argue that this is a random variation that would occur somewhere in the hemisphere most years and just happened to pick Siberia this year. I don't take that approach but believing there would be a cause and effect is not enough to have the actual cause pop out of the shadows.
The AGW lobby will say it's because of greenhouse gases but then that begs the question, why this year, as with the warm spike I mentioned in December 2015. By the way, maps more or less contradict the "explanation" that was offered, there was no random meandering of jet streams but a well-organized northward shift of the subtropical jet from central North America to central Europe which is one third of the hemisphere. I don't see any of the sorts of patterns these AGW proponents tell us we are to expect, but just amplified versions of patterns I've seen many times before. The warmth in December 1982 was similar but not quite as amplified.
My own theory is that after several centuries of negative forcing from various external drivers (principally lower solar constant) the past 120-140 years have seen a generally positive forcing, and certainly human influences play a role in that. But even without us around, I suspect it would be a fairly robust warming trend. We are back to the oscillating peak of the inter-glacial warming and there could be step functions involved in that. Just as melting snow packs creates step function increases in temperatures in the subarctic from March to May, the larger scale changes in climate can do the same thing, I believe, so this is partly why we are seeing "unprecedented" warmth at times. Not sure if it is that unprecedented or just a return to warming that might have occurred several other times in this inter-glacial.
Why anyone would be surprised that it is generally warming, I am not sure about that -- it would seem like a very sure bet after decades of strong solar activity, human influences, urban heat islands spreading out and inter-connecting -- none of these phenomena argue for cooling.0 -
The "meandering jet stream" concept is something that was trotted out to explain the inconvenient appearance of the polar vortex over North America in 2014 and 2015, which at the time was linked to earlier severe cold spells in Europe around 2010 to 2012. Something had to be invented to explain how in a steadily warming climate there would be severe cold spells and months that were just about the coldest on record. So they came up with this displaced polar vortex theory as a supposed consequence of meandering jet streams. It is neither provable nor disprovable, as with a lot of AGW sub-theorems which are actually descriptions rather than theories.
It is rather like saying the Sun is hot because it is emitting a lot of heat. Bingo.
I don't accept descriptive analysis as theoretical explanation. I have spent a lot of time trying to explain this to climate people but they don't seem to get the concept of circular reasoning. This is why the science is bogged down and not making much progress. But it doesn't explain anything just to describe it, you need a more robust theory that can say why a polar vortex appeared over North America in 2014 and 2015 and not much since then (it tried to form early in the past winter and got obliterated after a few days before winter really got started, but managed to produce quite a cold November).
The problem with this pet AGW theory is that exactly the same weather patterns occurred in colder parts of the 19th century when various winters came in colder than the average back then. So that would tell you that the theory is not sound if it can explain weather patterns in both colder than normal climates and warmer than normal climates.0 -
Advertisement
-
One of the greatest genuine unresolved disputes in science is at the juncture where geocentricity became the reasoning for a moving Earth in a Sun centred system with cause and effect also entering the perceptions of humanity with the insight of Copernicus. This is why it remains such a big deal.
The prevailing view in the era of Galileo was that astronomers made future predictions of astronomical events like eclipses, moon phases and planetary positions so that interpreting the motions of the other planets and the Sun or 'saving the appearances' was secondary. The tension between predictions vs interpretations was never resolved and thereby left the door open for theorists who attempted to make experimental predictions look like astronomical predictions. The 'greenhouse earth' is an example of this academic indulgence.
The history of this important juncture in Western civilisation is as rich as it is deep, after all, the geocentric priority of observations-predictions won out over the heliocentric interpretations-conclusions and this failure influences our era to such an extent that people buy the idea that speculative conclusions can be passed off as inviolate facts.
The principle contributors in this thread operate out of experiments-predictions so would be entirely oblivious to interpretations-conclusions based on the motions of the Earth and climate. It certainly entertains these people and their modeling but their speculative conclusions have really nothing to do with climate and introduce heightened anxiety into the population. The covid experience has shown how heightened anxiety is damaging and especially for young people.
Irish people have generally an instinctive grasp of what is fair and what is mere hype so when they choose to use their interpretations-conclusions faculties once again, they will discover that climate is much like the other sciences of geology and biology and the limits of human influence. Modelers can be useful, in this case by comparing traits of the other planets with the Earth and the type of weather conditions which would result from different axial inclinations between a spectrum from 90 degrees to 0 degrees off the orbital plane ( blue line).
https://calgary.rasc.ca/images/planet_inclinations.gif0 -
M.T. Cranium wrote: »One could argue that this is a random variation that would occur somewhere in the hemisphere most years and just happened to pick Siberia this year. I don't take that approach but believing there would be a cause and effect is not enough to have the actual cause pop out of the shadows.
Even a broken clock is right twice a day.
Joel Myers released an article on Throwing cold water on extreme heat hype
for balance
Jason Samenow wrote a counter argument AccuWeather misleads on global warming and heat waves, a throwback to its past climate denial0 -
Long term weather is cyclical so weather enthusiasts who ignore the dynamical inputs which will change the weather over the next 6 months to colder and stormier in January have lost their interpretative faculties. Long term weather does not shade off into climate as the experimental theorists would wish in their attempt to bypass planetary dynamics.
No doubt those who imagine weather to be an entirely predictive exercise will continue to scar humanity with the belief that long term weather represents climate and into the monstrosity of 'climate change' modeling. These are the people who display the deer-caught-in-the-headlights reactions as their indulgences are both childish and overreaching.
Closed minds close threads but for those weather enthusiasts who are fair and prepared to let information flow in different directions rather than let information be railroaded into dull and dour conclusions, they will be rewarded a thousand times over by looking at cyclical weather events which defy the attempt to corral weather into something it is not.
In the end, the Earth still turns once and parallel to the orbital plane as a function of the orbital motion of the Earth hence the experience of a single day/night cycle at the North/South poles -
https://www.usap.gov/videoclipsandmaps/spwebcam.cfm0 -
You seem to be unaware that you have simply hit upon a different way of describing a commonly understood phenomenon, what lawyers might call a difference without a distinction.
There's nothing wrong with your analysis but you are incorrect in saying that other scientists are in error and fail to recognize something you recognize.
I've read that this is some very specific form of trolling which cannot be perceived from source, but only from those receiving.
An analogy would be if I were to say that odd numbers were those that ended in 1, 3, 5, 7 and 9, which makes my understanding superior to those benighted mathematicians who say that an odd number is one that cannot be divided by 2 with an integer resulting.
While my "superior theory" is true, it is not actually superior or even different. However it is also not inferior. It is just different.
Google if you wish the subject of "scientific cranks" and look for the specific form that you are exhibiting. It is said to be quite rare, most of us have probably never encountered it before (a person who presents an alternate theory to orthodox science that is not contradictory but is maintained to be different although actually the same thing in different terminology).
Your circle of illumination is simply the result of how the Sun shines on a tilted earth at any given point. There's nothing wrong with it, but you are in error thinking that it is an alternative to orthodox science. It is not different in any way, just a different choice of paradigms.
I have no idea how anything would shake you out of this, but we can't waste our time trying to deal with it here.0 -
M.T. Cranium wrote: »Your circle of illumination is simply the result of how the Sun shines on a tilted earth at any given point. There's nothing wrong with it, but you are in error thinking that it is an alternative to orthodox science. It is not different in any way, just a different choice of paradigms.
You are not among Irish sychophants now so spare me the pretense
The circle of illumination is a hemispherical property of the orbital motion of the Earth and always at right angles to the Sun's equatorial plane. The moon and the Earth share the same orientation to the Sun at all times -
https://photojournal.jpl.nasa.gov/jpeg/PIA00134.jpg
This is what is called common sense, however, the childish modelers have managed to create a monstrosity to suit their RA/Dec idea of the Sun wandering across the Earth's equator by pivoting the circle of illumination annually off the equator on an Earth with a zero degree inclination -
https://apod.nasa.gov/apod/ap170319.html
This is the feature of modelers who throw together outcomes with no discipline and no different when it comes to the Earth science of climate.
What I have done is isolate the North and South polar latitudes as surface positions where daily rotational velocity is zero and then explain the single polar day/night cycle separately by rotational cause, in this instance a surface rotation parallel to the orbital plane as a function of the specific way the Earth orbits the Sun. It is common to all planets and a 100% observational certainty ( about 50 seconds into the time lapse) so observational interpretation takes priority over weak 'tilted Earth' responses which are insipid due to the lack of logical development -
https://www.youtube.com/watch?v=612gSZsplpE&t=57s
I wouldn't expect mathematical modelers and their focus on predictive outcomes to comprehend the narrative no more than I would expect them to appreciate the reasons for the partitioning of perspectives between the faster and slower moving planets which rudely got ejected from a thread yesterday.
The weather modelers have scarred humanity for far too long with their 'climate change' fuss by ignoring cause and effect so rather than isolate these academic jokers, they are needed to actually model the relationship between planetary motions and Earth sciences.0 -
Advertisement

 https://www.youtube.com/watch?v=6Yz8nZbZPE8
![[Deleted User]](/applications/dashboard/design/images/defaulticon.png)


This discussion has been closed.
Advertisement