Advertisement
If you have a new account but are having problems posting or verifying your account, please email us on hello@boards.ie for help. Thanks :)
Hello all! Please ensure that you are posting a new thread or question in the appropriate forum. The Feedback forum is overwhelmed with questions that are having to be moved elsewhere. If you need help to verify your account contact hello@boards.ie

Why we use 850hpa temperature charts

Options
  • 21-01-2012 12:34am
    #1
    Banned (with Prison Access) Posts: 8,633 ✭✭✭


    Some of you may be curious as to exactly why we use temperature charts for a level around 1,500m up in the atmosphere. Some may think well why not use the ground temperature charts? The reason is actually quite simple.

    Basically if you were to look at a chart for ground or sea level temperature it is more difficult to get an accurate fast overview of exactly what types of airmass are where in different regions. You could have a guess but a forecaster would then be compromised time wise. The reason is surface geography and it's effect on temperature.

    For example the sea is always warmer in winter whilst the land is always colder in our part of the world. For ground temperature metres above sea level (mountains) also is represented on a basic temperature map. With the 850hpa charts you get a clean view of where different airmasses are.

    There is no temperature variation at 850hpa height as it's above the boundary layer of the atmosphere which means ground geographical features like the sea won't effect the temperature at 850 level which also provides consistency. This is also called diurnal temperature.

    Examples

    /OP images/

    Can't post images right now, will do tomorrow. Hope that helps!


Comments

  • Banned (with Prison Access) Posts: 25,234 ✭✭✭✭Sponge Bob


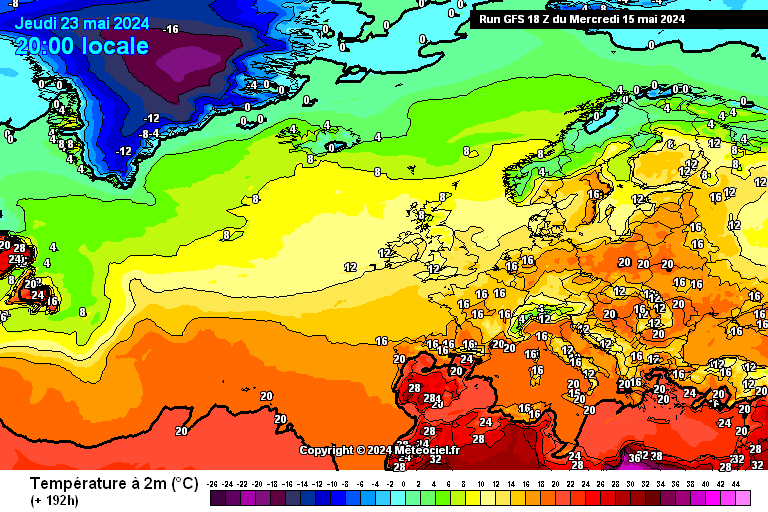
    Here is a basic example.

    Ground and 850hpa temperature projections contrasted.

    Ground by the way means 2m off the ground.

    GROUND Note the sea and land differences that Darkman pointed out.

    gfs-9-192.png?6

    1500 metres up or so, known as 850Hpa

    gfs-2012012106-1-192.png?6?6

    Some very important measurements are taken at that 850hpa height in addition to temperature.

    These are the Theta measurements and Darkman can explain what they means when he is back.


  • Registered Users Posts: 836 ✭✭✭derekon


    What an exciting day on the weather forum, what with all this talk of a possible cold spell. And now Darkman2 is showing how the upper temp charts are important - I feel he might be readying us for the upcoming severe cold and snow? Oh with all this excitement, I think I am going to wet in my knickers...........:D:D:D:D

    D


  • Closed Accounts Posts: 717 ✭✭✭TURRICAN


    at cloud level then what chart would you use?
    i always thought the hpa measurment was pressure and so could never understand it.


  • Closed Accounts Posts: 2,693 ✭✭✭Redsunset


    Pressure drops as you climb higher in the atmosphere. Here's a fairly good guide.
    pressure_vs_altitude_big.gif

    Just to add that millibars is the same as hpa


  • Banned (with Prison Access) Posts: 25,234 ✭✭✭✭Sponge Bob


    The atmosphere is only a few miles thick. The lower the number the less atmosphere is left above you.

    If it is any help every time you fly somewhere you are typcally cruising about 10km-12km up and the clouds are visible but Very Far below you.

    Therefore chances for graupel and snow and things are really decided down there....not where you are at 10km - 12km altitude.


  • Advertisement
  • Registered Users Posts: 1,789 ✭✭✭BEASTERLY


    Thanks DM2, nice guide. Precisely the reasons a forecast for snow should never be based on 850hpa charts alone. A mistake made too often on here.

    TURRICAN, obviously 850hpa is not always at the same altitude because pressure changes. During higher pressure(1030mb) it will be much higher up than say during a 970mb low.


  • Closed Accounts Posts: 717 ✭✭✭TURRICAN


    BEASTERLY wrote: »
    Thanks DM2, nice guide. Precisely the reasons a forecast for snow should never be based on 850hpa charts alone. A mistake made too often on here.

    TURRICAN, obviously 850hpa is not always at the same altitude because pressure changes. During higher pressure(1030mb) it will be much higher up than say during a 970mb low.


    so 850 hpa is above the atmosphere and the temp is always the same.
    and the atmosphere is either in high or low pressure.
    if its high pressure the 850kpa is higher and oppsite for low.?????


  • Closed Accounts Posts: 2,693 ✭✭✭Redsunset


    TURRICAN wrote: »
    so 850 hpa is above the atmosphere and the temp is always the same.
    and the atmosphere is either in high or low pressure.
    if its high pressure the 850kpa is higher and oppsite for low.?????

    850 hpa is roughly around 1500 metres high in the troposphere however when we have a deep low pressure sitting over us this reduces the height of 850hpa to lower level,ie 1350 metres high. The temp at this level varies greatly depending on what type of airmass is approaching. So last Nov/Dec when we were in an Arctic airmass this 850hpa temp dropped to -8 and more so any precip falling when that cold would mostly likely be snow but not always.


  • Closed Accounts Posts: 717 ✭✭✭TURRICAN


    Gotcha,well that much anyway.
    that will help when looking at the charts and i wont be as much of a lurker now:D
    thanks.


  • Banned (with Prison Access) Posts: 25,234 ✭✭✭✭Sponge Bob


    TURRICAN wrote: »
    i wont be as much of a lurker now:D

    You can always lurk where the charts are. :)

    http://www.meteociel.fr/modeles/gfse_cartes.php?ech=156&code=0&mode=0

    Temp 850hpa is the Airmass temperature.
    Temp 2m is Ground temperature
    z500 is the high and low pressure systems that move airmasses around.

    Different models, eg ECM and UK Met=UKMO and Hirlam on left.


  • Advertisement
  • Closed Accounts Posts: 717 ✭✭✭TURRICAN


    Sponge Bob wrote: »
    You can always lurk where the charts are. :)

    http://www.meteociel.fr/modeles/gfse_cartes.php?ech=156&code=0&mode=0

    Temp 850hpa is the Airmass temperature.
    Temp 2m is Ground temperature
    z500 is the high and low pressure systems that move airmasses around.

    Different models, eg ECM and UK Met=UKMO and Hirlam on left.

    yes ive been in there alright.
    pity its in french,i did german in school.:mad:
    thanks for the guide though.

    found the page translator;)


  • Closed Accounts Posts: 717 ✭✭✭TURRICAN


    Just looking at the jet stream chart and im wondering is that a continious
    flow of wind circling around the earth or have i grasped the wrong end of the stick?


  • Registered Users Posts: 9,010 ✭✭✭Tom Cruises Left Nut


    TURRICAN wrote: »
    yes ive been in there alright.
    pity its in french,i did german in school.:mad:
    thanks for the guide though.

    found the page translator;)

    Diese seite ist sehr gut ! ;)

    http://www.wetterzentrale.de/


  • Closed Accounts Posts: 717 ✭✭✭TURRICAN


    t|nt|n wrote: »
    Diese seite ist sehr gut ! ;)

    http://www.wetterzentrale.de/

    ya mein deutche ist nicht so gut!

    ive found the page translator anyway.:)


  • Banned (with Prison Access) Posts: 85 ✭✭rKossi


    TURRICAN wrote: »
    ya mein deutche ist nicht so gut!

    ive found the page translator anyway.:)

    sorry for stupid question but where is the translator? i have been looking for a while but no luck :(


  • Banned (with Prison Access) Posts: 85 ✭✭rKossi


  • Closed Accounts Posts: 4,279 ✭✭✭Su Campu


    The fall in pressure with height is determined by the density of the airmass, which in turn is determined by its temperature and moisture level. For a standard airmass, pressure falls by 1 hPa (or millibar) for roughly every 8.4 m rise in altitude, gradually falling more slowly as you continue upwards, like the exponential curve posted by redsunset. However, in a cold dry airmass, where density is greater, pressure will fall more quickly (possibly by less than 8.0 metres per hPa), while in warm humid airmasses the reduced density increases this figure to much higher than the 8.4 m. At around 30 kms up, however, this figure is around 100 times greater, so pressure fall 1 hPa every 800 metres or so! (see Valentia's midnight sounding, for example, which gives the heights and conditions of various levels up to around 10 hPa (~30 km).

    Mathematically, the hydrostatic equation is the basis of meteorology, and can be quoted as:

    The change in pressure (dP) due to change in height (dZ) is related to gravity (g) times density (ρ), or

    dP/dZ = -gρ

    or

    dP = -gρdZ.

    So if you know the density, then you can calculate the fall in pressure for whatever height rise dZ.

    As pointed out earlier, in low pressure areas, where surface pressure is well below the "normal" 1013 hPa, all the levels will be found at a lower level than if the pressure were higher (assuming we're talking about our type of Atlantic storms - in warm cored lows, the opposite is true in the upper atmosphere). That's why in some of the recent deep storms we had, the 850 hPa level was at around only 1,100 m, while in today's high pressure it's at around 1535 m).


Advertisement