Irish Weather Statistics
Comments
-
Wow, so you think the 18.9 at Mace Head yesterday might be the highest minimum ever?sryanbruen wrote: »Two higher minimums I just found than the 18.1c at Shannon Airport on 22nd July 2014.
18.5c and 18.2c at Dublin (Merrion Square) on August 15th and 21st 1997 respectively.0 -
sryanbruen wrote: »It is even rarer to have consecutive days of 30°C in Ireland. These are the three longest runs of consecutive days with 30°C in Ireland that I know of:
- 5 days at Boora, Co. Offaly from 28 June to 2 July 1976
- 4 days at Kilkenny from 11 to 14 July 1983
- 3 days at Shannon Airport from 27 to 29 June 2018
Durrow had 31c (rounded) for three consecutive days: Wednesday 30.9c; Thursday 31.3c and Friday 30.8c. :eek:
Today fell just shy by 1.1c (28.9c)
I think a 30c is possible here again tomorrow as the wind run will be over a longer stretch of land.0 -
mickmackey1 wrote: »Wow, so you think the 18.9 at Mace Head yesterday might be the highest minimum ever?
Belmullet had a min of 19.3C on the 20th of July 2013.
These are the highest I've got, the 18.9C would come in at 5th place
Station|Date|Min Temp(ºC)
Belmullet|20/7/2013|19.3
Roches Point|2/8/1995|19.0
Shannon Airport|3/8/1995|19.0
Cork Airport|14/7/1983|19.0
Shannon Airport|13/7/1983|18.6
Shannon Airport|23/8/2003|18.5
Belmullet|2/7/1976|18.50 -
mickmackey1 wrote: »Wow, so you think the 18.9 at Mace Head yesterday might be the highest minimum ever?
No but it's still notable nevertheless. The problem with finding the highest minimum of all-time ourselves using the stations' data is that not every stations' data is available in the public domain yet and thus why we have to keep trying to find it. The following from Donegal Storm surely cannot be the all-time highest Ireland minimums because Northern Ireland's record (which is given by the UK Met Office on its climate extremes page) is 20.6c on 31st July 1868. It had a notable minimum of 19.6c on 14th August 2001 too.Donegal Storm wrote: »Belmullet had a min of 19.3C on the 20th of July 2013.
These are the highest I've got, the 18.9C would come in at 5th place
Nice work there, thanks for sharing.Photography site - https://www.sryanbruenphoto.com/
Weather photo portfolio - https://sryanbruen.myportfolio.com/weather-1
0 -
This is mainly for Villain but I thought I'd post it here anyway.
This is every absolute drought (a period of at least with 15 consecutive days with 0.2mm of rainfall or less) that Carlow (Oak Park) has recorded. I included the closed manual station at Oak Park in this (the first table), not just the automatic one that has been built since 2003 (the second table).
By the way, I just noticed that I kept making the mistake in my posts that an absolute drought is 15 consecutive days with 0.1mm of rainfall or less, I meant 0.2mm or less sorry.
Dates|Length
6-20 Jun 1967|15 days
25 Feb-12 Mar 1968|17 days
25 May-8 Jun 1970|15 days
4-21 Jul 1971|18 days
4-23 Sep 1971|20 days
13 Aug-5 Sep 1972|24 days
14-29 Sep 1972|16 days
6-22 Mar 1973|17 days
2-17 Jun 1973|15 days
19 Mar-4 Apr 1974|22 days
13-27 Apr 1974|15 days
15-29 May 1975|15 days
19 Jun-6 Jul 1975|18 days
14-29 Apr 1976|16 days
13-30 Aug 1976|18 days
15 May-3 Jun 1977|20 days
25 Jun-11 Jul 1979|17 days
14-29 Apr 1982|16 days
18 Jul-3 Aug 1982|17 days
20 Apr-13 May 1984|24 days
23 Jun-7 Jul 1984|15 days
15-29 Jul 1984|15 days
9-29 Oct 1985|21 days
6 Sep-4 Oct 1986|29 days
8-24 Jun 1988|17 days
21 Nov-9 Dec 1989|19 days
9-25 Jul 1990|17 days
8 May-1 Jun 1991|25 days
29 Nov-13 Dec 1991|15 days
6-29 Jun 1992|24 days
25 Apr-9 May 1993|15 days
13 Oct-1 Nov 1993|20 days
30 Mar-16 Apr 1995|18 days
20 Jun-5 Jul 1995|16 days
28 Aug-18 Sep 1996|22 days
8-22 Mar 1997|15 days
Dates|Length
10-26 May 2004|17 days
21 Jan-6 Feb 2006|17 days
30 Mar-15 Apr 2007|17 days
21 Dec 2008-9 Jan 2009|20 days
9 Sep-2 Oct 2009|24 days
1-15 Mar 2010|15 days
7-23 Apr 2010|17 days
15 Feb-5 Mar 2013|19 days
24 Mar-9 Apr 2013|17 days
5-22 Jul 2013|18 days
6-24 Jun 2015|19 days
18 Nov-2 Dec 2016|15 days
All data comes from Met Éireann.Photography site - https://www.sryanbruenphoto.com/
Weather photo portfolio - https://sryanbruen.myportfolio.com/weather-1
0 -
Advertisement
-
sryanbruen wrote: »Dublin Airport has had 221.4 hours of sunshine up to the 27th June making it the station's sunniest June since 2006 up to this point. How does it compare with all its Junes of recording sunshine since 1942, see the graph below.
1949 and 1957 easily remain the sunniest Junes on record at the station with 273.3 and 288.6 hours of sun respectively. 1975 comes up third with 253.7 hours of sun. There seems to have been a stark decline in sunny Junes since the 1978 at Dublin Airport. The sunniest Junes nowadays are laughable compared to 1949, 1957 and some other pre-1978 Junes.
According to the June 2018 monthly weather summary that released today, Dublin Airport had 269 hours of sunshine during June 2018 making it the third sunniest June in its records now beating 1975.
Johnstown Castle had 279.9 hours of sunshine during the month and going off the top of my head, that total would make June 2018 the sunniest June in Ireland since 2009 when Malin Head recorded 281 hours of sun.
Phoenix Park had only 3.8mm of rain all month. Mt. Dillon was the only station with above average rainfall for June 2018 and that was largely down to its thunderstorm it recorded on the 8th June when 25mm fell under an hour with a 9 degree drop in temperature during the period.
It was the warmest June since 1976 and or 1970 if my estimates are correct.
The quirkiest thing out of all of this I think was Storm Hector whom brought the highest June wind gust since 2015 - so not too long ago, but in such a dry, warm and sunny month, you wouldn't expect such a deep low (August 1959 followed similar suit).
Gotta say, I will be praising this June for years to come. Absolutely loved it and the stats are fascinating for it too which is a bonus as a statistician and or weather historian here.
https://cli.fusio.net/cli/bulletin/data/2018/06/sum_062018.pdfPhotography site - https://www.sryanbruenphoto.com/
Weather photo portfolio - https://sryanbruen.myportfolio.com/weather-1
0 -
The years 2018 and 1798 featured some odd similarities in one way or another. Let's compare the two going by the Central England Temperature (CET) and England & Wales Precipitation (EWP) figures.
January
2018: 5.3°C and 104.5mm
1798: 3.6°C and 72.4mm
February
2018: 2.9°C and 53.7mm
1798: 4.0°C and 44.6mm
March
2018: 4.9°C and 113.6mm
1798: 5.1°C and 32.8mm
April
2018: 9.8°C and 91.6mm
1798: 10.4°C and 56.3mm
May
2018: 13.2°C and 52.0mm
1798: 12.9°C and 47.6mm
June
2018: 16.1°C and N/A (very dry)
1798: 16.9°C and 31.0mm
To add onto these figures for May/June 1798, the PDF for that period from 1798 given by Met Éireann prove that it was a very dry and warm or hot start to the Summer or late end to Spring. It states:The weather of late Spring and early Summer of 1798, when most of the fighting took place, was exceptionally dry and warm, typical of a prolonged spell of anticyclonic weather. Evidence for this comes from a number of weather observations from the period as well as contemporary accounts of the rebellion. This weather was probably of most benefit to the rebel armies, who lived for weeks outdoors during the battle; it also delayed the arrival of ships carrying government reinforcements from Britain.
One of the most detailed surviving accounts of the weather of 1798 is the record kept by Maximilian Faviere at Eccles Street, Dublin. Faviere made a daily weather entry in the pages of his 'Gentleman's and Citizen's Almanc' between the years of 1781 and 1812. This record shows that the period between May 23rd 1798, when the ill-fated Dublin uprising took place, and the battle of Vinegar Hill on June 21st coincided almost exactly with a spell of fine weather between May 19th and June 19th. During this period, Faviere records only one day with 'showers of rain', while most days are described as 'sultry, dry and very fine'. Another Dublin observer of the time, Richard Kirwan, recorded around a quarter of the normal May and June rainfall. Dixon, in his 1953 account of historical weather records of Dublin, cites the Annals of Ballitore, Co. Kildare, where the Summer of 1798 'seems to have been outstanding and was still remembered in 1818, when an even finer one occurred'.
One effect of the fine weather on the course of the rebellion was to facilitate the Wexford rebels and their families, numbering up to 20,000, who lived outdoors for several weeks and marched on foot over long distances. On the government side, the director general of military hospitals wrote later that 'the weather was so favourable that the regiments upon service underwent considerable fatigue during the Summer, and often slept in the open air, with no disadvantage to their general health'. The anticyclonic conditions and resultant light winds caused delays for the ships carrying reinforcements to Ireland from British ports, the first of which sailed from Portsmouth on June 3rd. The Viceroy Camden expressed his concern to London when no reinforcements had arrived by June 15th. It seems certain that any French invasion fleet at the same time, widely expected on both the rebel and government sides, would have suffered similar delays. By the time the small French fleet under Humbert arrived at Mayo in late August, the outcome of the rebellion had already been decided.
Although the fine weather had some influence on events during the Summer of 1798, stormy weather was much more significant eighteen months earlier, when the attempted French invasion of 15,000 troops under Marshal Hoche failed at Bantry Bay. After initial favourable easterly winds which allowed the fleet to break through the English blockade off Brest, severe storms during the last week of 1796 led to the dispersal of the invading fleet and caused the landing to be abandoned. The loyalist medal struck by landlord Richard White of Bantry House for the Bantry Garrison and Friendly Association was subsequently inscribed with the words 'Deus afflavit et dissipantur' - God blew and they were scattered.
https://www.met.ie/cms/assets/uploads/2017/08/Summer1798.pdf
Summer 1798 took place during Solar Minimum of Solar Cycle 5 - the first of two solar cycles which made up the Dalton Minimum period. It is clear here that the minimal solar activity had a major influence in the anticyclonic conditions of early Summer 1798 during the Irish Rebellion and the blocking just happened to occur over us during the period.
The CET and EWP figures suggest that July and August 1798 were much more unsettled months with July being a very wet month in England & Wales. For that time period, they would have been relatively mild months but using the averages nowadays, they would be average to rather cool months. June was one of the hottest on record in contrast and was over 0.8°C warmer than June 2018 for the CET.
1798 had a similarly warm and dry May to 2018, a similarly cold March to 2018 (though 2018 was far wetter), a similarly dry February to 2018 and a similarly warm April to 2018. All these similarities are very interesting and the fact that 1798 was the beginning of the Dalton Minimum era is also intriguing. Forecasts have been expecting a Grand Solar Minimum to occur following Solar Cycle 24 and if it were to turn out that way, it would be amazing. Years ending in "8" tend to have poor Summers especially since 1878 of the 19th century but Summers such as 1798, 1868 and 2018 show that this is just a statistical quirk and or coincidence more than anything.
Data comes from UK Met Office.
Photography site - https://www.sryanbruenphoto.com/
Weather photo portfolio - https://sryanbruen.myportfolio.com/weather-1
0 -
Here's all the Novembers with a CET under 6.0c since 1900. Last time a November had a CET under 5.0c was 1993 and the last time a November had a CET under 4.0c was stupidly far back in 1925.... even though the 1910s and 1920s had several occurrences of Novembers of such. The third column is of the gap between the cold November (under 6.0c) in that row and the preceding cold November (again under 6.0c).
1919 was an insane November to say the least and I hope I'll be able to give a post on it here sometime with Irish station stats such as from Phoenix Park - waiting on ECA&D to get their site back together fully so I can. Mid-November 1919's cold spell was similar to the end of November 2010 but even more severe in the depth of cold over the UK. Autumn 1919 had already been interesting pre-November with one of the latest heatwaves being recorded in the second week of September but around a week or so after, it turned very cold and in fact, snow was recorded. October 1919 was anticyclonic but cold with a cold and snowy end to the month.
Data comes from the UK Met Office.Photography site - https://www.sryanbruenphoto.com/
Weather photo portfolio - https://sryanbruen.myportfolio.com/weather-1
0 -
The ice storm of January 1940 (remember that this was during WW2) remains one of the most unprecedented weather events on record in the UK to this day. The closest we've gotten to its extreme levels is the freezing rain of January 1996 but that was NOTHING compared to 1940.
During WW2, weather forecasts disappeared from radio and newspapers during the period. Therefore, you were not allowed to speak about the day's weather and reports on the weather were only allowed to appear approximately six weeks after the events' occurrence. As a result of these actions, Britain was going to be unknowingly ravaged and paralysed by one of the worst snow storms and ice storms ever to hit the country in January 1940.
January 1940 was the first sub zero CET month of the 20th century up to that point with a CET of -1.4c and the coldest month since February 1895 whilst the coldest January since 1881. The 10th-24th January 1940 had a CET of -3.5c.
Met Éireann doesn't have any information on this crazy month online but from ECA&D, Phoenix Park had the following maximum temperatures (I don't have the minimums currently) during the month:
Date|Maximum temperature
13 Jan|1.1
14 Jan|-0.6
15 Jan|1.1
16 Jan|1.1
17 Jan|-1.1
18 Jan|2.8
19 Jan|1.1
20 Jan|-1.1
21 Jan|0.6
22 Jan|1.1
The DataMarket data (from the UK Met Office) suggest that Dublin Airport had a mean temperature of 1.2c during January 1940, its third coldest January on record behind 1881 and 1963.
The month began with a northerly flow but then the winds veered more to an easterly for a time shortly afterwards bringing clear and sunny conditions but very severe frost. Low pressure got close to the west of Ireland bringing cloudier and milder conditions for around the latter part of the first week of January.

On the 16th, high pressure retrogressed into the Atlantic and up to Greenland with a monster block of around 1065mb forming, opening up the flood gates to a northerly flow again bringing bitterly cold air originating from Siberia - just look at those upper air temperatures. There was blizzard conditions in those gusty northeasterly winds through the afternoon and by the 17th, the Thames had frozen over for the first time since 1880.

21st January brought the coldest temperature of the month and of the Winter with -23.3c at Rhayader in Wales which became the record low temperature for Wales, in deep snow cover and calm conditions for a time. However, winds started to intensify afterwards which whilst giving a bone chill feeling to the air made sure that temperatures did not drop as low as they did on the morning of the 21st for some. Further scattered snow showers occurred for days. A lot of places had a couple of ice days - where the temperature does not get above 0c all day. Many parts were cutt off.

By the 27th January, the Atlantic tried to come back bringing up an area of low pressure from the southwest. This low was to become infamously known for the terror it caused in Britain. It was to bring an unprecedented ice storm which would be extremely unusual for the country and weather events of this type happen more frequently in around eastern Canada and the northeastern US. This mild air met the cold easterly with an established freezing cold Britain and gave away to heavy snow/blizzards over the north of the country including four feet in Sheffield on the 26th and 10 inch drifts in Bolton on the 29th.
When water droplets exist in liquid form at several degrees below zero without a nucleus (basically microscopic dust and soil particles), they are "supercooled". Supercooled water droplets play an important role in the exact way that rain forms during Winter time in particular. When these supercooled solid water droplets pass through a layer of the atmosphere that is above freezing on their way to the ground, they melt into a liquid. However, if deep cold air is established on the ground courtesy of a preceding cold spell or heavy snowfalls, the droplets become supercooled again. Once these droplets land on the surface that is very cold, they freeze and form a "glaze of ice". This is called freezing rain and it is very rare to occur in Ireland and the UK like I said above.
The process given is how the freezing rain came about in January 1940 but what made this freezing rain event so severe was the fact that fronts laid stationary to the southwest of the UK for more than a day resulting in continuous freezing rain with maximum temperatures between -2 to -4c. Telegraph poles and wires got severely damaged by the heavy ice. Birds were unable to fly because ice accumulated on their wings. Travelling anywhere was next to impossible. Roads became skating rinks basically and slopes were impossible to climb because they were completely frozen over with extreme ice and if you attempted to, you would hurt yourself badly and slip.
The ice would not melt until the 3rd February when it caused severe flooding.

Bolton, UK in January 1940:
Data comes from the UK Met Office.Photography site - https://www.sryanbruenphoto.com/
Weather photo portfolio - https://sryanbruen.myportfolio.com/weather-1
0 -
Next 12 days, I will be sharing my CET graphs which are for individual months of the CET series. To start off, here's January's one. Notice the lack of cold Januaries in modern times besides 2009 and 2010 for the CET.
As should be expected, January has the highest frequency in the CET series to be under 0c for the CET. Going by its frequency historically, a January with a CET under 0c occurs every 17.95 years (rounded to 18 years) on average. The gap between January 1881 and 1940 was 58 years in contrast to this average. Just some fun stats.
Data comes from the UK Met Office.Photography site - https://www.sryanbruenphoto.com/
Weather photo portfolio - https://sryanbruen.myportfolio.com/weather-1
0 -
Advertisement
-
Here's February's CET graph. Like January, notice the lack of cold Februaries in modern times even though the twentieth century had some of the coldest Februaries on record (inc. the coldest which was 1947).
Meant to say with last night's post, the last subzero CET January was 1979. The last subzero CET February was 1986.
Using similar methods to January, a subzero CET February occurs every 44.875 years (rounded up to 45 years) which is a lot lot longer than the average frequency for a subzero CET January.
It is always interesting how February had its most subzero CET months within the 20th century.
Data comes from the UK Met Office.Photography site - https://www.sryanbruenphoto.com/
Weather photo portfolio - https://sryanbruen.myportfolio.com/weather-1
0 -
Now here's March's CET graph. Unlike the other two months we've done so far, March has had one notable cold month in modern times, 2013 - the large down spike near the end. March 2018 wasn't very notable in the grand scheme of things thanks to the milder interludes regardless of the two Beasts.
A March with a CET below 3c happens every 17.95 years (rounded to 18 years) on average. But of course, this average has deviated a lot in modern times from 1892 to 1962 to 2013 for example.
March 2018 was remarkable for its actual cold temperatures at times whilst March 2013 was remarkable for its persistence of cold.
Data comes from the UK Met Office.Photography site - https://www.sryanbruenphoto.com/
Weather photo portfolio - https://sryanbruen.myportfolio.com/weather-1
0 -
Very late but.... here's April's CET graph. Notice how the only two Aprils with a CET of 11.0c or more have occurred close to each other and happened in the last decade or so, 2007 and 2011.

Data comes from UK Met Office.Photography site - https://www.sryanbruenphoto.com/
Weather photo portfolio - https://sryanbruen.myportfolio.com/weather-1
0 -
This is all copied from my blog post. I have shared a lot of this information in other threads but not this one - the main stats thread. I have added extra stats where possible.
Summer 2018 so far in the UK and Ireland
2018 has been a phenomenal year for weather enthusiasts with numerous events taking place in a short period of time from the Beast from the East to the Son of the Beast to the April heatwave and now Summer 2018. Summer 2018 has been the warmest and driest so far since 1995 for some and for others, even record breaking dry. This blog post will be going over all the available stats so far for Summer 2018. I will be incorporating May 2018 into this post also.
According to a blog post by the UK Met Office:- For the UK as a whole, the country has received 47mm of rain from 1 June to 16 July making it the driest start to Summer in modern records which date back to 1961. 2013 was the previous driest with 59mm of rain.
- June 2018 was the third driest on record for England since 1910.
- The average daily maximum temperature for the UK from 1 June to 16 July 2018 is 20.9°C. To emphasise how remarkable this is, the average daily maximum temperature for Summer 1976 (of course the hottest ever recorded) was 21.0°C. Even if the rest of the season ends up average, 2018 will most certainly rank within the top 10 warmest Summers on record for the UK or top 25 for the Central England Temperature (CET).
- 1 June to 16 July has recorded 385 hours of sunshine on average over the UK which comfortably fits it in the sunniest Summers on record for the period but still a long way to go for it to be a record breaker. For instance, 1976 from June 1 to 31 August had 669 hours of sunshine over the UK as a whole.

There was a warm spell for the Easter period of 1984 at the station which had 6 consecutive days of 20°C or more from April 23rd to 28th. Conversely, there was a warm spell of such for 7 consecutive days at Shannon Airport from September 25th to October 1st 1985.
These were the Ireland stats of the May-June 2018 spell before we get onto the heatwave below. Here's the absolute maximum temperatures map for all Irish synoptic stations during the period May 23 to June 10 2018.
Here's a table of the daily sunshine totals (hours) from May 22 to June 12 2018 at 6 Irish stations which record sunshine.
Dublin Airport had 191.3 hours of sun during this period with an average of 8.7 hours of sun per day! The period was 22 days long and 191.3 hours of sun is a bit more than what a whole May average sunshine is at the station. The last sunny period that I can find comparable to this is July 2013 which had 197.2 hours of sun at the station from the 4th-25th July whilst 1st-11th (though only 11 days long) May 2017 had 145.5 hours of sunshine at Belmullet, around 3/4 of its whole monthly May average sunshine.
The final June 2018 stats revealed that:- It was the warmest June on record for Northern Ireland and Wales back to 1910.
- It was the 4th warmest June on record for England and Scotland back to 1910.
- It was the 3rd warmest June on record for the UK back to 1910.
- It was the warmest June on record at the Irish station Claremorris with a mean temperature of 15.4°C beating its previous record of 14.9°C in June 1970 (records began in 1943).
- It was the equal warmest June for the CET (with 2003) since 1976 with a mean temperature of 16.1°C.
- It was the warmest June on record at the Irish station Shannon Airport with a mean temperature of 17.0°C easily beating its previous record of 16.0°C in June 1970 (records began in 1939).
- The average daily maximum temperature for the UK was 19.9°C equalling that of June 1976.
- The maximum temperature for June 2018 was 33.0°C at Porthmadog, Wales on the 28th which was not as high as June 2017's maximum of 34.5°C at Heathrow on the 21st. However, this was Wales' highest June temperature since 1976.
- It was the 4th sunniest June on record (since 1929) for the UK behind only June 1957, 1940 and 1957.
- It was the fifth sunniest June on record for Northern Ireland and England, third sunniest on record for Wales and fourth sunniest on record for Scotland.
- 16.0 hours of sunshine at the Irish station Knock Airport on the 24th made it the sunniest day on record here since its records began in 1997.
- 16.5 hours of sunshine at the Irish station Malin Head on the 28th made it the sunniest day ever recorded in Ireland.

It was the driest May/June combination on record for Dublin Airport with 23.9mm easily beating the previous record of 44.8mm in 1970. Though there were variations during the period, the warm spell or heatwave generally lasted from 24 June to 14 July and the sunny spell began on 21 June. This was the longest such spell of weather in Ireland since 1995. The sunny period was a total of 24 days and featured extraordinary sunshine totals for Ireland (stats are not in for the UK yet). Valentia Observatory and Cork Airport on top for sunshine from 21 June to 14 July 2018 (24-day period) with totals of 273.3 (11.4 hours per day on average) and 270.9 hours (11.3 hours per day on average) respectively. Don't know if that's record breaking but surely it must be near record breaking because those kinds of totals would be mad in a 30 or 31-day period, never mind 24 days - not even a full month!
Here's a graph of the daily maximum temperatures for selected Irish stations from 21 June to 14 July 2018. 32.0°C at Shannon Airport on June 28th was the maximum temperature for Ireland during the spell making it the hottest day in Ireland since 19 July 2006 and hottest June day since 1976.
This map shows the maximum temperature for Irish stations from 24 June to 14 July 2018, thanks to Gaoth Laidir.
Other stats for the June-July 2018 heatwave in Ireland
A heatwave occurs where there are 5 consecutive days or more with maximum temperature of 25°C or more. Official heatwaves were recorded at fifteen synoptic stations this year (see table below by Met Éireann). This table is not of every stations' heatwave since 2000. For example, Oak Park had a heatwave from 17 to 21 June 2017 like Kilkenny in the table below but it is not mentioned. It's worth noting that Oak Park's heatwave would be 17 days long if it weren't for the station failing to reach 25°C by 0.1°C on 5th July.
This table is one I made on the heatwaves that the Irish stations of Birr, Kilkenny, Oak Park and Shannon Airport have recorded up to 2017.
Since 1940, 2018 has recorded the second highest June temperature in Ireland as shown by the table below which shows the highest June temperatures per decade in Ireland since the 1940s.
An absolute drought involves minimum 15 consecutive days with 0.2mm of rainfall or less. Current soil moisture deficits range from 60-95mm, highest in the midlands and east of Ireland, 75mm and above represent drought conditions. 2018 has recorded two absolute droughts in Ireland; first one was May-June 2018 and the second one was June-July 2018. The table below from Met Éireann shows the absolute droughts in Ireland for 2018 up to the 11th July. The last time there were drought conditions in Ireland was April-May 2017 in the midlands and the west.
In terms of the UK, according to Dan Holley on Twitter, Brooms Barn in Suffolk has seen 0mm of rain for 45 consecutive days up to 16th July 2018. Some people have reported that they have not had rain since 9th May but as the stats aren't in to show that, this is currently exaggeration to me. The longest absolute droughts I know of are 73 days at Mile End, London in Spring 1893, 56 days in eastern England from August to October 1959 and 50 days in Kent from July to September 1947.
Summer 2018 is full of interest, that's for sure!
All data comes from Met Éireann and the UK Met Office.Photography site - https://www.sryanbruenphoto.com/
Weather photo portfolio - https://sryanbruen.myportfolio.com/weather-1
0 -
Brilliant and well informed post sryan, thanks!0
-
SleetAndSnow wrote: »Brilliant and well informed post sryan, thanks!
I'm hoping to have something special soon") , thanks.
, thanks.
I'm going early tonight - unlike last night - with the CET graph. Here's May's one and it's always striking just how warm May 1833 (the large spike up near the middle) was compared to any other May in the CET series. May 1833 was a good 2 degrees warmer than either May 2017 or May 2018.
Data comes from the UK Met Office.Photography site - https://www.sryanbruenphoto.com/
Weather photo portfolio - https://sryanbruen.myportfolio.com/weather-1
0 -
3 of the 6 years where 30c was recorded in Ireland since 2000 have been recorded on 19 July funnily enough (2006, 2013 and 2016). Here's an animation of every 19 July's 500mb height synoptic since 1900.

Photography site - https://www.sryanbruenphoto.com/
Weather photo portfolio - https://sryanbruen.myportfolio.com/weather-1
0 -
First part of this post is giving the gifs that I originally made for my November/December 2010 post but for some reason, they wouldn't embed into the post!


Now for the main point of this, this is June's CET graph. Hottest June since 1846 really stands out on the graph - June 1976 with a CET of 17.0c. June 2018 had 16.1c in comparison which was the equal hottest with 2003 since 1976. June 1846 was exceptionally warm just like May 1833 and quite a bit above every other hot June in the CET records. I would find it unbelievable if December 2015 hadn't occurred which was easily the warmest December on record with as big a deviation from the previous warmest as June 1846.
Data comes from the UK Met Office.Photography site - https://www.sryanbruenphoto.com/
Weather photo portfolio - https://sryanbruen.myportfolio.com/weather-1
0 -
Shannon Airport's annual absolute maximum temperatures for every year from 1946 to 2018. Notice how 2018 stands out. The red line is a 5 year running average of its annual maximum temperatures. Why you are seeing these excel graphs very recently from me is that I've finally gotten used to it :P, took me a while!

Data comes from Met Éireann.Photography site - https://www.sryanbruenphoto.com/
Weather photo portfolio - https://sryanbruen.myportfolio.com/weather-1
0 -
Here's July's CET graph.
July 1983 and July 2006 are so far the only Julys with a CET of at least 19.0c. Not to mention, these months were the warmest ever recorded for any month in the CET series for their respective times with means of 19.5 and 19.7 respectively. July 2018 provisionally stands at a CET of 19.3c up to the 19th so it's already been an incredibly hot month for the CET (will be only the third ever July and fourth ever month to achieve a CET of at least 19.0c). With the incoming hot weather for the CET region for much of the rest of July, the July 2006 record really looks like being beaten and July 2018 will take the crown for hottest month ever for the CET. We could even achieve the first ever 20c CET month which will be phenomenal to say the least. It won't take much to achieve these figures because the minimum it would take for a daily CET of 23c for example is mid teens at night and high 20s during the day which is what they're going to have for the next week by the looks of things. July 2018 will be as remarkable for heat as July 1983 was for its time beating the previous July record at the time by 0.7c which for a month like July is quite a large difference.
Data comes from the UK Met Office.Photography site - https://www.sryanbruenphoto.com/
Weather photo portfolio - https://sryanbruen.myportfolio.com/weather-1
0 -
Advertisement
-
Here's August's CET graph. The last 18.0c CET August was 2003 and the only 19.0c CET August was 1995 with 19.2c though 1997 was close with 18.9c.
Despite all the poor Augusts in modern times, the last August with a CET under 14.0c was way back in 1986.
Data comes from the UK Met Office.Photography site - https://www.sryanbruenphoto.com/
Weather photo portfolio - https://sryanbruen.myportfolio.com/weather-1
0 -
Multiple factors will play a lot in how the temperatures will be like, record breaking or not. One such factor is thickness. It was the thickness that gave the one day wonder of 1 July 2015 with a maxima of 36.7c. This was hotter than ANY day of Summer 1976 as a reminder. This one day wonder or mini heatwave in late June/early July 2015 is what I'm going to discuss here in this post.
This mini heatwave was very impressive for the UK - not much so for Ireland.
The UKMO fax chart below from 30 June 2015 shows a 1023mb area of high pressure building to the east of the UK into central Europe and up to Scandinavia with a cold front just out to the west of Ireland. The winds are going anticlockwise around this front from a southerly with air being pumped up from Iberia.
If you notice to the north of Europe, there is northern blocking which would indicate how Summer 2015 was going to go down after this Spanish plume/mini heatwave.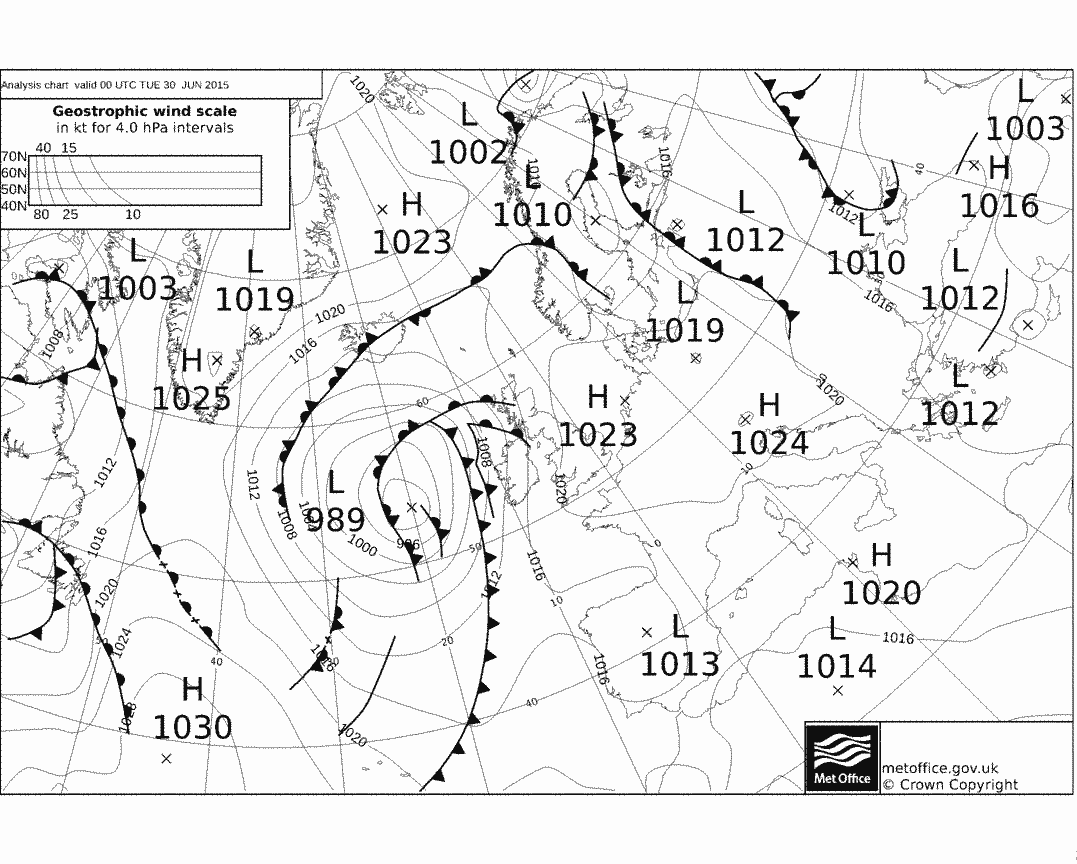
850hPa temperatures were already surpassing 15c to the south of England on 30 June. Heathrow reached a maximum temperature of 32.5c which made it the warmest June day in the UK since 2011. Glasnevin, Co. Dublin got up to 26.1c in abundant sunshine (the highest June temperature in Ireland at this time since 2010) but this was to become the highest temperature of the entire year in Ireland making it the lowest annual maximum temperature since 2011. Phoenix Park reached a maximum of 25.6c on the same day. Many western regions barely even reached 20c though close to the front. Belmullet's maximum of June 2015 for instance was only 18.3c on the 29th.
The pattern continued into the 1st July 2015 but the front was further in over Ireland and it was even hotter in the UK than the previous day. The temperature at Heathrow was 32.5c at 09:00 GMT and 34.1c at 1000 GMT, before falling back to 31.5c by 11:00 GMT. The maximum of 36.7c was recorded at 14:13 GMT. The Heathrow figure for 09:00 GMT made it the highest night-time temperature on record in the UK (2100 to 0900 GMT). The 36.7c figure made it the highest July temperature on record for the UK beating the previous record of 36.5c on 19th July 2006. It was also the highest temperature overall in the UK since August 2003. It was reported that 40c was recorded in Lincolnshire in July 1808 but due to how far back this was, this is disregarded as an official temperature. Castleconnell, Co. Limerick recorded 25.6c on July 1st for Ireland.

Satellite for 10:53 GMT on 1st July 2015.
UK Met Office's article on the event: https://www.metoffice.gov.uk/climate/uk/interesting/july2015
Data comes from Met Éireann and the UK Met Office.Photography site - https://www.sryanbruenphoto.com/
Weather photo portfolio - https://sryanbruen.myportfolio.com/weather-1
0 -
Here's September's CET graph.
I find it quirky how after the first decade or so of the twentieth century, September absolute maxima tended to be lower though there have been notable exceptions such as 2016, yet Septembers have overall gotten warmer and warm Septembers aren't a rare occasion nowadays.
Data comes from the UK Met Office.Photography site - https://www.sryanbruenphoto.com/
Weather photo portfolio - https://sryanbruen.myportfolio.com/weather-1
0 -
sryanbruen wrote: »
The pattern continued into the 1st July 2015 but the front was further in over Ireland and it was even hotter in the UK than the previous day. The temperature at Heathrow was 32.5c at 09:00 GMT and 34.1c at 1000 GMT, before falling back to 31.5c by 11:00 GMT. The maximum of 36.7c was recorded at 14:13 GMT. The Heathrow figure for 09:00 GMT made it the highest night-time temperature on record in the UK (2100 to 0900 GMT). The 36.7c figure made it the highest July temperature on record for the UK beating the previous record of 36.5c on 19th July 2006. It was also the highest temperature overall in the UK since August 2003. It was reported that 40c was recorded in Lincolnshire in July 1808 but due to how far back this was, this is disregarded as an official temperature. Castleconnell, Co. Limerick recorded 25.6c on July 1st for Ireland.
I was working in London back then and remember that day well, I recall stepping outside at 6am and being hit by a wall of heat, was like being in the tropics. What made it even more unusual was that the hottest July temp on record was on a hazy and largely cloudy afternoon, just shows how hot the airmass was.0 -
From UK Met Office:We classify less than 1.0mm of rain in a day as a ‘dry day’. Using this threshold, several sites have had 54 consecutive dry days (starting 30 May), including a few which have had less than 1mm in the entire 54 day period.
The sites and their total rainfall over the 54 days are:
Heathrow (0.4 mm)
Hampton Water works (0.6 mm)
Kenley Airfield (1.0 mm)
Cambridge NIAB (1.0 mm)
Cavendish (1.6 mm)
High Wycombe (1.8 mm)
Shoreham Airport is close behind with 53 consecutive days of less than 1mm of rain.
Church Lawford has had 52 consecutive dry days starting on 1 June.
The longest run of days with no rain at all this summer so far is 48 days at Brooms Barn, near Bury St Edmunds, since 5 June. Also most of our observing sites in East Anglia have had no rain at all since 21 June.
https://www.metoffice.gov.uk/news/releases/2018/heatwave-continues-with-temperatures-into-the-mid-30s-celsiusPhotography site - https://www.sryanbruenphoto.com/
Weather photo portfolio - https://sryanbruen.myportfolio.com/weather-1
0 -
Here's October's CET graph.
There has been no October with a CET under 9c since 1993 though October 1992 and 1993 were both two consecutive very cold Octobers (-3 to -4c below average over most parts of Ireland). The last time October had a CET under 8c was 1992 and the last time October had a CET under 7c was in 1896. Notice how cold October 1740 was (with a CET of only 5.3c!).
Data comes from Met Éireann.Photography site - https://www.sryanbruenphoto.com/
Weather photo portfolio - https://sryanbruen.myportfolio.com/weather-1
0 -
One of my most anticipated projects is to create monthly weather summaries for Ireland for the months that Met Éireann have not produced one of before. To start the project off, I have done July 1983. I have attached the PDF file for my summary.
I did the same layout as Met Éireann's monthly weather summaries as much as I could - though use my own logo (which is for my site/blog). I wrote it from the appropriate period of time as in act like it was wrote in August 1983 than July 2018 in the case of the records on the summary.
*Sunshine figures are estimates and I included Casement Aerodrome on the graph because I could not find a third station outside Dublin that recorded sunshine in July 1983 in Met Éireann's historical data - I know several stations that did but Met Éireann have not made their sunshine data available in the archive online (such as Valentia Observatory).
Here's an image of how the front of it looks:
Would you like me to do others?Photography site - https://www.sryanbruenphoto.com/
Weather photo portfolio - https://sryanbruen.myportfolio.com/weather-1
0 -
Here's November's CET graph. What I find intriguing about November is the fact of how many really cold ones occurred during the Glassberg Minimum or early 20th century - I have labelled each of the notable solar activity periods on this graph.
As I said in my cold Novembers post, the last time November had a CET under 5c was 1993 whilst the last time November had a CET under 4c was ridiculously far back in 1925.
Data comes from the UK Met Office.Photography site - https://www.sryanbruenphoto.com/
Weather photo portfolio - https://sryanbruen.myportfolio.com/weather-1
0 -
I remember July 1983 for a thunderstorm that woke me up in the middle of the night - not an easy thing to do!0
-
Advertisement
-
One of the many weather events that certainly stand out in the hearts of Irish weather enthusiasts along with others like Winter 1947 and the Big Snow of 1982 is the thunderstorm of 25/26 July 1985.
According to Met Éireann:
Widespread and spectacular thunderstorm activity occurred throughout the evening of the 25th July 1985 and continued overnight and into the morning of the 26th. Hundreds of farm animals were killed by lightning and large hailstones damaged tillage crops and crops of apples and fruit. The flooding which accompanied the storm affected farm buildings, houses, supermarkets, and stores in worst hit areas.
At midday on 25th July 1985, much of Ireland was under a blanket of high cloud with pressure ranging from 1014 mb in the south of the country to 1016 mb up north. As the continental airflow attempted to displace the moist Atlantic air, pressure gradually fell. As pressure continued to drop, by midnight on the 26th, a shallow low was spotted moving slowly off the southeast coast of Ireland with winds generally slack. This shallow pushed northeastwards during the morning of the 26th clearing by the afternoon. You can see by the synoptics below that it was a very volatile setup indeed.


Naas, Co. Kildare recorded up to 30mm in the space of 30-40 minutes whilst 28mm fell at Oak Park, Co. Carlow within 30 minutes and 29mm at Coon, Co. Kilkenny within 30 minutes. At the same stations, 22mm fell at Oak Park and 21mm fell at Coon within 15 minutes! The return period for events like this is over 100 years showing you how uncommon and rare it is.
The July 1985 thunderstorm does not seem remarkable in comparison to the 11 June 1963 thunderstorm that gave more than 75mm of rainfall at Mount Merrion in Dublin within one hour. However, what stood out was the intensity of the large hailstones, the frequency of the lightning flashes and the amount of regions affected by the heavy rain and hail when in comparison, it was mainly that particular region of Dublin that was affected on 11 June 1963.
Other notable rainfalls from this thunderstorm include:
76.8mm at Castleshane, Co. Monaghan on 25 July
61.8mm at Emyvale, Co. Monaghan on 25 July
58.4mm at Coolgreany Castlewarren, Co. Kilkenny on 25 July
57.2mm at Naas C.B.S, Co. Kildare on 25 July
52.4mm at Kilmacthomas, Co. Waterford on 25 July
52.2mm at Skerries, Co. Dublin on 25 July
46.9mm at Curragh Racecourse, Co. Kildare on 25 July
46.2mm at Duleek, Co. Meath on 25 July
30.1mm at Tibradden Larch Hill, Co. Dublin on 26 July
This is an RTÉ Archive video on the thunderstorm of July 1985 featuring actual footage: https://www.rte.ie/archives/collections/news/21200391-freak-storm-causes-damage/
All data comes from Met Éireann.Photography site - https://www.sryanbruenphoto.com/
Weather photo portfolio - https://sryanbruen.myportfolio.com/weather-1
0


