Advertisement
If you have a new account but are having problems posting or verifying your account, please email us on hello@boards.ie for help. Thanks :)
Hello all! Please ensure that you are posting a new thread or question in the appropriate forum. The Feedback forum is overwhelmed with questions that are having to be moved elsewhere. If you need help to verify your account contact hello@boards.ie

Cold Spell Late Feb/ Early March Technical Discussion only MOD NOTE POST #1

Options
14950515355

Comments

  • Registered Users Posts: 13,540 ✭✭✭✭sryanbruen


    Seems to me that we're going into a March 2013-esque scenario here, southerly tracking jet stream, northern blocking, warm stratosphere, low pressure invading from the south. I think nature is trying to tell us something!

    NOAA_1_2013030712_1.png


  • Registered Users Posts: 3,135 ✭✭✭flanzer


    JCX BXC wrote: »
    78.6cm....you missed the 'point'.

    786mm of rain would be a record, and probably put the area under water.

    Ha ha, just realized that. Thanks!


  • Registered Users Posts: 2,023 ✭✭✭Donegal Storm


    So now that the dust has literally settled , which of the models performed best ?

    I’d never given the ICON any credit before but thought it handled things very well

    I think all the major models did really well all things considered. We had a thread open for the event a full 10 days before it started as even at that stage there was consistent cross model agreement. One of the most unusual things about the whole event was that everything went to plan without a hitch, every day I checked the models I expected a downgrade or a spanner in the works but it never came so a good job all round I'd say

    The exact track and position of fronts with the storm weren't pinned down at all but thats to be expected for such a complex and messy system


  • Closed Accounts Posts: 18,268 ✭✭✭✭uck51js9zml2yt


    JCX BXC wrote: »
    78.6cm....you missed the 'point'.

    786mm of rain would be a record, and probably put the area under water.

    It still has to melt people :eek:


  • Registered Users Posts: 1,785 ✭✭✭piuswal


    Well, if you thought you could take a nice long rest, check the day seven map on ECM.

    Yes, but it moves the surface low northwards very smartly.


    Nonetheless it would be interesting were it to develop that way with such a low 500 value.


  • Advertisement
  • Registered Users Posts: 3,428 ✭✭✭ZX7R


    So now that the dust has literally settled , which of the models performed best ?

    I’d never given the ICON any credit before but thought it handled things very well

    For me the UKMO really impressed me it kept it track regarding the original evolution of the cold , the ecm pick up emma as a kink in the iosbars quite early in the runs leading up to it becoming a storm, I believe it took at least 3 days before the other models seen it, ICON surprised me


  • Registered Users Posts: 8,219 ✭✭✭Gaoth Laidir


    Very rapid thaw at Dublin Airport in the last few hours.

    10 am...17 cm
    11 am...17 cm
    12 pm...15 cm
    1 pm....12 cm (patchy)
    2 pm....10 cm (patchy)
    3 pm....7 cm (patchy)
    4 pm....5 cm (patchy)

    Patchy means 50-100% coverage. Casement has only dropped by 1 cm to 16 cm in the same time and is still 100% coverage. Cork gone from 14 to 12 since the rain started, Knock still 2 cm, Shannon 1.

    For some reason the Dublin figures above have been corrected. The synop reports now show still 15 cm of patchy cover at 11 pm tonight. There is a strange anomaly where it jumps from 10 cm to 15 again the following hour, but it may be because they had to sample a different area. Anyway, I was thinking the original figures seemed strange at the time.

    So current depths/coverage/snow type at 11 pm are

    Casement 16 cm/100%/uneven wet or compacted
    Dublin Airport 15 cm/51-100%/wet or compacted
    Cork Airport 9 cm/100%/even wet or compacted
    Knock (still manned this late in the night) 2 cm/100%/wet or compacted
    Shannon's cover all had melted by 6 pm.


  • Registered Users Posts: 18,141 ✭✭✭✭JCX BXC


    For some reason the Dublin figures above have been corrected. The synop reports now show still 15 cm of patchy cover at 11 pm tonight. There is a strange anomaly where it jumps from 10 cm to 15 again the following hour, but it may be because they had to sample a different area. Anyway, I was thinking the original figures seemed strange at the time.

    So current depths/coverage/snow type at 11 pm are

    Casement 16 cm/100%/uneven wet or compacted
    Dublin Airport 15 cm/51-100%/wet or compacted
    Cork Airport 9 cm/100%/even wet or compacted
    Knock (still manned this late in the night) 2 cm/100%/wet or compacted
    Shannon's cover all had melted by 6 pm.

    The Shannon cover makes little sense, still a good albeit patchy covering left here in West Clare, where do they measure it?


  • Closed Accounts Posts: 1,576 ✭✭✭patneve2


    Looks like a series of slack low pressures for the more reliable. Cool to occasionally cold. Looks a bit like March 2013. Some ninja snow events possible maybe?. Such a pity the -NAO is so west based. Wouldn't mind a last snow event but the lack of sun and warmth is starting to bother me..


  • Registered Users Posts: 7,806 ✭✭✭Calibos


    sryanbruen wrote: »
    Seems to me that we're going into a March 2013-esque scenario here, southerly tracking jet stream, northern blocking, warm stratosphere, low pressure invading from the south. I think nature is trying to tell us something!

    That the Jetstream will eventually rebound to the other extreme and we'll have a fantastic Azores High Summer like 2013? ;):D


  • Advertisement
  • Registered Users Posts: 6,948 ✭✭✭pauldry


    Firstly I still think by the charts we dont see 10c until Paddys Day....after this charts signal much milder 14 or 15c

    Secondly the North will probably see more snow in March seeing the charts
    .
    Third sligo is certain to see heavy hail some day before end of March that causes another "white morning" based on charts

    I dont believe winters left us just yet but Emmageddon wont be repeated


  • Registered Users Posts: 14,409 ✭✭✭✭M.T. Cranium


    In scoring the February forecast contest, I found that the monthly sunshine for February was 150% of normal over the grid and probably close to 200% of normal values in the northwest. The month ended up somewhat drier than average as this snowfall event only got off to a sporadic start on the 28th and the week before that was essentially dry. The mean temperature for the month was about 2 deg below normal but was closer to 1 deg below normal as late as the 22nd. If February had been a 30 day month it would have been a bit less sunny, close to normal in precip, and about 3 deg below normal.

    The CET record goes back a long way (daily records to 1772) and the records for 28 Feb and 1 Mar were set in 1785, very similar to readings this year. Monthly precipitation values are also available. So that got me to checking, what sort of year was 1785?

    Here's the overview including the run up to those cold values (England and Wales precipitation is also available, no telling how much of the precip was snow from these records however) ...

    JAN 1785 _ After quite a cold December (1784) (mean 0.3 C) and first week of January, the rest of January turned quite mild, the month averaged 3.4 but in those days not a particularly cold January, the mildest days were around 8 C from 17th to 21st. It was not a wet January but in the lower part of the average range, total of 50 mm.

    FEB 1785 _ With the start of February, the weather turned very cold and stayed that way all month. It was dry like most cold months, with just 35 mm but that could have meant 35 cm of snow or a large fraction of that over the region. The average was only 0.4 C (same as December had been) so this was overall quite a cold winter. The coldest day was the 20th of February which set a daily record, a mean of -6.6 C. It stayed cold to mid-March and as I mentioned the reason for this report was that 28th (-3.8) and 1st of Mar (-3.5) set daily records also. The record for the 28th has been retained (2018 came in at -3.6) and provisionally the record for 1st of March was tied, that may change in the final figures at month's end.

    MAR 1785 _ There was no real warming at all in March 1785. Following the record cold on the first, the month was second coldest March on record with an average of 1.2 C. All but one day averaged below zero from 7th to 13th. Very low values were recorded 21st to end of the month including more records of -0.3 (28th) and -0.7 (29th). This was an exceptionally dry March, and I am guessing the 19 mm precipitation meant 10-15 cm of snow and a bit of rain, but we can't be sure about that.

    APR 1785 _ The severe cold persisted to 2 April then it turned a lot warmer and the month averaged 8.4 C which is slightly above the average in those decades. Most days had means near 10 C or higher, the average would have been well above 9 discarding the first three days. The very dry spell continued and worsened, in fact April had a mere 10 mm of rain and was about fourth driest in the 252 years of record. This would indicate that the blocking pattern that gave the cold Feb and Mar persisted but winds came from a warmed continent or perhaps the block dropped further south. Because of these three dry months, the year was well below average and ranked 9th driest out of 252 years, drier than any year in the past fifty even 1975 or 1976.

    MAY 1785 _ May probably allowed farmers to catch up as it was quite a warm month that averaged 12.3 and there were days towards the end that were almost summer-like at 17 C. The drought persisted too although the rainfall did manage to produce 26 mm on average (in England and Wales).

    JUN 1785 _ This was quite a warm month also, averaging 16.1. It was close to heat wave conditions at the end of June with daily means around 19 C. The weather continued relatively dry with 45 mm of rain. The first half of the year was considerably drier than the more normal second half.

    JUL 1785 _ July was more average but pleasantly warm most days with a few towards the end reaching 19.5, the average for the month was 16.1. There was no severe heat during this summer, the warmest day (19.5) is about 1.5 deg below the average for that statistic long-term. However, the drought began to fade with a rainfall average of 62 mm.

    AUG 1785 _ The summer had peaked early and August was a rather chilly 13.9 C on average. The 26th to 28th averaged only 11.0 C. There was no real warm spell the entire month. It was also a wet month that averaged 119 mm of rain. The harvest must have been quite stressed with the cold late start, the dry spring and early summer, and then this change to poor ripening conditions.

    SEP 1785 _ Most of September turned quite warm and averaged 13.6 but more like 15 for the first three weeks and about 8 for the last five days. The month continued the August wet regime with 105 mm, a bit above average.

    OCT 1785 _ The cooler turn at the end of September persisted for most of October which averaged only 8.7, about a degree below average even in cooler times than now. The first half was relatively mild (around 10 C) but the second half brought some wintry outbreaks, and the mean on the 26th was only 1.5 C. There was a rather normal precipitation of 99 mm but perhaps some was snow given the cold readings in late October.

    NOV 1785 _ This was quite a typical November with fluctuating temperatures that averaged 5.6 C. Some days near the end of the month were close to zero. The precipitation was a bit below average at 67 mm.

    DEC 1785 _ This was generally a rather cold month, the average being 2.8, and the first day sub-zero for CET mean (-0.1). A deeper cold spell set in before Christmas and lasted in the new year, 3 Jan 1786 had a non-record but very cold mean of -7.6 C. The rest of this winter was quite variable with further severe cold spells after some very mild weather in mid-January. There may have been some heavy snowfalls given that the average precipitation in December was 81 mm and many days close to or below freezing. Jan 1786 was also quite wet and some of that may have been heavy snow too.

    So it's interesting that the year most similar to 2018 in the timing of this severe cold spell had a long episode of blocking, spring warmth and a reversal to a wet end of summer and back into the deep freeze without much hesitation the next winter.


  • Closed Accounts Posts: 1,997 ✭✭✭gally74


    ZX7R wrote: »
    I am really looking forward to reading, post snow 2018 analysis of charts all models, from the more experienced posters than I, looking forward to expanding my knowledge even more.
    Thanks to all for there very informative and interesting posts

    I'd like to thank the folks who called this


  • Banned (with Prison Access) Posts: 9,005 ✭✭✭pilly


    I'd like to add my thanks to all the very knowledgable posters on here too.

    Helped me as someone who lives alone to be very well prepared way before the panic set in.

    Also won a tenner off one the pompous asses going around saying "nah, not gonna happen".

    Win win.


  • Registered Users Posts: 1,339 ✭✭✭OneEightSeven


    Would Emma be characterised as a blizzard or a snowstorm?


  • Registered Users Posts: 6,077 ✭✭✭Elmer Blooker


    Would Emma be characterised as a blizzard or a snowstorm?
    .... a let down?
    Funny how I was envious of people in places like Lucan, Celbridge, Sallins etc the other day. I'm not envious now! They will have to look at this disgusting slushy mess for a lot longer than me.
    It was more or less a three day event, a thaw set in as soon as the last flakes fell so if that isn't a let down then I don't know what is. Definitely more '87 than '82. And by the way, the "sun is too strong for snow to lie in March" argument is total nonsense. Its ALWAYS a rise in air temperature that prevents snow lying in Ireland for more than a few days. It just shows how exceptional 2010 was.
    PS. I think in future we'll have to look to Greenland for a prolonged cold spell as Scand highs only last a couple of days.


  • Registered Users Posts: 251 ✭✭littlema


    gozunda wrote: »
    Many of the existing weather stations are located along or adjacent to the coastline - there are significant inland areas which have little or no coverage with the result that weather variables are under reported imo.

    MapMonData.png


    Most notable block imo is Limerick Mid / South Tipperary Kilkenny Waterford with existing weather stations being outliers outside this area. There is also a huge block of Kerry and Cork which has no significant coverage. Given the varied terrain and topography of these areas I believe a dearth of weather stations is a significant issue with recording weather data.

    Could the station at Markree get an upgrade.... there seldom seems to be any reliable info from this area and Finner & Knock are just too dissimilar to be of any use ?


  • Registered Users Posts: 13,540 ✭✭✭✭sryanbruen


    Calibos wrote: »
    That the Jetstream will eventually rebound to the other extreme and we'll have a fantastic Azores High Summer like 2013? ;):D

    Yes please!!

    I think the Canadian Warming impacts on the troposphere need a lot of monitoring as we could either go into a northerly or northeasterly (as the most favourable scenario in my opinion) or a mild, zonal pattern with the Polar Vortex getting itself together. The latter has a very low chance due to the state of the zonal winds.


  • Registered Users Posts: 15,944 ✭✭✭✭Villain


    .... a let down?
    Funny how I was envious of people in places like Lucan, Celbridge, Sallins etc the other day. I'm not envious now! They will have to look at this disgusting slushy mess for a lot longer than me.
    It was more or less a three day event, a thaw set in as soon as the last flakes fell so if that isn't a let down then I don't know what is. Definitely more '87 than '82. And by the way, the "sun is too strong for snow to lie in March" argument is total nonsense. Its ALWAYS a rise in air temperature that prevents snow lying in Ireland for more than a few days. It just shows how exceptional 2010 was.
    PS. I think in future we'll have to look to Greenland for a prolonged cold spell as Scand highs only last a couple of days.

    Seeing loads of these types of reports, confusing IMBY with a general view. I’ve spoken with many farmers who had said it was worse than 82 with drifts much higher and thaw is slow enough.


  • Registered Users Posts: 10,572 ✭✭✭✭MJohnston


    .... a let down?
    Funny how I was envious of people in places like Lucan, Celbridge, Sallins etc the other day. I'm not envious now! They will have to look at this disgusting slushy mess for a lot longer than me.
    It was more or less a three day event, a thaw set in as soon as the last flakes fell so if that isn't a let down then I don't know what is. Definitely more '87 than '82. And by the way, the "sun is too strong for snow to lie in March" argument is total nonsense. Its ALWAYS a rise in air temperature that prevents snow lying in Ireland for more than a few days. It just shows how exceptional 2010 was.
    PS. I think in future we'll have to look to Greenland for a prolonged cold spell as Scand highs only last a couple of days.

    You're confusing Storm Emma with the cold spell here. The question was about Storm Emma.


  • Advertisement
  • Registered Users Posts: 13,540 ✭✭✭✭sryanbruen


    March 3 2018, another day of snow covered ground across the board.

    ZNMTQkf.gif


  • Registered Users Posts: 6,077 ✭✭✭Elmer Blooker


    MJohnston wrote: »
    You're confusing Storm Emma with the cold spell here. The question was about Storm Emma.
    Fair enough, point taken. But I think I can speak for the majority posters in the weather forum and most wanted a cold spell and not a cold snap. Sure, many are happy just to watch snow fall or play around with their kids who may not have seen snow before but those of us, the regulars who pore over charts must be disappointed after the SSW and synoptics that we haven't seen in years!
    The golden rule in Ireland for snow to lie is for clear skies and not cloud cover. (as in 1982, first week of March 2001 and 2010)


  • Registered Users Posts: 9,786 ✭✭✭wakka12


    sryanbruen wrote: »
    March 3 2018, another day of snow covered ground across the board.

    ZNMTQkf.gif

    Surprised by that map
    I thought an easterly travelling across the continent to us would have meant north germany/nort and west france and the benelux nations would have the same or more snow than us
    Italy seems to have higher percentage of its country under snow in that picture than germany!


  • Registered Users Posts: 8,219 ✭✭✭Gaoth Laidir


    wakka12 wrote: »
    Surprised by that map
    I thought an easterly travelling across the continent to us would have meant north germany/nort and west france and the benelux nations would have the same or more snow than us
    Italy seems to have higher percentage of its country under snow in that picture than germany!

    The air was so dry and stable that the only snow that fell across Poland and Germany was along the Baltic and North Sea coasts. For the rest it was just brutally dry cold.


  • Registered Users Posts: 8,219 ✭✭✭Gaoth Laidir


    @Elmer, yes, air temperature does affect snow melt, but so does daytime insolation, even in the overcast conditions we had. Daylight is almost 4 hours longer now than at the beginning of January and insolation almost 50% more. I noted during the day on Friday that my a layer on my car was turning liquid despite the temperature being -2 °C. This insolation also accelerates sublimation.

    Just after the big fall in '82 the sun was out but there was little melt. Yes, this then let temperatures nosedive at night, but you can't negate the increased effect the sun and length of day has at this time of the year compared to 2 months ago.


  • Registered Users Posts: 10,572 ✭✭✭✭MJohnston


    Well the cold spell looks like it will continue from the models being posted, we're just getting a short thaw in before that happens. Frankly I'm glad of it - I really enjoyed Tuesday to Friday when there was constant lying snow in my location, but it was the type of snow depth that just made for a complete shutdown and I didn't really fancy it going on much longer. 2010 was easier to deal with being prolonged as there wasn't really very much snow and roads and streets could reopen fairly quickly. Here, without the thaw, I think the street would have been closed for another week.

    I don't imagine many model watchers are too disappointed either - we witnessed an historic weather event, and were able to predict and track it from a week out.


  • Registered Users Posts: 1,991 ✭✭✭Artane2002


    The cold weather wasn't a let down at all here. Exceptionally cold for the time of year and a lot of snow. We've always known that it wasn't going to last long so I don't see how it's disappointing if we already knew that it was going to be brief Also for those in the west, you were supposed to get virtually no snow so it should have exceeded the westerners' expectations.


  • Registered Users Posts: 1,591 ✭✭✭gabeeg


    MJohnston wrote: »
    I don't imagine many model watchers are too disappointed either - we witnessed an historic weather event, and were able to predict and track it from a week out.

    3 weeks ago I was f5-ing the GFS's FI charts looking for signs of impact from the SSW. An easterly was depicted, and eventually made its way here.

    Obviously there was wild variations from run to run, but it was an incredible few weeks of model watching.
    Such a strong background signal - a loose plot on which to hang this snowy story.


  • Registered Users Posts: 4,680 ✭✭✭SleetAndSnow


    gabeeg wrote: »
    3 weeks ago I was f5-ing the GFS's FI charts looking for signs of impact from the SSW. An easterly was depicted, and eventually made its way here.

    Obviously there was wild variations from run to run, but it was an incredible few weeks of model watching.
    Such a strong background signal - a loose plot on which to hang this snowy story.

    It definitely was a very intense few weeks of model watching. There were points where everything was perfect then one model would change and boom you start to feel a mass of disappointment incase the other models follow suit, but the next model run ends up being better then the last. Ups and downs and ups and downs! :)


  • Advertisement
  • Registered Users Posts: 9,233 ✭✭✭sdanseo


    Quick question about ensembles and the various member runs in models.

    Just taking the GFS for example, there are 20 different members in each run. Then a control and an operational.

    Is the operational simply the mean or most likely result calculated from the 20 taken together?

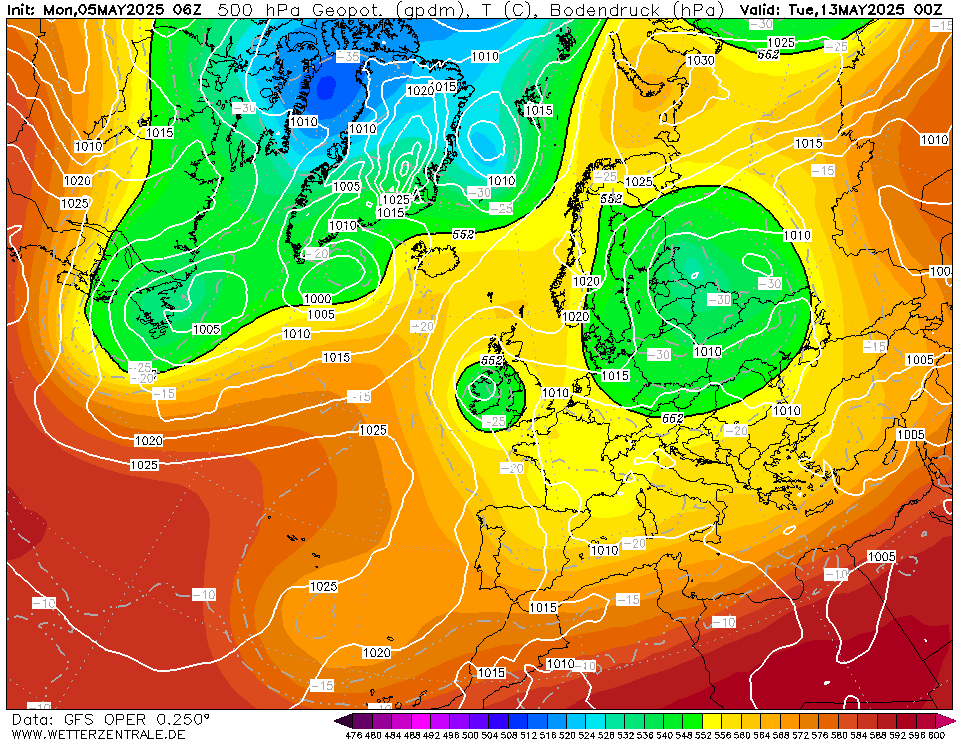
    e.g. GFS OP 6Z today for Monday week, which is cold eastery:

    GFSOPEU06_186_1.png

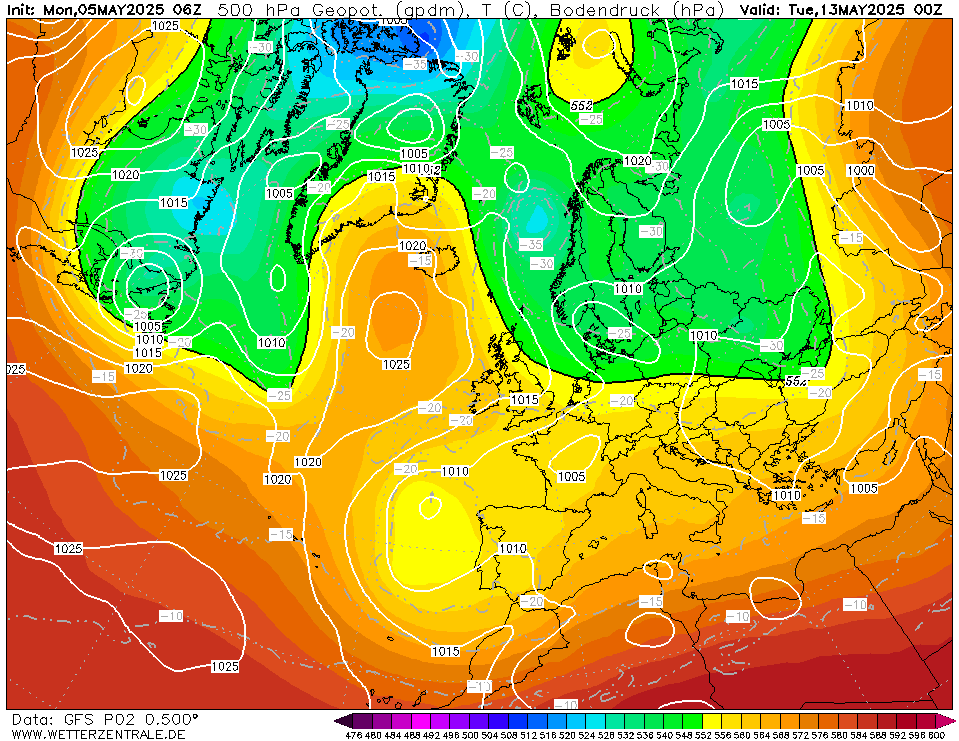
    And the 2nd Member showing totally different, much deeper easterly (don't sell the snow shovels yet):

    GFSP02EU06_186_1.png


This discussion has been closed.
Advertisement