Advertisement
If you have a new account but are having problems posting or verifying your account, please email us on hello@boards.ie for help. Thanks :)
Hello all! Please ensure that you are posting a new thread or question in the appropriate forum. The Feedback forum is overwhelmed with questions that are having to be moved elsewhere. If you need help to verify your account contact hello@boards.ie
Hi there,
There is an issue with role permissions that is being worked on at the moment.
If you are having trouble with access or permissions on regional forums please post here to get access: https://www.boards.ie/discussion/2058365403/you-do-not-have-permission-for-that#latest

GAA football - historical trends

  • 01-11-2021 11:20am
    #1
    Registered Users, Registered Users 2 Posts: 990 ✭✭✭


    I have 2 sets of data which might help to keep us entertained for the winter months.

    The first dataset contains the results of the vast majority (>99%, 12,565 games in total) of inter-county NFL and SFC games since 1887. The original dataset included the date, competition, province or league division, teams involved, score line and venue for each game. To this, I have pulled out data by totals (total score, goals, points) and by winning, losing and drawing teams (e.g. most points scored by losing team, most goals scored in a drawn game...........).

    The second dataset is the one that I have constructed for the GAA football ranking table. This has the rating score and ranking place of each team for all games since 1926.

    If anyone has hypotheses they want tested, or any data that they would like to see, please feel free to add a request and I'll do my best. I have a few ideas but it would be great if others got involved!

    As an example, see my post below.


Comments

  • Registered Users, Registered Users 2 Posts: 990 ✭✭✭laoisman11


    I have been amazed at some of the hurling scorelines in the last 12-24 months, with teams regularly posting 25+ points per game, and I have a vague memory of hearing that Limerick had 55 shots on goal in one particular game.

    I was interested to see what the evolution of scoring in football looks like, so I had a delve into the data.

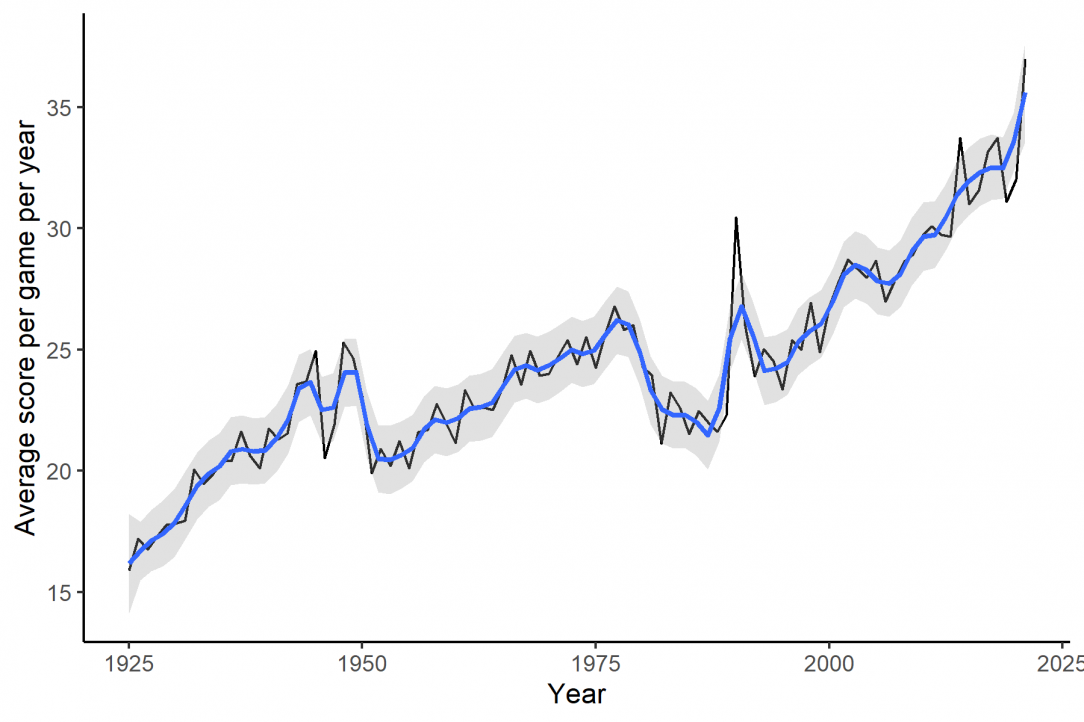
    First of all, I pulled out total scores per game. The graph below shows the average score per game per year since 1926 (I chose years where there were at least 25 games across league and championship for the results to be meaningful). The blue line is the smoothed average scores with the shaded area the standard error, while the black line is the actual average score.

    My first impression after looking at this was to say that yes, clearly the total score has been increasing since 1926, but that there were some peaks and troughs that looked quite strange. To go further, I broke it down to average goals and average points per game.........

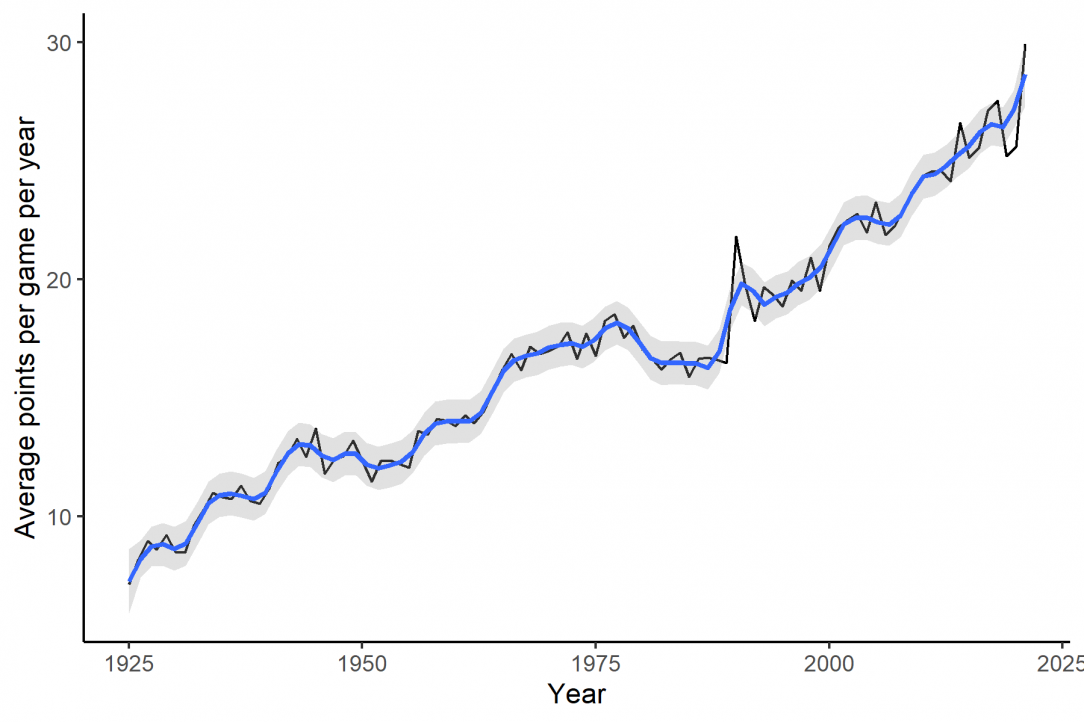
    This really helps to shed more light on the evolution, as it seems that there has been an almost linear increase in average points per game scored per year (with a stagnation during the '80s until something caused a spike in 1990).

    The average goals scored looks more complicated to explain - there seemed to be a trend towards an increase up to the late 1940s, and since then, average goals per game declined, reaching a minima of 1.5 goals per game in 1995. There was a major outlier in 1990 with 2.9 goals per game being scored. There seemed to be a lull after 1995 until recently - over the last 8 years, there has been an average of 2 goals or more per game.

    I'm having difficulty to understand what might have driven these changes. I thought of the 80 minute championship games which was in place from 1970 - 1975 (previous to this, championship games lasted 60 minutes) but this doesn't look like it had a huge effect). Another factor that might have an overall affect is that extra-time was not a thing in the days of old (I don't even know when extra-time came in).

    Anyone got any insights?


  • Registered Users, Registered Users 2 Posts: 112 ✭✭PhillySteak9


    Couple of thoughts:

    Points - do you have any info on points scored from frees vs. from play? I would wager there are more frees now, which tend to be converted for points. Also, not uncommon in the last 10 years for 45's to be pointed.

    Goals - Adoption of blanket defence could have caused decrease in 2010's. Introduction of black card may have resulted in more goal chances subsequent to that.


  • Registered Users, Registered Users 2 Posts: 990 ✭✭✭laoisman11


    No, I don't have the data on scores from play vs from frees and it would be interesting to look at this aspect. I would wonder if there are more frees now compared to 30-40 years ago. Or even to earlier days - in the recesses of my memory, I remember that a Laois man held the record for quite a long period of time for top scorer in a Leinster final - 8 points, all from frees.


  • Registered Users, Registered Users 2 Posts: 3,019 ✭✭✭TCDStudent1


    Was there some rule change around 1990 related to the amount of time the ball was in play? It came about as a result of them calculating how much time the ball actually was in play during the 1988 or 1989 final? I can't remember the details but I vaguely remember it being mentioned on the GAA Hour.


  • Registered Users, Registered Users 2 Posts: 990 ✭✭✭laoisman11


    If there was, I don't remember.....One thing that might have had an effect were the years where they scrapped the divisions in the league and had 4 groups of relatively equal strength. I remember Kilkenny getting some right hammerings at the time. I will split out the above into league and championship when I get some time over the weekend.


  • Advertisement
  • Registered Users, Registered Users 2 Posts: 1,985 ✭✭✭WesternZulu


    Would line balls and frees being allowed to be taken from the hand instead of on the ground have caused the increase in scores around 1990?

    The ball would be in play for a longer period over the course of a game and defenses had to get used to having less time to organise themselves.

    Looking back on old footage it's incredible how line balls and free's off the ground slowed up the game and allowed players a breather.


  • Registered Users, Registered Users 2 Posts: 2,709 ✭✭✭thesultan


  • Registered Users, Registered Users 2 Posts: 3,019 ✭✭✭TCDStudent1


    I think that was the rule change I was referring to. Cant think of what else it could possibly be. The GAA Hour had the exact timings of how long the ball was in play for the final and that triggered them to introduce that rule.


    Whether it would have the impact on the data that the OP shared, I have no idea. But it was a fundamental change to the game at the time (and I think coincides with the change in data of the OP).


  • Registered Users, Registered Users 2 Posts: 990 ✭✭✭laoisman11


    So I split the data into league and championship.........


    Relatively little difference between league and championship in terms of goals scored, except for 1977 and 1978 where there was a huge spike in goals scored. Hard to understand what drove this, but 1977 will be remembered for 8 goals being scored in the Dublin-Armagh final, and the first round of the 1978 championship also delivered 8 goals (Carlow 5-08 Westmeath 3-09). Carlow leaked 6 goals to Dublin in the following round and scored 2 themselves. The spike in goals scored in 1990 could possibly be explained by the increased time the ball was in play as mentioned by @TCDStudent1 and @WesternZulu above, with teams quickly correcting this exuberance in the following years.

    In terms of points, the drier ball is surely the explanation for the difference between SFC and NFL over the years. Results from 2021 showed little difference between league and championship - time will tell if this is a trend or a once-off, possibly due to more open games during the Covid-induced empty stadiums.

    The increase in number of points during the 80-minute trial (1970-1975) is evident, and this higher scoring rate appears to have remained for a few years before dying back in the '80s. There is definitely an increase in the number of points scored from the early 1990s. This could also be explained by the additional time the ball was in play, which likely manifested as extra goals in the first year, followed by a greater focus on avoiding conceding goals at the expense of conceding additional points.


  • Registered Users, Registered Users 2 Posts: 26,209 ✭✭✭✭Strumms


    I agree with this.... the free taker could waste 40 - 60 seconds between placing the ball, lining up the shot or pass...and how many frees are in the game.... ? quite a lot .. a really positive move... and no doubt a catalyst in addition to overall skill improvements to great numbers of scores


  • Advertisement
  • Registered Users, Registered Users 2 Posts: 1,054 ✭✭✭thefa


    Not surprised with the growth in total scores through points in the last decade or so. Feel like there’s been more emphasis on scoring efficiency among the top teams and tactics are evolving to allow that.

    I feel like the gap between the best teams and worst has grown and even between the best and middling teams which must be contributing. Are you able to visualize the average winning margin with the data?


  • Registered Users, Registered Users 2 Posts: 26,209 ✭✭✭✭Strumms


    players are now much fitter, much faster, skill sets across the board are higher... tactics have evolved from the above... speed and fitness....

    tactics wise you’d you’d be looking at a much more fluidly designed attacking lineup with a heavier 4 man half forward line. Runners a plenty, no more Hail Mary.


  • Registered Users, Registered Users 2 Posts: 1,054 ✭✭✭thefa


    Definitely. I think the increased athleticism and tactical approach across the board lends itself more to creating scoring chances than denying them. Would suspect the scoring impact off the bench would have been improving over the years also.


  • Registered Users, Registered Users 2 Posts: 990 ✭✭✭laoisman11


    Yes!

    And a zoom in to more recent years...........


  • Registered Users, Registered Users 2 Posts: 7,666 ✭✭✭tritium


    That winning margin graphic is interesting. Unsurprisingly the volatility of the championship is much higher than the league. A lot of cyclicality in there, I wonder is that reflective of periods with two or three very strong teams compared to the rest, which would result in big mismatches at provincial level. Most interesting is that the long run average seems relatively flat with typically peaks being followed by a move back into the pack, possibly reflecting the decline of a dominant team?


  • Registered Users, Registered Users 2 Posts: 990 ✭✭✭laoisman11


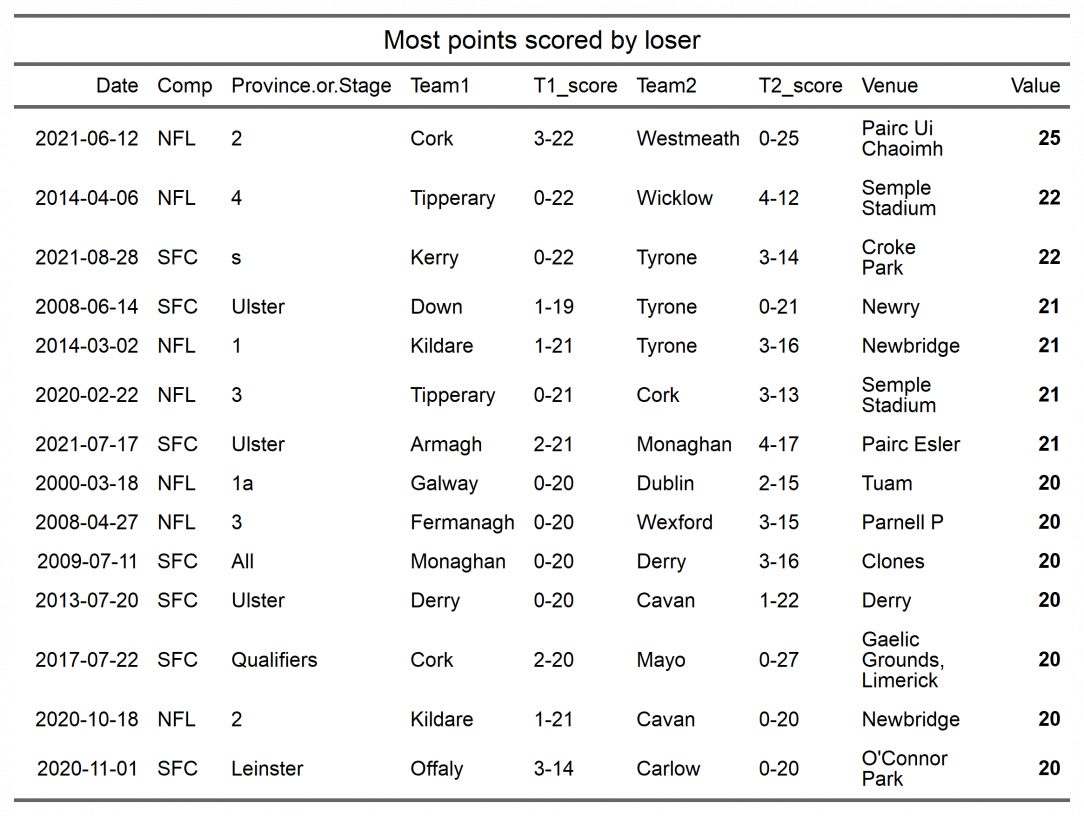
    Some more data that I extracted.........I have limited each table to the top 10 but if the 11th or 12th game has a similar value to the 10th, they are also included........


  • Registered Users, Registered Users 2 Posts: 990 ✭✭✭laoisman11


    I had to cut this one as there were about 50 games where the losing side had scored 4 goals. As shown in the graphs in previous posts, goals appeared easier to come by in the earlier days of GAA.

    This table needs to be read in the context that in some of these games, the game went to extra time, so the loser had longer to build up a score.

    Idem for this table, if the game went to extra time, the loser had longer to build up a score. Interesting that only 2 of the games came before 2014!


  • Registered Users, Registered Users 2 Posts: 990 ✭✭✭laoisman11


    As above, extra-time may have "inflated" the highest score of the winning team.......


Advertisement