Advertisement
If you have a new account but are having problems posting or verifying your account, please email us on hello@boards.ie for help. Thanks :)
Hello all! Please ensure that you are posting a new thread or question in the appropriate forum. The Feedback forum is overwhelmed with questions that are having to be moved elsewhere. If you need help to verify your account contact hello@boards.ie
Hi there,
There is an issue with role permissions that is being worked on at the moment.
If you are having trouble with access or permissions on regional forums please post here to get access: https://www.boards.ie/discussion/2058365403/you-do-not-have-permission-for-that#latest

Marathon V 10,000 times

  • 20-01-2015 11:31pm
    #1
    Registered Users, Registered Users 2 Posts: 5,148 ✭✭✭


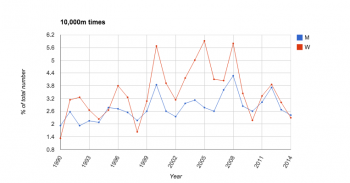
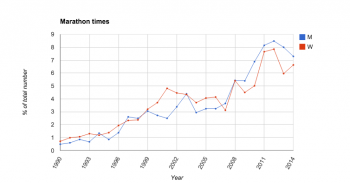
    So from the times listed on http://www.alltime-athletics.com/ I had a look at the best mens and women marathon and 10,000m times since 1990. I created a graph of each to express the amount fast times that year as a percentage. For example if there was 100 times of the all time marathon list and 10 of those were run in 2014 then 2014 would be 10%.

    So on the left you can see that 10,000 meter performances per year is pretty flat with a peak at or before a WC or olympics. About 3.2% per year is the average amount of top performances per year. Women from 1999-2009 had a big spike that has gone back down now. WADA introduced the biological passports in 2009.

    All this seems easy to understand and it shows that the introduction of the biological passport has had an effect on the event.

    The graph on the right is the same data for top marathon times over the same period. We are heading for 9% of mens best times happening in a single year and womens times not too far behind.

    I have other graphs that I can't share as it would be breaking the rules but there does seem to be a pattern of some seasoned marathon runners running quite normal times 5-10 years ago and are now running at least 5 - 10 minutes quicker. Now this sort of performance increase on the individual athlete could be seen as due to better training but the pattern it seems to take is that at 2008/9 many people get better by a the times suggested above. The spike since 2008 is big. Rita Jeptoo (currently banned) is an example of this with having a PB of 2:24:22 (2005) up to 2012 and then going and running 2:19:57 in 2013. http://www.iaaf.org/athletes/kenya/rita-jeptoo-sitienei-132798#progression

    Perhaps you can discount this as due to x,y,z. The strength and depth of runners for x,y,z or how popular the marathon has got and as only 3 can normally make a team for a championships is why the 10,000 times have not seen the same increase.

    I would be interested in people's thoughts regarding the big picture of elite marathon running.

    3ca84b383232309.jpg 15d75e383232311.jpg


Comments

  • Closed Accounts Posts: 542 ✭✭✭Netwerk Errer


    I feel that those graphs are critically flawed in an anti-doping and performance sense. They cannot be used as you have to support the effectiveness of the biological passport. It's only a single data point and doping and across era performances contain countless intangibles. In the 10000m, Look at it this way, if a new training theory or drug came along in the 90's and caused a spike in the graph and science of performance plateaued since, you set a high bar in that era for the next athletes to come along in the 00's. By the next era setting more top performances, the probability for the next era to break into the all time list becomes progressively smaller if there are no breakthroughs in training or medicine.

    Add to the fact that the 10,000m is pretty much obsolete in International athletics now. It's only run at a very high level at PRE, World Championships and the Olympics. The last two being tactical races only leaves PRE as a time-trial with a small field which makes the probability even smaller.

    I also feel that you have contradicted yourself on the Biological passport . You used the 10,000m performances percentages to validate that the BP was effective but wouldn't that logic lead you to believe that it was ineffective by looking at the Marathon graph?

    The intangibles are too vast for this to hold any reference. It's all just speculation.


    Here is a graph that shows the impact of testing and the BP on doping.

    Screen-shot-2011-03-20-at-7.18.png

    All of those tests are extreme positives. Normal reticulocyte (immature red blood cells) levels are between .5-1.5% but can naturally lie outside of this range. Pre-urine test with a lot of green indicates heavy EPO use. Between urine test and BP, pink and purple suggest a change to in methods towards transfusions and micro dosing.

    The introduction of the BP definitely had an effect on athletes behaviour. Is it proof that doping isn't as prevalent in sport since the introduction of a urine test and the BP? No. It shows a reaction to it's implementation but what is the reaction. Have a lot of athletes stopped doping since? Maybe. Or have athletes just adjusted to the test? Maybe.


    The problem with the BP now is that it is indirect in it's detection. It doesn't prove anything. Because it is indirect, the testers have to set a probability limit where these blood levels wouldn't occur in an undoped athlete to reduce the risk of banning an athlete for a false positive. The probability limit is 99.9% or 1 in 1000 chance of a false positive.

    That limit has to be so large to prove you're not doping that you could be under that limit and be doping. It only proves innocence and catches heavy users. My main issue with the BP is the way it's pushing out traditional direct substance tests. The BP has a very shakey reputation in forensic medicine and legal terms because of the amount influences that can effect the results. Jonathan Tiernan Locke's famous binge drinking excuse being one. The BP is a useful tool but it should not replace the evidence of direct substance test. The legality of bans relating to BP positives is questionable with all these factors and wouldn't stand up in an independent court. There is a case of prosecutors fallacy involved in issuing bans on it's back alone.

    Tyler Hamilton's admission of how they beat the BP shows just how flawed it is. He said the riders would microdose EPO(half life of 4 hours) while reinfusing blood. The EPO would create new reticulocytes to balance the off-score while old blood cells were reinfused. It was that easy.


  • Registered Users, Registered Users 2 Posts: 5,148 ✭✭✭rom


    I know the marathon graph seems to discount the effectiveness of the BP but thats my point. It looks the it had the opposite effect on marathon performances.


  • Registered Users, Registered Users 2 Posts: 159 ✭✭Run and Jump


    Perhaps marathon running, especially the pay-days of big city races and the majors, is now more financially rewarding for the best Kenyans and Ethiopians who in previous years may have focused on the track instead.


  • Registered Users, Registered Users 2 Posts: 5,148 ✭✭✭rom


    Perhaps marathon running, especially the pay-days of big city races and the majors, is now more financially rewarding for the best Kenyans and Ethiopians who in previous years may have focused on the track instead.
    I would expect to see a trail off in 10000m performances then over the period but that has not happened much since 1990.


  • Closed Accounts Posts: 542 ✭✭✭Netwerk Errer


    rom wrote: »
    I know the marathon graph seems to discount the effectiveness of the BP but thats my point. It looks the it had the opposite effect on marathon performances.

    But does the marathon discount the effectiveness of the BP? No, it doesn't. Does the 10,000m prove the effectiveness of the BP? No. You're creating that link yourself without any evidence in the graph to back it up. The graphs show nothing more than when the best all-time times were run and trying to reach a conclusion on the reasons with that single data point is just speculation.

    Using it alone will only lead to confirmation bias where each person will see only what they want to see. Statistics are supposed to rule out bias and that is why conclusions cannot be drawn from performances alone. The sheer number of variables make it impossible.

    Improvements in training theory, economic factors, genetic predispositions, numbers competing, competition, new drugs, weather, and countless and countless other variables all in one combination exist to make up performance which make it unquantifiable and make it impossible to know the conclusion from an outside perspective. You have to be able to see all of the evidence to draw a clear and correct conclusion and that's why I feel you misused statistics in this case. Performance alone cannot be used to discuss the effectiveness of the BP whether that be a positive/negative influence. You could use those graphs to debate the topic in any way you want.

    But, I'll give my opinion on the performances. Money, athletes are moving straight to the marathon and skipping the track now. Wanjiru seemed to lead the way in this march away from the track at a young age. So, what you effectively have now is more athletes competing and for longer because they started at a younger age. The days of running track for their 20's and changing to the marathon at 30 are gone. More athletes in the marathon means less athletes in the 10,000m thus weakening the depth on the track so the volume of top performances drop. More athletes in the marathon means more depth and a higher volume of top performances. The more people competing, the higher the probability that more will be top performers.

    Less people ran the marathon back in the 90's and early 00's. Say for instance that you have 2 marathons. One with 5000 runners and the other with 1000. Probability suggests that the larger marathon will have more top performers in numbers even if the relative percentages of top performers per race is identical. If .1% of both races have all time top 100 times, the larger race will have 5 all time top 100 performance's and the smaller race has one.

    Then, it's 5% to 1% of all time times. Of course, this is all hypothetical but you get the idea.


  • Advertisement
  • Registered Users, Registered Users 2 Posts: 5,148 ✭✭✭rom


    But does the marathon discount the effectiveness of the BP? No, it doesn't. Does the 10,000m prove the effectiveness of the BP? No. You're creating that link yourself without any evidence in the graph to back it up. The graphs show nothing more than when the best all-time times were run and trying to reach a conclusion on the reasons with that single data point is just speculation.

    Using it alone will only lead to confirmation bias where each person will see only what they want to see. Statistics are supposed to rule out bias and that is why conclusions cannot be drawn from performances alone. The sheer number of variables make it impossible.

    Improvements in training theory, economic factors, genetic predispositions, numbers competing, competition, new drugs, weather, and countless and countless other variables all in one combination exist to make up performance which make it unquantifiable and make it impossible to know the conclusion from an outside perspective. You have to be able to see all of the evidence to draw a clear and correct conclusion and that's why I feel you misused statistics in this case. Performance alone cannot be used to discuss the effectiveness of the BP whether that be a positive/negative influence. You could use those graphs to debate the topic in any way you want.

    But, I'll give my opinion on the performances. Money, athletes are moving straight to the marathon and skipping the track now. Wanjiru seemed to lead the way in this march away from the track at a young age. So, what you effectively have now is more athletes competing and for longer because they started at a younger age. The days of running track for their 20's and changing to the marathon at 30 are gone. More athletes in the marathon means less athletes in the 10,000m thus weakening the depth on the track so the volume of top performances drop. More athletes in the marathon means more depth and a higher volume of top performances. The more people competing, the higher the probability that more will be top performers.

    Less people ran the marathon back in the 90's and early 00's. Say for instance that you have 2 marathons. One with 5000 runners and the other with 1000. Probability suggests that the larger marathon will have more top performers in numbers even if the relative percentages of top performers per race is identical. If .1% of both races have all time top 100 times, the larger race will have 5 all time top 100 performance's and the smaller race has one.

    Then, it's 5% to 1% of all time times. Of course, this is all hypothetical but you get the idea.

    I would agree you in relation to male marathon times the increase in performances in womens times is the same even though the depth of women's marathon running over the same period has not increased by the same. Even though prize money is the same the same financial benefits are not there for women. Take this years London. The focus is on the men's.


Advertisement