Advertisement
If you have a new account but are having problems posting or verifying your account, please email us on hello@boards.ie for help. Thanks :)
Hello all! Please ensure that you are posting a new thread or question in the appropriate forum. The Feedback forum is overwhelmed with questions that are having to be moved elsewhere. If you need help to verify your account contact hello@boards.ie
Hi there,
There is an issue with role permissions that is being worked on at the moment.
If you are having trouble with access or permissions on regional forums please post here to get access: https://www.boards.ie/discussion/2058365403/you-do-not-have-permission-for-that#latest

A Beginner's Guide To Reading Storm Charts?

  • 25-02-2013 2:20pm
    #1
    Registered Users, Registered Users 2 Posts: 845 ✭✭✭


    The thread Su Campu created about reading winter charts is a great thread and a great idea, I'm far from an expert and I'm learning bits here and there.

    Would anyone be interested in creating a thread for reading storm charts and the charts relating to storms?

    I'm sure I'd not be the only one who would love this.:confused:


Comments

  • Registered Users, Registered Users 2 Posts: 845 ✭✭✭tylercollins


    6 people willing to give lots of love if someone could create a guide similar to Su Campu's one.


  • Closed Accounts Posts: 3,548 ✭✭✭Harps


    Wouldn't be a bad idea to have a quick guide for a few of our more interesting weather types, storms, thunderstorms, heatwaves etc

    I'm far from an expert but the basics to look out for on the model charts is straight forward enough so I'd be happy to pitch in. Maq (if he returns) or weathercheck would probably be your best bet for the more technical stuff in forecasting storms and Ian know his stuff for thunderstorms


  • Registered Users, Registered Users 2 Posts: 845 ✭✭✭tylercollins


    Thanks Harps! Ian sent me a message on Facebook there and said if he gets time he's going to help as well.

    But yeah, I agree it would be nice to have like a beginners section on here as well!


  • Registered Users, Registered Users 2 Posts: 5,068 ✭✭✭Iancar29


    Right so - i'll try share the stuff that i have learnt myself from the pros whilst over in America and also from past and present users on this forum and somewhat from my college books too.

    Needless to say , Convective weather is easily one of my most interesting areas of Meteorology , so much can happen in one day . Having a storm build up while also heading in your direction is a great adrenaline rush . Then seeing some bolts from the sky and a booming rumble. Its just GREAT! :D

    Ok so ...

    When I go in search of storm charts, the main things I try to look out for are...


    INSTABILITY - this incorporates CAPE (Convective Available Potential Energy) , LI ( lift index ) , Lapse Rates and CAP .

    CAPE - High CAPE means storms will build vertically very quickly. The updraft speed depends on the CAPE environment. Large CAPE storms will bring strong updrafts and downdrafts , strong updrafts can mean large hail , and strong downdrafts can mean isolated intense rainfall amounts. Lightning activity can also increase during high CAPE storms.


    LI - the great the negative value the more unstable the environment ( mid level ) , hence more favourable for convection. An envoirnment with strong cape and large -(LI) can produce a severe storm from just a puffy cumulus cloud in less than a half hour.

    Lapse Rates - the change in temperature with height (δt/δh) . The larger the value the better. Lapse rates greater than 30 can produce strong updrafts and downdrafts.


    Cap - ( WE HATE THESE!! , well most of the time )

    A cap is basically is a layer of cold dense air which inhibits convection and usually is the cause of a bust to a storm , but when there is either sufficient surface heating or an uplift which cause the cap to be broken then storms can fire .... :D

    Here is a nice image the helps explains this.

    cap2.jpg

    Sometimes though a cap can be could. It can lead to the build up of energy until all best conditions are present for a severe storm and if the cap breaks then all hell can break loose. These are what are known as a loaded gun situation . CIN charts are what the cap values are visible on .

    MOISTURE - Dewpoints - The more moisture present , the more perceptible water available to be lifted above the freezing level to produce showers and thunderstorm activity. A good range for dps for thunderstorms would be anything above 13ºC and anything above 20 is great!


    Wind SHEAR ( change in speed with height δv/δh )

    There a two types of shear important to check for forecasting thunderstorms ,
    Deep layer shear (dls) and Low Level shear ( lls )

    DLS - A strong change of wind speed with height helps to seperate the updraft and downdrafts in the area of the storm . This stops the downdraft's cool air blocking out warm air rising ( the storm's fuel ) and hence killing it off. So A high DLS value helps storms organise and continue on for longer.
    Hight DLS storms usually are multicellular storms ( MCS's ). Since the shear value is high , the storm will move quickly and enable lift around its parameter triggering new cells to pop up . Hence how it gets it's MULTI-CELL part from . These storms can bring about gust front's on their leading edge , large hail and and Slight chance of an isolated tornadic event
    When the DLS value is low but other conditions are favourable single cell storms which are short lived can still occur.

    LLS - A strong low level shear is the main factor in creating rotating updrafts.
    A environment with strong DLS and LLS can create single cell supercell.
    The DLS enables the storm to move quickly and helps keep the updraft and downdraft separated while the LLS helps rotate the updraft into the storm. These storms can produce large hail, strong tornadoes and heavy rain.


    Sadly i don't have many charts to immediately show to co-incide with all the points but here is a storm i noticed that most came into account and wasn't so long ago either.

    Sunday - 8 August last year.

    216738.png

    216739.png

    We can see here from the following charts that morning was nicely set for a strong storm to roll through the midlands . Cape around 500 , LI best in the west but still ok in midlands too with -1 . Deep layer shear was decent as it had been present all night and was tapped into straight away. This meant the storm would organise quickly and keep active longer. THe LLS was good in the midlands but was conducive for a tornadic event if the storm had kept its strength till then .

    These charts led me to put out a warning http://www.boards.ie/vbulletin/showpost.php?p=80202330&postcount=2092
    and i set my alarm and went to bed . WOke up at 7 knowning all hell was already breaking loose! lol


    216760.png

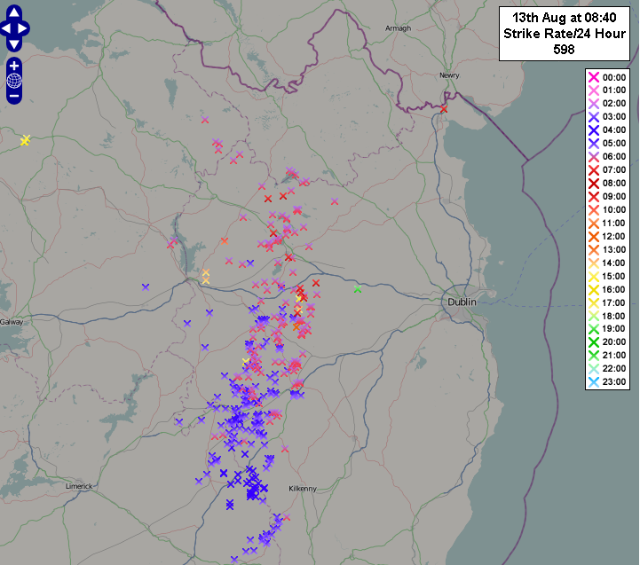
    lightning.png


    Though i didnt see much from that day here in dublin , i got this photo on another day later on that month with good cape and DLS ... :)

    7880527692_debb35eeb6_z.jpg


    Hope i havent lost anyone in confusion of all that . I'll try look for some nice graphics to explain Skew-t charts which are also great for forecasting storms .


    ANy mistakes i have made ( im sure there is one or two ) dont be afraid to point out . :)


    #Bringontheconvection

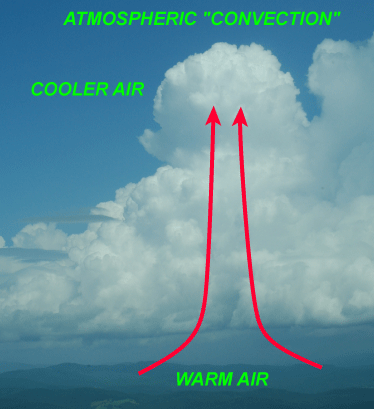
    convection_cloud_ex.gif <<< BOOOM! :D


  • Closed Accounts Posts: 3,548 ✭✭✭Harps


    Good stuff Ian, I can never seem to my head around thunderstorms, so many variables to think about and even when everything seems to be playing ball we sometimes end up with nothing because of some other obscure factor

    Here's the link for the CAPE and LI charts which we'll hopefully see being posted a lot over the next 6 months ('UK CAPE and Lifted Index' on the drop down menu). Not much point following it at the moment but once the sun starts to gain a bit of strength in April we should start to see some potential. From my experience over the last few years, for thunderstorms to build over land the basic criteria is usually a negative LI (numbers and lines on the chart) and CAPE from 400 or so upwards (the colours). Not always the case but a good starting point anyway

    http://www.netweather.tv/index.cgi?action=nwdc;sess=


  • Advertisement
  • Registered Users, Registered Users 2 Posts: 845 ✭✭✭tylercollins


    Ian, I think I will speak on behalf of most of the "noobs" on here in saying thank you very much much for taking the time to write all that up! It is honestly greatly appreciated!! I've got it book marked now so will be returning many times in the next future to read over it again (until I learn if off my heart)

    Again thank you very much :D


  • Closed Accounts Posts: 3,548 ✭✭✭Harps


    Might as well give the more straight forward wind storms a shot..

    For storms, the main thing we look at is the sea level pressure charts. To start with the very basics, air flows clockwise around high pressure and anti-clockwise around low pressure and the closer together the isobars the windier it'll be. Storms are areas of concentrated low pressure and the lower the pressure relative to the surrounding area, the stronger the storm will be.

    The chart below shows the sea level pressure over Europe today, I've crudely drawn the general air flow and areas of high and low pressure. High pressure is centred over Ireland which is giving us the current settled spell. No real storms on show but it might give a bit of an idea on how to read the pressure charts. The colours on the chart show geopotential height (not temperature as is sometimes mistaken here) and to the best of my knowledge have no real relevance to forecasting storms so I'll leave that out.

    ecm10.png

    The next chart shows a storm centred to the north of Donegal, most storms in recent years have taken this track with the north west taking the brunt of the storm, not quite sure why exactly. As said above, the closely packed isobars equate to strong winds and being low pressure, the wind in that chart would be from the west and later from the north west as the storm moves away.

    gfs-2011120806-0-6_oxg9.png

    To get an idea of the actual wind speeds to expect, simply use these charts which give the forecast for average wind speed and max gusts. A max gust of 144kph was recorded at Mallin Head during that storm.

    Average Speed
    http://www.weatheronline.co.uk/cgi-bin/expertcharts?LANG=en&MENU=0000000000&CONT=ukuk&MODELL=gfs&MODELLTYP=1&BASE=-&VAR=uv10&HH=3&ARCHIV=0&ZOOM=0&PERIOD=&WMO=

    Gusts
    http://www.weatheronline.co.uk/cgi-bin/expertcharts?LANG=en&MENU=0000000000&CONT=ukuk&MODELL=gfs&MODELLTYP=1&BASE=-&VAR=boen&HH=3&ARCHIV=0&ZOOM=0&PERIOD=&WMO=

    Checking the wind speed at 950hPa and 925hPa is also useful to get an idea of gusts as the wind at these levels can mix down to the surface during or before heavy showers


    One problem with forecasting storms is that they sometimes suddenly pop up on the models only two or three days out, an early clue to spotting a potential storm is to look for wave features along the northern flank of the Azores High like below. These don't always form into severe storms but with a powerful jet stream overhead and an injection of warm moist air they can rapidly intensify in a process called cyclogenesis.

    gfs200901171806.png

    Below is a jet stream chart showing a powerful jet of over 300km/hr which helped develop the 8th of Dec storm

    gfs-2011120606-5-6_vpb9.png


    The warm moist air is visible on the theta-e charts

    An example here with a tongue of warm air dragged up from the south and cold polar air injected into the rear flank of the storm

    gfs2011120718618.png

    And the corresponding satellite pic showing the same thing

    himageashx.png


    Plenty more technical stuff I'm not too clued up on but as far as reading the charts go it should hopefully give some sort of idea!


Advertisement