Advertisement
If you have a new account but are having problems posting or verifying your account, please email us on hello@boards.ie for help. Thanks :)
Hello all! Please ensure that you are posting a new thread or question in the appropriate forum. The Feedback forum is overwhelmed with questions that are having to be moved elsewhere. If you need help to verify your account contact hello@boards.ie
Hi there,
There is an issue with role permissions that is being worked on at the moment.
If you are having trouble with access or permissions on regional forums please post here to get access: https://www.boards.ie/discussion/2058365403/you-do-not-have-permission-for-that#latest

Reason for slow-moving low pressure systems

  • 20-06-2012 8:32pm
    #1
    Registered Users, Registered Users 2 Posts: 1,130 ✭✭✭


    I'd always thought that, in general, low pressure systems were always fairly quick moving, and high presure systems, when they eventually came around, far more slow moving.

    However, over the past few weeks it seems that any low pressure systems that are moving over Ireland and the UK are staying around for days.

    If you run the attached BBC pressure chart you can see that our next low is going to spend the guts of the next fours days swirling around the British isles.

    I'm just wondering what, if any, is the reason for this?

    http://www.bbc.co.uk/weather/2643743


Comments

  • Registered Users, Registered Users 2 Posts: 28,404 ✭✭✭✭vicwatson


    Great question. This is the third Thursday/Friday low pressure system in a row. Well this weeks begun Wednesday evening.


  • Registered Users, Registered Users 2 Posts: 921 ✭✭✭MiNdGaM3


    This may play a part, though it's always going to be difficult to narrow the causes of these things down to even a handful of factors.

    http://www.deas.harvard.edu/climate/seminars/pdfs/FrancisVavrus2012.pdf
    Arctic amplification (AA) – the observed enhanced
    warming in high northern latitudes relative to the northern
    hemisphere – is evident in lower-tropospheric temperatures
    and in 1000-to-500 hPa thicknesses. Daily fields of 500 hPa
    heights from the National Centers for Environmental Prediction
    Reanalysis are analyzed over N. America and the
    N. Atlantic to assess changes in north-south (Rossby) wave
    characteristics associated with AA and the relaxation of poleward
    thickness gradients. Two effects are identified that
    each contribute to a slower eastward progression of Rossby
    waves in the upper-level flow: 1) weakened zonal winds,
    and 2) increased wave amplitude. These effects are particularly
    evident in autumn and winter consistent with sea-ice
    loss, but are also apparent in summer, possibly related to
    earlier snow melt on high-latitude land. Slower progression
    of upper-level waves would cause associated weather patterns
    in mid-latitudes to be more persistent, which may lead
    to an increased probability of extreme weather events that
    result from prolonged conditions, such as drought, flooding,
    cold spells, and heat waves.


  • Closed Accounts Posts: 5,150 ✭✭✭Deep Easterly


    MiNdGaM3 wrote: »

    Thanks for posting that link MG, looks like a very interesting read. Certainly true that we seem to be stuck under slow moving upper troughs this summer so far though I would disagree with Compsy's a little about the speed of the actual surface lows as they seem to be zipping by a little faster than usual for the time of year, although with an alarming frequency!

    I remember posting a few months ago that the first 3 months of this year saw the longest run of higher than normal MSLP values over the country since 1953. I have to say it really looks as if we are paying for this now - almost as if nature is redressing this imbalance.


  • Registered Users, Registered Users 2 Posts: 1,206 ✭✭✭eskimocat


    I'll bet its that pesky Jet Stream, I know that it sometimes can stall a system in place, sorry can't remember which site you can see the jet stream location from but if you check the sticky on links I am sure its there somewhere. ( no time myself to find it for you, and awful at linking things from other websites :o)


  • Registered Users, Registered Users 2 Posts: 2,655 ✭✭✭delw


    Have to say i would of thought it was that pesky Jet Stream as eskimocat said but i suppose that's only one variable in weather


  • Advertisement
  • Registered Users, Registered Users 2 Posts: 743 ✭✭✭Tae laidir


    I spent some time in West Bengal in the summer. All my fellow tourist had gone! Summer = Monsoon, and the weather in India is beginning to resemble ours!
    Nice warm & dry Spring.
    Cool & wet summers.
    And when the monsoon arrives, the temperature drops, the sky turns grey, the winds often abate and the heavens open.
    Some say the 'Little European Monsoon' is getting Bigger!
    Some describe it as equivalent to a Monsoon Depression.
    See what you think:
    http://www.weather.com/blog/weather/8_12415.html


  • Registered Users, Registered Users 2 Posts: 921 ✭✭✭MiNdGaM3


    Thanks for posting that link MG, looks like a very interesting read. Certainly true that we seem to be stuck under slow moving upper troughs this summer so far though I would disagree with Compsy's a little about the speed of the actual surface lows as they seem to be zipping by a little faster than usual for the time of year, although with an alarming frequency!

    I remember posting a few months ago that the first 3 months of this year saw the longest run of higher than normal MSLP values over the country since 1953. I have to say it really looks as if we are paying for this now - almost as if nature is redressing this imbalance.

    It mentions that it can also effect summer conditions through anomalous snow cover loss, and seen as the northern hemisphere is currently 2nd lowest on record, it may well be having some effect.
    201205.gif

    I remember that slp stuff, was surprised at the lack of attention that got. Maybe we'll get another long spell of high pressure soon!?


  • Closed Accounts Posts: 4,279 ✭✭✭Su Campu


    These low pressure systems are slow moving due non-pregoressive upper wave pattern of late, which has shown around 4 waves around the globe, with persistent Greenland blocking and an associated trough and hence southward-shifted jetstream over the eastern Atlantic. This trough has been the source of the surface low systems, which have more rotated around the axis of the trough.

    ECH1-72.GIF?00

    There may be the signs of an increase in wave numbers and hence a more progressive shift in the pattern by the end of the month, which, coupled with anomalously cold SSTs in the eastern Atlantic, may lead to a more positive NAO and a northeastward extension of the Azores high.

    http://weather.unisys.com/archive/sst/sst_anom_loop.gif


  • Closed Accounts Posts: 5,150 ✭✭✭Deep Easterly


    MiNdGaM3 wrote: »
    It mentions that it can also effect summer conditions through anomalous snow cover loss, and seen as the northern hemisphere is currently 2nd lowest on record, it may well be having some effect.

    Do you know if it is possible to get the source of that data in text form Mindgame? It would be interesting to do a quick analysis to see if NH seasonal snow cover anomalies coincide with any distortion from the normal seasonal pressure patterns here in Ireland over the last few decades.


  • Registered Users, Registered Users 2 Posts: 921 ✭✭✭MiNdGaM3


    Do you know if it is possible to get the source of that data in text form Mindgame? It would be interesting to do a quick analysis to see if NH seasonal snow cover anomalies coincide with any distortion from the normal seasonal pressure patterns here in Ireland over the last few decades.

    Yep, this page has the data as weekly or monthly snow extent.

    http://climate.rutgers.edu/snowcover/table_area.php?ui_set=2

    I might start doing a little analysis with it myself...


  • Advertisement
  • Closed Accounts Posts: 5,150 ✭✭✭Deep Easterly


    MiNdGaM3 wrote: »
    Yep, this page has the data as weekly or monthly snow extent.

    http://climate.rutgers.edu/snowcover/table_area.php?ui_set=2

    I might start doing a little analysis with it myself...

    Thanks MG, that is a great link. Just using the NH snow cover anomalies from the data provided on the link for the summer months for years between 1972 up to 2011 and comparing them to the 'IMT' MSLP summer means for the same period, there seems to be an interesting alignment of trend between both over the 40 year period.


    209866.PNG
    Data from the NOAA-CIRES Reanalysis & Rutgers University
    Axis of Northern Hemisphere snow cover extent centered around the 1972-2001 summer mean .

    It is interesting that the lowest 5 year NH summer snow cover mean extent (2007-2011) of 3973348.1 km2 coincides with the lowest 5 year summer IMT MSLP mean (2007-2011) since at least 1961. 5 year mean extent of cover over this 40 year period peaked at 7606174.1 km2 between 1977-1981, which is close enough to the highest IMT 5 year (1979-1984) mean summer MSLP since at least 1961 also.

    I am not sure does this contradict the idea in the paper above that the so called 'Arctic Amplification' has increased the incidences of 500 hPa ridging in the eastern Atlantic during the summer months as it would seem that troughing over the region has been more the norm over the last few summers, though I am well open to contradiction on this.

    PS, Just to point out a mistake in above chart title, should read 'period from 1972-2011' and not '1972-2012'


  • Registered Users, Registered Users 2 Posts: 921 ✭✭✭MiNdGaM3


    Thanks MG, that is a great link. Just using the NH snow cover anomalies from the data provided on the link for the summer months for years between 1972 up to 2011 and comparing them to the 'IMT' MSLP summer means for the same period, there seems to be an interesting alignment of trend between both over the 40 year period.


    209866.PNG
    Data from the NOAA-CIRES Reanalysis & Rutgers University
    Axis of Northern Hemisphere snow cover extent centered around the 1972-2001 summer mean .

    It is interesting that the lowest 5 year NH summer snow cover mean extent (2007-2011) of 3973348.1 km2 coincides with the lowest 5 year summer IMT MSLP mean (2007-2011) since at least 1961. 5 year mean extent of cover over this 40 year period peaked at 7606174.1 km2 between 1977-1981, which is close enough to the highest IMT 5 year (1979-1984) mean summer MSLP since at least 1961 also.

    I am not sure does this contradict the idea in the paper above that the so called 'Arctic Amplification' has increased the incidences of 500 hPa ridging in the eastern Atlantic during the summer months as it would seem that troughing over the region has been more the norm over the last few summers, though I am well open to contradiction on this.

    PS, Just to point out a mistake in above chart title, should read 'period from 1972-2011' and not '1972-2012'

    Very nice work!

    The paper though mentions an increase in wave amplitude, not just in ridging. I think we've just been unlucky to find ourselves caught in a mean upper trough in recent summers, while Greenland has been hogging the ridging!
    The 500hPa geopotential height anomalies of the last 5 summers

    summeranimation.gif

    EDIT: Just to add, the first 20 days of this summer is following a very similar upper pattern to the last 5.
    209896.gif


  • Closed Accounts Posts: 5,150 ✭✭✭Deep Easterly


    MiNdGaM3 wrote: »
    Just to add, the first 20 days of this summer is following a very similar upper pattern to the last 5.

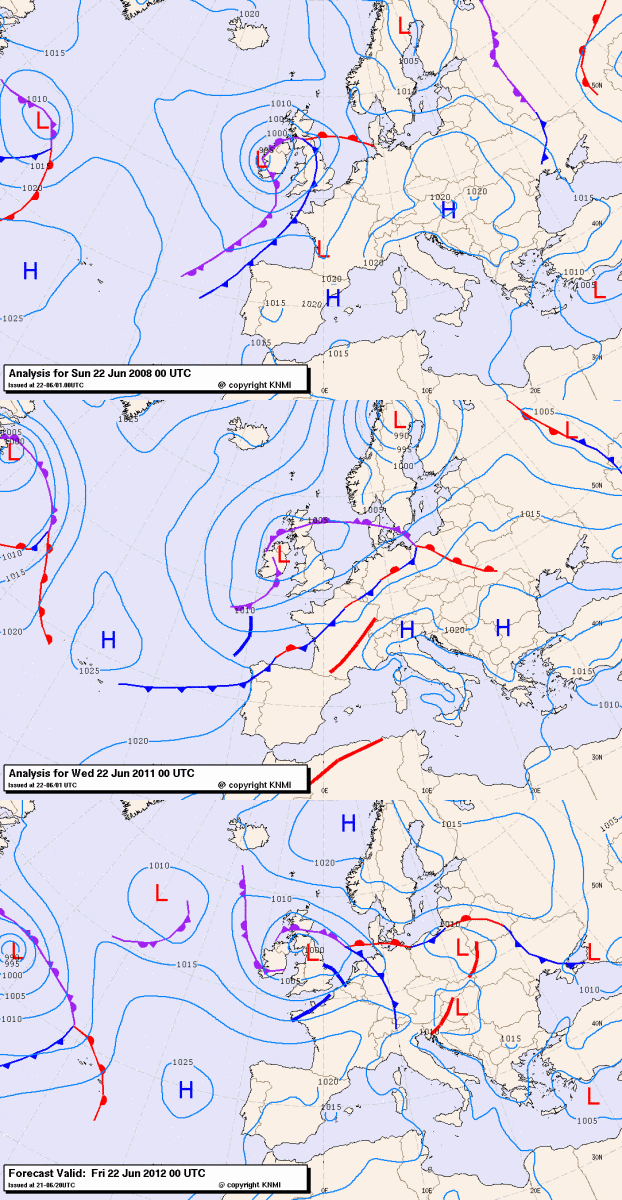
    Today's 00z analysis showed an almost scarily similar pressure pattern around Ireland to that of the 00z analysis this day last year, and also the 00z analysis on this day 4 years ago.

    animation_2.gif

    Seems that a trend is emerging alright over the last 5 years.


    PS, Mindgame, something I have wondered about more than once over the last few years and doing that chart sort of prompted it again, but do you think there is any possibility that the Chernobyl disaster back in 1986 could have had any sort of impact on the short or even long-term climate? I am not sure if there are any studies on this, or if it even warrants one, but looking at the NH snow cover extent, it really seems take a dip from 1986/1987 onwards.


  • Registered Users, Registered Users 2 Posts: 7,816 ✭✭✭Calibos


    Studies have shown there hasn't even been much of an impact on cancer rates in the short never mind long term. ie. The only fatalities that can be laid at the door of the disaster are some of the firefighters at the plant itself.

    http://www.who.int/ionizing_radiation/chernobyl/backgrounder/en/index.html

    It was a only a disaster in terms of the radiation and massive evacuation of population (250,000), not in terms of explosive force and weather affecting particulate fallout like from a Volcano. etc In terms of climate it was no worse than an explosion and fire at a factory. ie. no effect whatsoever.


  • Registered Users, Registered Users 2 Posts: 921 ✭✭✭MiNdGaM3


    Today's 00z analysis showed an almost scarily similar pressure pattern around Ireland to that of the 00z analysis this day last year, and also the 00z analysis on this day 4 years ago.

    animation_2.gif

    Seems that a trend is emerging alright over the last 5 years.


    PS, Mindgame, something I have wondered about more than once over the last few years and doing that chart sort of prompted it again, but do you think there is any possibility that the Chernobyl disaster back in 1986 could have had any sort of impact on the short or even long-term climate? I am not sure if there are any studies on this, or if it even warrants one, but looking at the NH snow cover extent, it really seems take a dip from 1986/1987 onwards.


    The 8-10 day 500hPa mean comparison offers little hope for any change in the pattern, with strong ridging up through Greenland once more and the upper trough over us or just to our south west.
    6034073

    As for the change after 86, it seems to me that the trend had already become well established by then, with the drop from 86 not really standing out compared to the trend. I'd say the change from the late 70s through to the early 80s might be worth looking at though. A brief glance at some different climate indices shows that there was quite a step change in that time, with both ENSO and the PDO moving to strong positive phases and solar cycle 21 reaching it's peak around 1980.

    209997.PNG
    209998.PNG
    210001.PNG


  • Registered Users, Registered Users 2 Posts: 3,428 ✭✭✭ZX7R


    Watched a program on edan last night on about Chernobyl,one of the scientists said he tought there has to be affects on the climate after it.


  • Closed Accounts Posts: 2,693 ✭✭✭Redsunset


    ZX7R wrote: »
    Watched a program on edan last night on about Chernobyl,one of the scientists said he tought there has to be affects on the climate after it.

    What made him come to that conclusion?
    Seems to me, there just inventing excuses at this stage. He has a long queue to get behind


  • Registered Users, Registered Users 2 Posts: 3,428 ✭✭✭ZX7R


    redsunset wrote: »
    What made him come to that conclusion?
    Seems to me, there just inventing excuses at this stage. He has a long queue to get behind
    I dont know what made him come to that conclusion, maby it was just his views, anyhow my wife translated what he said in his native ukraine tongue and was totaly different to what the subtitles said he said on the program,he said ;"as well as the affects the raidation had on nature ,i am sure the localised weather has been afected also"


  • Closed Accounts Posts: 4,279 ✭✭✭Su Campu


    In 1995 I did a 3rd year project in Germany on the effects of rainfall on soil radiation levels from Chernobyl fallout. It involved collecting both shallow and deep layer soil samples from much of southern Germany and measuring the difference in Cs137 gamma radiation between sites.

    This had initially been done in 1986 (3 weeks after the explosion), and a plot of the results showed elevated levels in the eastern area, where rainfall had occured in the days after the disaster, and low levels further west, where there was less rainfall. The shallow samples then contained the bulk of the radiation as at that stage it had not washed down to the deeper soil.

    When I repeated the experiment 9 years later it was interesting to see how much the deep soil had picked up and maintained the radiation, with the shallow soil showing very little residual radiation. The overall levels had reduced, but it still showed that the effects were obvious a decade later.

    This doesn't deal with whether or not the radiation had an effect on the weather, as it was in fact the other way around. I would imagine that any possible effects would have been on a short timescale (days-weeks) and could involve increased cloudiness (increased CCN levels), but that was unfortunately not part of the experiment at the time.


  • Registered Users, Registered Users 2 Posts: 7,816 ✭✭✭Calibos


    Why was my post deleted?


  • Advertisement
  • Closed Accounts Posts: 2,693 ✭✭✭Redsunset


    Calibos wrote: »
    Why was my post deleted?

    Your post is on page one. Got accidentally misplaced for a time when some spam post was shown the door.


  • Closed Accounts Posts: 5,150 ✭✭✭Deep Easterly


    MiNdGaM3 wrote: »
    6034073As for the change after 86, it seems to me that the trend had already become well established by then, with the drop from 86 not really standing out compared to the trend. I'd say the change from the late 70s through to the early 80s might be worth looking at though. A brief glance at some different climate indices shows that there was quite a step change in that time, with both ENSO and the PDO moving to strong positive phases and solar cycle 21 reaching it's peak around 1980.

    Yep, certainly a marked change around that time alright, though there does seem to be a notable sharp steepening within the annual temperature trend towards the late 80's in northern Europe at least. Quick chart below shows the 5 year annual mean temperature anomaly at Oaksoey FYR in southern Norway and our own Valentia since 1965 along with the annual NHSC 5 year mean area anomaly since 1972 (annual area cover before then too inconsistent to include). Both axis are centered around the the 81-2010 normal.
    210106.PNG

    Not sure if this late 80's 'kink' in trend is reflected in the northern hemisphere or even global temperature trend though.

    Edit: data from the ECA&D / Rutgers University.


  • Registered Users, Registered Users 2 Posts: 921 ✭✭✭MiNdGaM3


    The graph isn't appearing on my screen DE?


  • Closed Accounts Posts: 5,150 ✭✭✭Deep Easterly


    MiNdGaM3 wrote: »
    The graph isn't appearing on my screen DE?

    Nor mine now :mad: these boards.ie attachments are crap!! will try and upload again.

    Edit, chart uploaded again, so hopefully will show up this time.


  • Registered Users, Registered Users 2 Posts: 921 ✭✭✭MiNdGaM3


    Working now!

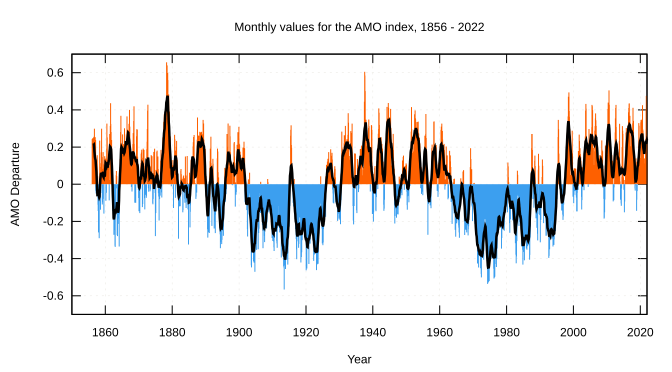
    I think with coastal stations in the Atlantic, you'd need to be able to differentiate the trend caused by the AMO, which appears to follow the temperature trends quite closely.

    Here's the AMO 5 year mean since 65

    210107.PNG


  • Closed Accounts Posts: 5,150 ✭✭✭Deep Easterly


    MiNdGaM3 wrote: »
    Working now!

    I think with coastal stations in the Atlantic, you'd need to be able to differentiate the trend caused by the AMO, which appears to follow the temperature trends quite closely.

    I'm not even going to pretend that I understand what the AMO is fully. Very basic grasp at best!

    Plotting the AMO 5 yearly anoms into the chart I did earlier, it seems that though the overall the trend is pretty much aligned with that of the trend in temperature, the rising trend still seems disproportionately slack around the period in question relative to the rather sharp rise in temperature / decline in NHSC, which seem to occur in and around the same time. The AMO 5 year mean trend does take a sharp jump upwards, but not really until the mid-late 90's, or at least it seems that way from just a quick eye over. (Apologies in advance if chart seems cluttered)

    210175.PNG


  • Registered Users, Registered Users 2 Posts: 921 ✭✭✭MiNdGaM3


    Seems we remain stuck in this pattern still, while Arctic sea ice extent and area are 2nd and 1st lowest on record respectively (by most counts) and June just had the lowest northern hemisphere snow cover on record.
    The upper pattern this summer is remaining broadly similar to the last 5, with an anomalous upper ridge extending into Greenland tending to dominate, leaving us stuck in the trough. The pattern, if anything, seems stronger this year.
    Perhaps the coming El Nino can change things for the 2nd half of summer, or even just August?


  • Registered Users, Registered Users 2 Posts: 9,807 ✭✭✭Birdnuts


    MiNdGaM3 wrote: »
    Seems we remain stuck in this pattern still, while Arctic sea ice extent and area are 2nd and 1st lowest on record respectively (by most counts) and June just had the lowest northern hemisphere snow cover on record.
    The upper pattern this summer is remaining broadly similar to the last 5, with an anomalous upper ridge extending into Greenland tending to dominate, leaving us stuck in the trough. The pattern, if anything, seems stronger this year.
    Perhaps the coming El Nino can change things for the 2nd half of summer, or even just August?

    Thats a good summary of why recent summers have sucked - I think only August can save us now going on tonights outputs, even then I wouldn't be that confident given how poor that month has been in the past decade(the last good one I can remeber was 2003):(


  • Registered Users, Registered Users 2 Posts: 2,662 ✭✭✭20silkcut


    August 2006 was good. The last extended period of heat we got in mid summer in this country.


  • Advertisement
  • Registered Users, Registered Users 2 Posts: 5,068 ✭✭✭Iancar29


    ONly just seeing this thread now... great read indeed with great insight. Makes the weather forum on here stand out above the rest.


  • Closed Accounts Posts: 5,150 ✭✭✭Deep Easterly


    MiNdGaM3 wrote: »
    Perhaps the coming El Nino can change things for the 2nd half of summer, or even just August?

    but more probably for winter! :D:o

    EDIT. Very Interesting article by the UK Met Office on their blog site this morning which discusses the unusual weather pattern this summer so far and possible causes, one or two of which have already been touched upon in this thread.

    http://metofficenews.wordpress.com/

    (Article under title: 'The UK’s wet summer, the jet stream and climate change'.)


  • Moderators, Technology & Internet Moderators Posts: 17,137 Mod ✭✭✭✭cherryghost


    At least there's an emerging pattern for a mini heatwave in about 2 weeks :P


  • Closed Accounts Posts: 5,150 ✭✭✭Deep Easterly


    Very informative lecture from the Rutger University Weather & Climate Summit earlier this year which explains how changes in the Arctic Oscillation over the last 30 years has impacted in sea ice and how this impact is beginning to affect weather patterns over the Northern Hemisphere such as higher amplitude ridging, weaker troughing, slower moving synoptic scale weather patterns etc.

    http://www.youtube.com/watch?v=RtRvcXUIyZg&feature=g-high-rec

    I think it might be worth doing a small amateur study (using re-analysis) to see if surface pressure patterns have changed over the last 30 years or so for the NE Atlantic region and to see if any changes correspond with the overall 500 hPa anomalies over the wider north Atlantic region over the last 10 years as claimed in the video.


  • Registered Users, Registered Users 2 Posts: 39 Capillatus


    I think it might be worth doing a small amateur study (using re-analysis) to see if surface pressure patterns have changed over the last 30 years or so for the NE Atlantic region and to see if any changes correspond with the overall 500 hPa anomalies over the wider north Atlantic region over the last 10 years as claimed in the video.

    I was thinking of doing something like that. But you have to know, that you are talking about MSLP anomalies and 500mp anomalies, a.k.a. patterns. I can do this "study" but it wont really prove much, regarding the linkage with changes in the Arctic. Its a fact, that there are a lot of factors that affect weather and weather patterns. And we should first start looking at what affects the Arctic? Taking all the oceanic and atmospheric cycles and oscillations into the "equation".
    And of course there are changes in the patterns, which correspond with all the changing cycles in nature. It would be almost absurd to expect more or less constant seasonal weather patterns, with little variance.

    And of course the 500mb patterns have changed over Atlantic in the past 10 years, because that somewhat corresponds with the start of a warm AMO cycle. :)

    If I will have enough free time, I will do the study you requested. :)

    Best regards.


  • Banned (with Prison Access) Posts: 25,234 ✭✭✭✭Sponge Bob


    Just out of interest Capitallatus what long term trends do you possibly see coming out of such an analysis AND affecting your corner of Europe..eg drought or not.


  • Advertisement
  • Registered Users, Registered Users 2 Posts: 39 Capillatus


    Well, I am seriously thinking about such an analysis/reanalysis for a bit longer term.

    And to answer your question.
    I remember a few years ago, when Joe Bastardi was talking about, how we are slowly going back to the patterns from the past and more like it was in the 70's. I had no idea what he was talking about back then, because I had no real "weather knowledge" or access to any database. But when I began digging through data, I realized that the guy might actually have a valid point. Of course it was just my thinking. And it never changed. All the weather patterns we see, have occurred at some point in the past. Not really with exact strength and location, but the similarity is quite good. And that shows you how the patterns and the weather is just responding to all of the nature cycles. You have some people like Al Gore and his like-minded souls, who use those cycles to make profit. And if I can take this opportunity to present my opinion on AGW: The only thing man made in "weather", are the CO2 taxes that we have to pay. And even with the temperature trend being flat for more than 10 years, and even being slightly negaitve for the past 6-7, there are still people forcing the idea that we humans are to blame for the non existing warming of the planet. I could make a whole new thread on my AGW opinion. :D
    Back on the topic: And the beauty of weather forecasting is in the fact, that when looking even slightly into the future, you can never take everything into consideration, to see exactly what is going to happen. There is just too much variables. One big chaos. :) We have NWP or "Numerical Weather Prediction" a.k.a. weather models, that tries to take everything into account instead of us, but as you all know, they are far from perfect, because there is too much stuff going on. :)

    And now to really answer your question. :D
    The way I see it, and the way weather looks to be going, is to be more favorable for weather like it was from the 50's to 70's. Basically because of the cold PDO/warm AMO setup (and yes, everything that goes along with it :D). Now this is just my opinion, or thoughts, or theory.

    If I make reanalysis of the winter patterns for 3 periods. 1950-1979, which was the last cold PDO/warm AMO setup, then it was 1980-1998, warm PDO/ cold AMO, and from 1999-2012, with the PDO going back to cold, and AMO going into a warm cycle. The years are not really that exact for the start of the cycles, because there is some lag present or maybe one cycle starting before or later, but its good enough for the overall idea. :) It might also shed a little more light on why systems are allegedly getting "slower"? I think more analyses should be made before making any final claims on that specific idea.

    672px-Amo_timeseries_1856-present.svg.png

    800px-PDO.svg.png

    Before I post the reanalysis, keep this in mind: This is a composite, or a blend of winter patterns in all the years in those periods. So the anomalies are not really that strong, but when you consider how many years and patterns its in these composites, the anomalies are actually very strong and show the tendencies and how the overall thing looked like. There was of course variance within each period, but we are going to look how the average pattern looked like, when mixing all together, or which pattern was most dominant. And of course there are other things besides PDO and AMO that affect the outcome, but for this post, I will focus only on these two big cycles.
    And these are only 500mb patterns, so temperature and precipitation can still vary. Especially in the reanalysis, because there was no satellite measurements before 1980, so the temp. and prec. data is less reliable. But still, the main focus here remains on the patterns.

    1950-1979, Cold PDO, Warm AMO
    8914361128323183824.png

    1980-1998, Warm PDO, Cold AMO
    891436112832318302.png

    1999-2012, Shifting to Cold PDO, Warm AMO
    8914361128323182931.png

    And an animation, for a better comparison.
    500.gif

    EDIT: Added MSLP reanalysis.

    891436112832318302.png

    891436112832319127.png

    891436112832319114.png

    Also worth pointing out, is the relative small sample size of the last period 99-12. The cycles are still in progress in this period, but I thing the overall tendency is already visible. Especially when compared with the last cold PDO/warm AMO period. And the 12/13 winter, will be/should be/looks like it will be in this general idea, further strengthening the overall pattern seen in the reanalysis.

    Enough of my lame blabbing. And I have to say that all above is nothing more and nothing less, that just my opinion or my thoughts.

    Best regards.


  • Banned (with Prison Access) Posts: 25,234 ✭✭✭✭Sponge Bob


    Thanks Capitallatus. I agree with you fully, on principle, that patterns repeat themselves and that the future can be found in the past ....in many cases.


  • Closed Accounts Posts: 5,150 ✭✭✭Deep Easterly


    Sponge Bob wrote: »
    Thanks Capitallatus. I agree with you fully, on principle, that patterns repeat themselves and that the future can be found in the past ....in many cases.

    True, but not in all cases. the run of lower than average MSLP anomalies during the summer period for this part of the world for example is without precedent.


    Good post Capitallatus, well considered and a lot to be learned from it.


Advertisement