Advertisement
If you have a new account but are having problems posting or verifying your account, please email us on hello@boards.ie for help. Thanks :)
Hello all! Please ensure that you are posting a new thread or question in the appropriate forum. The Feedback forum is overwhelmed with questions that are having to be moved elsewhere. If you need help to verify your account contact hello@boards.ie

How do the Models Work?

Options
  • 06-02-2011 3:37pm
    #1
    Closed Accounts Posts: 5,234 ✭✭✭


    I know that there are a large number of models - ECMWF, UKMO, GFS, JMA, GEM, BOM to name some. But how do they work? Presumably the information from current conditions is put in to them, but is there much human input or following of historical trends? And how do they get such a wide variety of possible conditions using the same information?

    I've been following this forum for a fair while now, and can more or less understand whats actually in the charts, but I have no idea how they get to it!


Comments

  • Closed Accounts Posts: 4,279 ✭✭✭Su Campu


    There is no human input into a model run. The model takes actual observational data and compares them to a first guess of a previous model run, making slight corrections and filling in the gaps in data-sparse areas. It then applies the predictive equations to these data for periodic timesteps into the future, eg. +12, =24 hours, etc., giving us those charts we love to post!

    There are different types of models: Gridpoint, Spectral (GFS and ECMWF), Hydrostatic, non-hydrostatic, etc. Some use different vertical co-ordinates, such as sigma models (GFS), which use ground level as the lowest level. This can cause problems in areas of high terrain.

    Different models have different resolution, and some include more parameters than others, such as soil humidity, evaporation, cloud processes, friction, etc.

    So it's not surprising that the models can give varying output, and some are better at handling certain setups than others.


  • Registered Users Posts: 9,010 ✭✭✭Tom Cruises Left Nut


    Su Campu wrote: »
    There is no human input into a model run. The model takes actual observational data and compares them to a first guess of a previous model run, making slight corrections and filling in the gaps in data-sparse areas. It then applies the predictive equations to these data for periodic timesteps into the future, eg. +12, =24 hours, etc., giving us those charts we love to post!

    There are different types of models: Gridpoint, Spectral (GFS and ECMWF), Hydrostatic, non-hydrostatic, etc. Some use different vertical co-ordinates, such as sigma models (GFS), which use ground level as the lowest level. This can cause problems in areas of high terrain.

    Different models have different resolution, and some include more parameters than others, such as soil humidity, evaporation, cloud processes, friction, etc.

    So it's not surprising that the models can give varying output, and some are better at handling certain setups than others.

    Very good info, cheers !


  • Registered Users Posts: 2,855 ✭✭✭Nabber


    Is there a % ration for the models

    i.e +48 hours has 70% chance of being correct?

    I know with so many varibles that weather prediction past 48hours is a bit hit and miss.


  • Closed Accounts Posts: 4,279 ✭✭✭Su Campu


    Nabber wrote: »
    Is there a % ration for the models

    i.e +48 hours has 70% chance of being correct?

    I know with so many varibles that weather prediction past 48hours is a bit hit and miss.

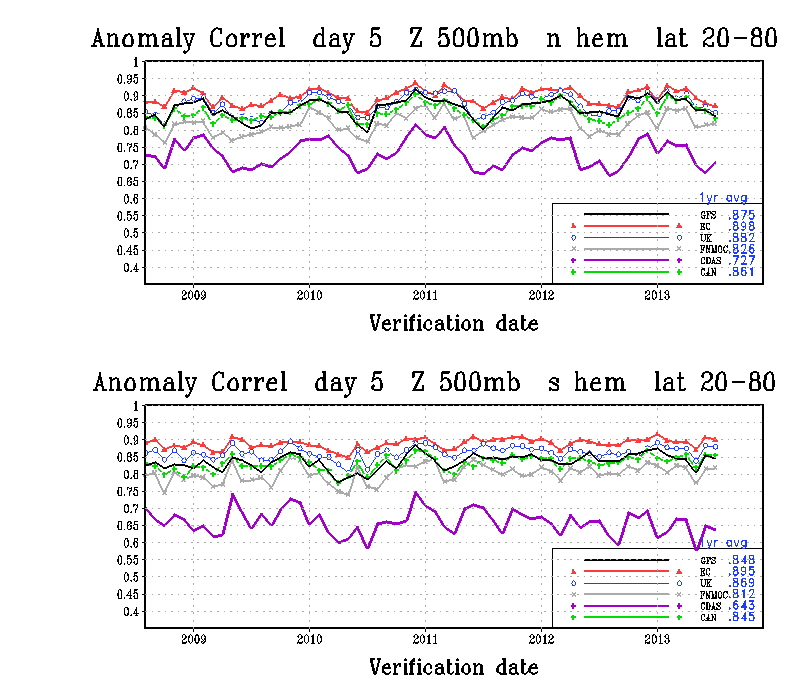
    Accuracy does of course fall off, but the chart below shows that at 5 days, the ECMWF is still showing a correlation of around 0.95, leader of the group, closely followed by the GFS and UK models.

    aczhist6.gif


  • Registered Users Posts: 2,602 ✭✭✭200motels


    Excellent posts


  • Advertisement
  • Closed Accounts Posts: 5,234 ✭✭✭thetonynator


    Thanks for the replies Su!!!


  • Moderators, Society & Culture Moderators Posts: 12,629 Mod ✭✭✭✭riffmongous


    I guess it might be worth mentioning the 'ensemble prediction system' too. Its an attempt to provide a statistical analysis for long range forecasts (10 days usually).

    http://www.ecmwf.int/products/forecasts/guide/The_principles_behind_the_ensemble_prediction_system.html

    In addition to running a forecast with your best knowledge of the atmosphere (the control or deterministic forecast) , you run a large number of simultaneous forecasts that are slightly different (perturbed) and have a lower resolution. So by comparing the 40 or so different forecasts you can get a statistical look at what the weather is going to be over the next 10 days. And the by comparing the spread of the values from the perturbed model runs and the control you can get an better idea than just using the control.


Advertisement