Advertisement
If you have a new account but are having problems posting or verifying your account, please email us on hello@boards.ie for help. Thanks :)
Hello all! Please ensure that you are posting a new thread or question in the appropriate forum. The Feedback forum is overwhelmed with questions that are having to be moved elsewhere. If you need help to verify your account contact hello@boards.ie
Hi there,
There is an issue with role permissions that is being worked on at the moment.
If you are having trouble with access or permissions on regional forums please post here to get access: https://www.boards.ie/discussion/2058365403/you-do-not-have-permission-for-that#latest

Creating graphs/plots - should I use R?

  • 18-02-2009 11:29am
    #1
    Registered Users, Registered Users 2 Posts: 8,452 ✭✭✭


    Hi all,

    I figure this is the best place to ask.

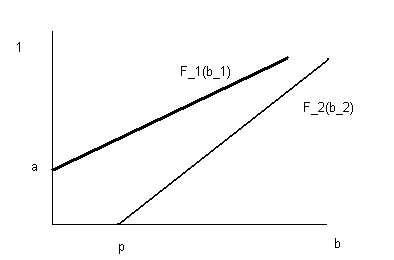
    My thesis will partly involve deriving paths for variables, b = f(v,c) etc. that are theoretical and thus no data exist. I want to include graphs that plot the frequency distribution over b. So we'd have something like a line with an intercept of a and a slope of v/c. Basically, something along the lines of:

    complex.gif

    but ideally not drawn in paint in 2mins!

    If I had data I would be able to plot them in R. What should I use? I'll be typesetting in LaTeX and I think I could use its crappy graphics editor, but ideally I'd like software that will compute functions for me like this. Can R do it? If so, could someone point me in the direction of a tutorial?

    Thanks.


Comments

  • Moderators, Science, Health & Environment Moderators Posts: 1,852 Mod ✭✭✭✭Michael Collins


    Never used the 'R' statistical package. Maple is perfect for what you want. It can plot simple and not-so-simple functions at the drop of a hat. Plus do all those tedious math calculations. MATLAB can do it too with the "ezplot" function or even the old fashioned way. Hopefully you have access to one of these and don't have to buy em!


  • Closed Accounts Posts: 6,081 ✭✭✭LeixlipRed


    I'd echo that. Just use Maple if you have access to it. Really simple stuff. I have a cd lying about somewhere if you desperately need it.


  • Registered Users, Registered Users 2 Posts: 8,452 ✭✭✭Time Magazine


    Go raibh míle.

    I do have access to Maple. Now to learn it :)


  • Registered Users, Registered Users 2 Posts: 73 ✭✭niall2j


    Depending on your timescale (and whether you have access to it), I would recommend Matlab.

    I say timescale because you would need to spend a bit of time learning to use it. That said it can be picked up quickly even by people with little programming experience so I wouldn't worry.


  • Registered Users, Registered Users 2 Posts: 3,620 ✭✭✭Grudaire


    If you're thinking of Matlab - try FreeMat, I studied Matlab, then found this, and I can't see much difference. Might save you money!

    I used R aswell, it'll do the trick either - the biggest problem I had was googleing for help - apperently 'r' is a common letter.


  • Advertisement
  • Registered Users, Registered Users 2 Posts: 1,595 ✭✭✭MathsManiac


    If the graphs are just lines, then the LaTeX graphics (or indeed the drawing tools in a WP package like MS Word) will give a better quality image, since you'll get vector graphics instead of bitmaps.

    All the packages mentioned, I think, produce bitmap images for their graphs. If so, they look fine on screen, but are not really publication quality.

    More complicated graphs can be approximated with splines if you want a good quality vector-graphic image.


  • Closed Accounts Posts: 23 niallo1


    If you google 'r' .... the stats package R is the first thing that comes up!

    Graphics generated in R can be right clicked on and saved as '.eps' files which might be handy if you are using latex (I think matlab is also good for this)

    To implement in R what you want below some of the following code might help after tailoring it to your needs :)


    bmin <- 0
    bmax <- 1
    b <- seq(bmin,bmax,length=20)
    yaxis<- seq(0,1,length=20)

    a <- 0
    v <- 1
    c <- 1


    f1 <- function(x)
    {
    x <- x^2
    return(x)
    }
    f2 <- function(x,slope,int)
    {
    x <- int+slope *x
    return(x)
    }

    matplot(b,cbind(f1(b),f2(b,v/c,a)),xlim=c(bmin,bmax), ylim=c(min(yaxis),max(yaxis)),main="Boards.ie is great",xlab="b",ylab="",type="l",lty=c(1,2),col=c("black","red"))
    text(0.5,0.5,labels=expression(paste("F_1(b_1)")))
    text(0.2,0.5,labels=expression(paste("F_2(b_2)")))


    Whilst maybe not better than other packages like maple/matlab ... it is certainly possible to do it in R :)


  • Registered Users, Registered Users 2 Posts: 48 timbrophy


    I highly recommend Sysquake for Latex which you can get at
    http://www.calerga.com/products/SQLx/index.html

    Make sure you download the package Sysquake for LaTeX and not just the Sysquake application. It gives LaTeX all the power of Matlab and allows you to do any graphic, or even calculation, in the LaTeX document itself.

    Tim


Advertisement