Advertisement
If you have a new account but are having problems posting or verifying your account, please email us on hello@boards.ie for help. Thanks :)
Hello all! Please ensure that you are posting a new thread or question in the appropriate forum. The Feedback forum is overwhelmed with questions that are having to be moved elsewhere. If you need help to verify your account contact hello@boards.ie
Hi all! We have been experiencing an issue on site where threads have been missing the latest postings. The platform host Vanilla are working on this issue. A workaround that has been used by some is to navigate back from 1 to 10+ pages to re-sync the thread and this will then show the latest posts. Thanks, Mike.
Hi there,
There is an issue with role permissions that is being worked on at the moment.
If you are having trouble with access or permissions on regional forums please post here to get access: https://www.boards.ie/discussion/2058365403/you-do-not-have-permission-for-that#latest
There is an issue with role permissions that is being worked on at the moment.
If you are having trouble with access or permissions on regional forums please post here to get access: https://www.boards.ie/discussion/2058365403/you-do-not-have-permission-for-that#latest
Ken Ring
-
26-10-2009 12:30am#1on his site he predicts some significant falls about the second week in Nov, then Nov 16,
now look at this GFS chart(hopefully it won't have changed again by tomorrow) 2
2
Comments
-
There is an interesting article about him and his methods in this weeks Farmers Journal, worth a look if you can pick it up in your local shop. It'll be up on their website during the week, I'll post a link then.0
-
nacho libre wrote: »on his site he predicts some significant falls about the second week in Nov, then Nov 16,
now look at this GFS chart(hopefully it won't have changed again by tomorrow)
I haven't a clue who Ken Ring is , but going by that chart posted, I would say weak showery troughs with a risk of hail in the west and north. Is it snow Mr Ring speaks of? If so, then I hope he is right...:) 0
 -
Deep Easterly wrote: »I haven't a clue who Ken Ring is, but going by that chart posted, I would say weak showery troughs with a risk of hail in the west and north. Is it snow Mr Ring speaks of? If so, then I hope he is right...:)
have you been living under a rock,the new zealand guy ,he does be on today fm too.great record for predicting precise weather using moon and sun0 -
-
-
Advertisement
-
The meteireann people just don't want to know about Ken Ring but I think it's better not to shut out any sources of weather prediction unless there is 100% proof they are of no relevance. Everyone knows that predicting the weather is not an exact science and that makes it all the more exciting.0
-
Article from this weeks Farmers Journal, make of it what you will
http://www.farmersjournal.ie/2009/1024/farmmanagement/crops/feature.shtml?mn=7&sm=7-10 -

surely if this chart is realised, the high ground in Northern Ireland will at least see some snow??
The snow fever has taken hold again only see what i want to see:pac:0 -
Not a hope


Ignoring the fact these charts are out in cuckoo land anyway - upper level temeratures really have to be below -6 or -7 for snow from a polar maritime source at this time of year which is highly unlikely. The second chart shows DAM thicknesses which also have to be sub 528 DAM.
The best chance of a few flakes this time of year is an Atlantic front coming up against sub -5 850 hpa. Even if this did happen sleet or snow would not last very long and would primarily be on high ground.
It really is too early to be looking for snow potential but that is not to say it cannot happen. I would'nt really be aware of it till the second half of November onward.0 -
correct DM2 ,people the magic 528 dam line(remember that)is a minimum must have situation.like DM2 says a -5 just does not cut it for our country in that set up. In europe a dam of 546 is all thats needed.0
-
Advertisement
-
Snow can still happen at this time of year though, this time last year was a perfect example:
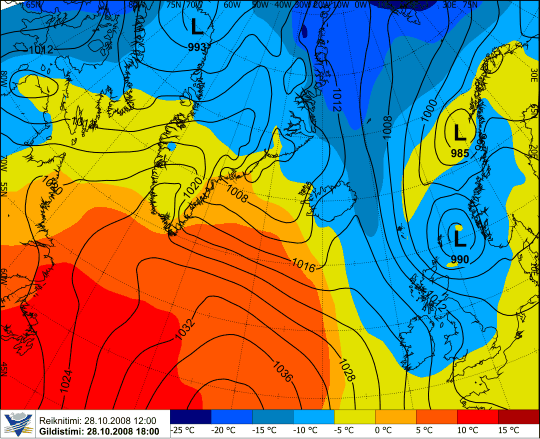
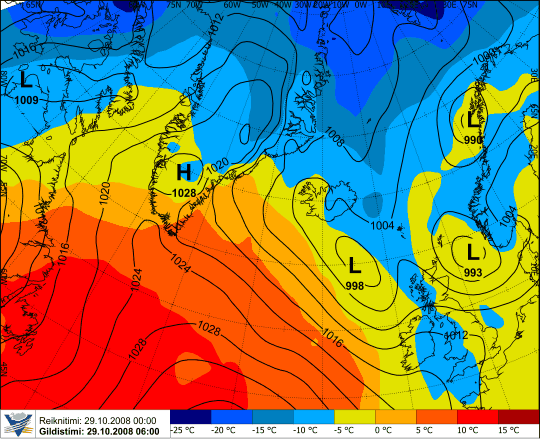
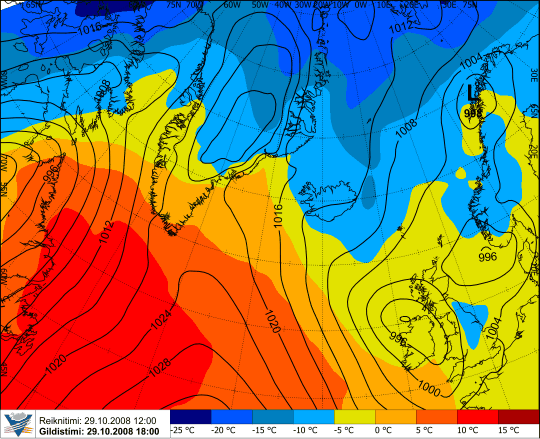
It did snow in places on the 28th/29th of October last year despite uppers of less than -5, although it was confined to higher elevations in the east (above 80m asl) by the time they did warm as that depression in the above chart bore down upon us. I agree though that uppers need to be below -6c for us in lowland Ireland to see some of the white stuff. 0 -
-
Deep Easterly wrote: »Snow can still happen at this time of year though, this time last year was a perfect example:
It did snow in places on the 28th/29th of October last year despite uppers of less than -5, although it was confined to higher elevations in the east (above 80m asl) by the time they did warm as that depression in the above chart bore down upon us. I agree though that uppers need to be below -6c for us in lowland Ireland to see some of the white stuff.
What about dewpoints though? couldn't you have an 850mb temps below -6C and the dewpoint could still be too high for snowfall?
with this in mind seeing as winter will be upon us shortly, perhaps it would be a good idea if there was a sticky thread on this board outlining all the conditions needed for snow?0 -
nacho libre wrote: »couldn't you have an 850mb temps below -6C and the dewpoint could still be too high for snowfall?
Yes you could, but off the top of my head I would say that such a set up would bring very unstable conditions which in itself could produce snow or hail.
A dew point of below 0c is the general rule of thumb for favorable snow conditions, but it can still rain with a negative Dp, while it can still snow with a positive one, although this type of snow tends to be wet and slushy. I am open the contradiction though.
Just depends on what the conditions are at the time. So keep watching those Dp's Mr Nacho.0 -
Deep Easterly wrote: »
It did snow in places on the 28th/29th of October last year despite uppers of less than -5, although it was confined to higher elevations in the east (above 80m asl) by the time they did warm as that depression in the above chart bore down upon us. I agree though that uppers need to be below -6c for us in lowland Ireland to see some of the white stuff.
Yep, we got a good covering of snow here last year, the week before Halloween. Only lasted a few hours though.0 -
Deep Easterly wrote: »Yes you could, but off the top of my head I would say that such a set up would bring very unstable conditions which in itself could produce snow or hail.
A dew point of below 0c is the general rule of thumb for favorable snow conditions, but it can still rain with a negative Dp, while it can still snow with a positive one, although this type of snow tends to be wet and slushy. I am open the contradiction though.
Just depends on what the conditions are at the time. So keep watching those Dp's Mr Nacho.
will do paddy1") i will also continue to look forlornly towards the north west this winter for a comma cloud to come our way. alas it has been too long since we had one:(. no doubt you will looking to the north east this winter for a huge blocking high over Scandinavia:) 0
i will also continue to look forlornly towards the north west this winter for a comma cloud to come our way. alas it has been too long since we had one:(. no doubt you will looking to the north east this winter for a huge blocking high over Scandinavia:) 0 -
nacho libre wrote: »on his site he predicts some significant falls about the second week in Nov, then Nov 16,
now look at this GFS chart(hopefully it won't have changed again by tomorrow)
Ken Ring uses an old folk weather tradition of predicting the weather based on exactly whatever happened 18 years and 11 days ago. That's all there is to it. No magic. Never heard of chaos theory obviously. If it were that simple I think everyone could dispense with supercomputers, numerical prediction models, and most of modern meteorology since around Newton. http://www.sillybeliefs.com/ring.html
Just curious, what would be sufficient evidence to reject Ken Ring's predictions? If it doesn't snow on his predicted dates, would that be enough? Do you think the weather repeats itself like clockwork?0 -
[/URL]
Do you think the weather repeats itself like clockwork?
i think the more important question is what do you think?
I never said he was the oracle of delphi and that we should dispense with tried and trusted scientific methods of predicting the weather. I started the post as a bit of fun as we head into the winter season.
Now on to his predictions, his prediction of snow in late Feburary and for the end of December is a safe bet because as we know it frequently snows around these periods in any given winter. Were he to be right about snowfall in November i'd say that was pause for consideration given his predictions for last summer and of an indian summer were largely spot on. However, you would dismiss this as pure luck or coincidence. His predictions to you are old wives tales, that if they do happen to come true on a consistent basis are just down to what can be deduced from studying patterns in our climate over time.
don't, Octo, worry your collegaues in Met Eireann won't be going out of business anytime soon0 -
Just for general interest, I can confirm that other people (including me) have done similar research to Ken Ring, from what I understand through limited opportunities to communicate directly, namely, using lunar cycles as one basis for data analysis, as well as other factors that some might think of as "astrological" but which strike me as having a physical plausibility in terms of rotating sectors in the solar system magnetic field, and how that might interact with our atmosphere.
Last winter (on the UK forum net-weather) I collaborated with fellow "lunatic" Blast from the Past, and we came up with a forecast that was widely seen as reasonably good, we called for a cold January and snowfall at times into early February and this certainly verified well. My summer 2009 forecast was not very detailed, I basically made the point that I thought it would be close to average as compared to the "bar-be-que summer" concept, and in fact this was probably closer to the case, what actually happened was that the bar-be-que summer concept did reasonably well for southeast England, and as anyone in Ireland would know better than me, it was decidedly a wet summer in western parts of the UK and Ireland.
So what I'm saying here is that some of these research avenues are promising, I don't think of them as having the full potential to "crack the code" because the identified large-scale signals like El Nino, NAO and PDO are obviously important and not as well understood by any means as they would need to be eventually, so I expect a sort of convergence of different methods in the future towards better or "even better" (being rather generous) long range forecasting.
Which leads us to the inevitable question, what about this winter? Leaning towards this idea -- rather mild most of the time now to Christmas with a few cold intervals, bits of snow, then colder around Christmas, briefly very mild again around New Years, and cold in mid-January. There could be a notable winter weather outbreak then. I suspect February may turn mild again like it did in 2009, perhaps about the same time or even from the start.
I will update that if I change the forecast after a full review (just about ready to publish one on Net-weather now, and so if further discussion changes this outlook, I will change this Irish version as well).
One thing I can say for sure after several years of extensive research and real-time watching is this -- around Ireland, you can count on windy and even stormy conditions more frequently than at random within 24 hours of the winter full and new moons. Unless the whole region is under a blocking high, any other pattern will usually develop a strong low near northwest Ireland at these times. This is, I believe, part of Ken Ring's thinking as well. There are other predictable storm times that I could discuss later, but some of them overlap with full and new moon in December and January more than other times of year. So this makes the storms a little more focused as well as the conventional meteorological factors.
I happen to be one of those people who suspect that the ancient peoples of the British Isles understood things about the connections between astronomy and weather that have sort of faded out of the organized body of knowledge, and that this was one of the motivations they had for building their sky-related monuments. I am not really confident that we could ever prove this conclusively, but the idea that they went to all that trouble just to identify the winter and summer solstice seems a bit daft to me, you could do that pretty easily without building huge stone rings. (Ken Ring, stone ring, hmmm)0 -
nacho libre wrote: »i think the more important question is what do you think?
I never said he was the oracle of delphi and that we should dispense with tried and trusted scientific methods of predicting the weather. I started the post as a bit of fun as we head into the winter season.
Now on to his predictions, his prediction of snow in late Feburary and for the end of December is a safe bet because as we know it frequently snows around these periods in any given winter. Were he to be right about snowfall in November i'd say that was pause for consideration given his predictions for last summer and of an indian summer were largely spot on. However, you would dismiss this as pure luck or coincidence. His predictions to you are old wives tales, that if they do happen to come true on a consistent basis are just down to what can be deduced from studying patterns in our climate over time.
Good post Nacho. I researched his methods and his site yesterday and I can't say I am fully convinced by either. Of course the proof is in the meteorological pudding and he may well have got a couple of situations right, but given the variability of the Irish climate, anybody's long range forecast could be proven right for some of the time at least; equally, it could be (and will be) proven wrong in other times.
The climate and weather of Ireland will not be narrowed down that easily! 0 -
Advertisement
-
This sounds like a testable hypothesis. Pick a site with a good long data record, say Malin Head or Valentia. Look up the times of the new and full moons, and get the wind averages 24 hours either side of it. Compare them to the constant long-term average, and you have a result. I’m sure if the findings were significant people would be interested. Personal observation can be tainted with subjective errors like confirmation bias, etc. You have to look at the data.M.T. Cranium wrote: »One thing I can say for sure after several years of extensive research and real-time watching is this -- around Ireland, you can count on windy and even stormy conditions more frequently than at random within 24 hours of the winter full and new moons. Unless the whole region is under a blocking high, any other pattern will usually develop a strong low near northwest Ireland at these times. This is, I believe, part of Ken Ring's thinking as well.
Sounds reasonable to me.M.T. Cranium wrote: »I happen to be one of those people who suspect that the ancient peoples of the British Isles understood things about the connections between astronomy and weather that have sort of faded out of the organized body of knowledge
I think you’re attributing a greater level of sophistication to him than he deserves. He simply goes back 18 years and 10/11 days, the Saros cycle. That’s it, there’s no more to it. This has been researched and apparently if you look hard enough at rainfall data over a long enough period with enough decimal places you’ll pick out a pattern – but then again there are many other such cycles aswell with similar magnitudes of influence. But they’re a very minor influence. This is astrology.nacho libre wrote: »i think the more important question is what do you think? I never said he was the oracle of delphi and that we should dispense with tried and trusted scientific methods of predicting the weather. I started the post as a bit of fun as we head into the winter season. Now on to his predictions, his prediction of snow in late Feburary and for the end of December is a safe bet because as we know it frequently snows around these periods in any given winter. Were he to be right about snowfall in November i'd say that was pause for consideration given his predictions for last summer and of an indian summer were largely spot on. However, you would dismiss this as pure luck or coincidence. His predictions to you are old wives tales, that if they do happen to come true on a consistent basis are just down to what can be deduced from studying patterns in our climate over time. don't, Octo, worry your collegaues in Met Eireann won't be going out of business anytime soon
So, you still haven’t answered – what would cause you to dismiss his forecasts as no greater than random for the time of year? What would have to happen for you to say he’s just a chancer?0 -
http://www.skepdic.com/fullmoon.html
The full moon has been linked to crime, suicide, mental illness, disasters, accidents, birthrates, fertility, and werewolves, among other things. Some people even buy and sell stocks according to phases of the moon, a method probably as successful as many others. Numerous studies have tried to find lunar effects. So far, the studies have failed to establish much of interest. Lunar effects that have been found have little or nothing to do with human behavior, e.g., the discovery of a slight effect of the moon on global temperature,* which in turn might have an effect on the growth of plants. Of course, there have been single studies here and there that have found correlations between various phases of the moon and this or that phenomenon, but nothing significant has been replicated sufficiently to warrant claiming a probable causal relationship.
Ivan Kelly, James Rotton and Roger Culver (1996) examined over 100 studies on lunar effects and concluded that the studies have failed to show a reliable and significant correlation (i.e., one not likely due to chance) between the full moon, or any other phase of the moon, and each of the following:
-the homicide rate
-traffic accidents
-crisis calls to police or fire stations
-domestic violence
-births of babies
-suicide
-major disasters
-casino payout rates
-assassinations
-kidnappings
-aggression by professional hockey players
-violence in prisons
-psychiatric admissions [one study found admissions were lowest during a full moon]
-agitated behavior by nursing home residents
-assaults
-gunshot wounds
-stabbings
-emergency room admissions [but see]
-behavioral outbursts of psychologically challenged rural adults
-lycanthropy
-vampirism
-alcoholism
-sleep walking
-epilepsy
If so many studies have failed to prove a significant correlation between the full moon and anything, why do so many people believe in these lunar myths? Kelly, Rotton, and Culver suspect four factors: media effects, folklore and tradition, misconceptions, and cognitive biases. A fifth factor should be considered, as well: communal reinforcement.0 -
Octo, you may be interested to know that I have done that sort of numerical analysis for temperature and precip data in eastern North America where there appears to be another "singularity" or what I call timing line related to lunar events. The conclusion drawn was that there is a signal of about 2-3 C deg and a 3-5 times random amount of precip. I did not have access to the necessary wind or pressure data but from those signals I would expect to find perhaps a doubling of random wind speed and a 3-5 mb pressure drop signal.
This comes from a large data set that probably includes many stronger cases (direct hits), some counter-examples, and some neutral or flat cases. In other words, these induced lows are scattering over a wide area that happens to coincide with a timing line or zone, and so more likely than not will create a signal, with some counter-examples.
So I would from recent observations of real time weather and looking back at analogue cases, expect that Malin Head in particular would show pretty strong signals and I would encourage somebody at met.ie or here with access to data to look into it. I have done some limited numerical analyses on the CET data for analogues to recent winters, and found temperature peaks that are similar to the above. More anecdotally, the Daniel Defoe storm in 1703 was at new moon, and the Jan 31 1953 windstorm was very shortly after full moon (which in my tables is timed at 0001 GMT 30 Jan 1953, and was a lunar eclipse too).
In fact, my analysis has also separated out a different set of lunar events that operate on the 27.3-day "sidereal" period (the Moon's motions against the fixed sky background) as opposed to the 29.5-day "synodic period" of full and new moons. The most significant energy peak in the shorter cycle is what I call northern max, the position of the full moon in December, where it achieves its highest declination and crosses the galactic equator. Also southern max, the opposite position, shows up as a strong peak. These events as you can visualize, move ahead of full and new moon progressively through the winter and by mid-summer the northern max is at new moon.
So in April and October, known to be windy months, the northern max events can be the strongest, and these will fall roughly five or six days after the full moon (in October) or new moon (in April). The warming influence of this northern max windy period may be a reason for the folklore advice to plant spring crops when the crescent new moon is visible (this is 2-3 days before northern max). I don't think any of these things are more than statistical indices embedded in a much more complex "atmospheric system" or machine, but they seem to be significant -- how significant would depend on how predictable you could make them after studying all the variables involved. The moon's orbit is fairly complex, it takes different paths through the sky over an 18.6 year cycle of declinations, and this cycle seemed to be part of what the ancients were concerned with in building their observatories.
Intriguingly, the "Chaco culture" people of northwest New Mexico who flourished around 800 AD built analogous observatories although on a much smaller scale. They also seemed to identify the range of lunar declination as significant. Perhaps it just interested them for esoteric reasons, but there are weather cycles that have been derived from studying the 18.6 year cycle, and more complex interactions with lunar perigee (an independent 8.85 year cycle). Somebody called David Dilley has some interesting research where he shows correlations between long-term temperature fluctuations and the strength of lunar "syzygy" events; these again are more statistical than hard-core predictive indicators (in my view at least).
There is no shortage of independent research into these lunar-atmospheric interactions, and solar system magnetic field variations, but I would say that they remain outside the mainstream and until somebody either breaks through the code of silence or comes up with an irrefutable predictive system that everyone can see is like tidal forecasts in accuracy, there is not going to be much acceptance in the profession of meteorology. That won't stop us from trying, it's sort of one of those holy grail situations. But there are so many other pathways to follow, numerical cycles based on entirely different causes for one thing.
Anyway, if somebody wanted to look at data, I would suggest, take a minimum of 50 years of data just for January and December, this is when the full moon and northern max are close enough together to form a unified signal, and you would have a little more than 100 data points (sometimes there are three full moons in 62 days, I think this coming winter is one example). I for one would be very interested to see the results, but I'd be willing to bet there was a signal of passing low pressure around the time of full moon, probably forced to a point of T+2 days because there is often a sort of trailing wave closer to Ireland when the strong low goes well north, so the expected temperature signal would be a gradual rise from T-3 days to a peak around T+1 or T+2 days. The new moon signal, I would expect to be similar but on a lower trend line. Finding historic full moon dates is relatively simple, but I could provide those.0 -
M.T. Cranium wrote: »I would encourage somebody at met.ie or here with access to data to look into it.
There is no shortage of independent research into these lunar-atmospheric interactions, and solar system magnetic field variations, but I would say that they remain outside the mainstream and until somebody either breaks through the code of silence or comes up with an irrefutable predictive system that everyone can see is like tidal forecasts in accuracy,
That data is easily available from climate section in met eireann. I don't think its someone else's job to test out your pet theories! Particularly when there's no causal mechanism stipulated.
I don't think there's any conspiracy theory. Whatever works, works. But there's a difference between evidence and a personal hunch.
I'd encourage you to check it out. It's fairly simple, you could do it all on MS excel. PM me and I'm sure a .csv file of hourly wind obs from Mailin Head wouldn't be that hard to come up with.0 -
I may try to do it then, I was focused on getting the CET data into a workable file on my computer, there's 237 years of daily data there and over 350 years of monthly data that I already have on file. But that's no good for these daily-scale events.
If somebody else is curious enough to look at it, let me know, I would welcome any help I can get, there are more tasks you could imagine in this research than time to do them, realistically this could use a larger research group and the budget, but this is the catch-22, to get the budget you have to do the groundwork that the budget would speed up ... oh well, nobody said this would be easy.0 -
So, you still haven’t answered – what would cause you to dismiss his forecasts as no greater than random for the time of year? What would have to happen for you to say he’s just a chancer?
i would dismiss his methods as completely unsound, if we were to compare his forecasting accuracy over a three- four year period( say beginning from last summer)with that of the UK met, or that of our own met eireann, and he was found to be consistently less accurate.
as it stands i'm not convinced he's an oracle, but in truth i don't have the required knowledge to refute or endorse his methods.0 -
I can only find daily data going back about a year on met.ie, is there a link to longer-term daily historical data?
Would also comment, I don't perceive it as a "conspiracy" against alternative methods, it's more like a perception that this has been disproven for all time, which is actually not the case, it's more like there has never been a proof accepted. Some have been submitted, but they don't come out of the process with any result at all, or they are just deemed to be "insufficient" proof without much structural guidance as to what would meet the test of sufficient proof.
I would say there are strong indications that some of these approaches are valid. They are far from being the whole story. That's where they bog down, correlations may give some encouragement, but even a correlation of .71 only explains half the variance of a climate model.0 -
It has to be remembered that even an absolute random and chaotic system will show certain patterns over a long period of time. Throw a dice over a period of time, record each result and doubtlessly a pattern will emerge, for example, the number 4 (or whatever number) could turn up on average every 6th throw and so on. That dosen't mean that the number 4 is destined to show up on every 6th throw or that the 6th throw has special significance. Just shows a random statistic that dosen't actually mean anything. 0
-
Anyone here ever check out joe bastardi on
www.accuweather.com ?
Go to uk/ie then go to his euro blog.
Interesting to say the least.0 -
Advertisement
-
M.T. Cranium wrote: »I can only find daily data going back about a year on met.ie, is there a link to longer-term daily historical data?
Would also comment, I don't perceive it as a "conspiracy" against alternative methods, it's more like a perception that this has been disproven for all time, which is actually not the case, it's more like there has never been a proof accepted. Some have been submitted, but they don't come out of the process with any result at all, or they are just deemed to be "insufficient" proof without much structural guidance as to what would meet the test of sufficient proof.
http://www.met.ie/climate/climate-data-information.asp
One study doesn't prove a theory. But if it's replicated a few times, then people begin to take notice.0 -
-
Sorry for a rather slow response, I didn't see that post until just now, and yes I think some of that might be useful.
In the meantime, Deep Easterly sent me a link for Malin Head data for a suitably long period (1974-present) and I have started to assemble a file of winter daily pressure readings to test out the idea about pressure waves related to full and new moon. So far with about a quarter of the data input, I see a pretty good indication of lower pressure at Malin Head at these times.
It's going to take me a week or more to finish this because of a variety of other commitments (like three hours of sleep every so often) but I noticed a few very strong wind storms at the full moons in December and January during the period (which is so far anecdotal) but the more significant proof would be a demonstrable pressure curve that reaches its low points at or predictably near full and new moon dates.
I will post the results of this when it's finished. Thanks for your various links to data. :cool:0 -
Looked like a savage full moon this morning.
Bad weather just passed=full moon????????0 -
Looked like a savage full moon this morning.
Bad weather just passed=full moon????????
Bad weather just passed=November??????
Looking forward to the results of your research MT. It will be interesting to find out if the fat of the moon has some effect on storminess. I wonder though, does the full moon only have an effect on storminess here in Ireland during the winter? or is more a global thing?0 -
The theory I am developing with my research is based on a sort of interference pattern that the moon is postulated to cause in the atmosphere, aligned with the earth's magnetic field. As a result of this process, there are apparently a number of "timing lines" that would be longitude lines if they ran north-south, but they tend to run more northwest-southeast from the North Magnetic Pole to the South Magnetic Pole. In the northern hemisphere, you could visualize where these timing lines were by taking a line from west of Iceland through Ireland and France into the central Med, then connecting that to the NMP (which you could locate at 80N 100W for simplicity). Then draw eight more at equal distances as if the sphere of the earth had the north magnetic pole as its north pole.
Actually the system was developed first from North American data which is why I numbered the timing lines from "one" running through the Great Lakes and east coast of the U.S., eastward. This places Ireland near timing line three in the system. Meanwhile timing line two would be just east of Newfoundland.
I have done a lot of research and observation to try to flesh out this theory over more or less the past thirty years (unfortunately not with any research funding so it has gone slower as I needed to work at other things). There are still considerable gaps in my observational experience over eastern Asia but I have become convinced of the reality of the system from timing line 7 in the central Pacific through to timing line 4 in eastern Europe. As to postulated timing lines 5 and 6, these would run through parts of Siberia, China, Japan, etc, and I have less data or observational time invested there.
As to the southern hemisphere connections, they seem to work out as well, with the basic idea being that the timing lines feed across the equator at quite a diagonal and then straighten out more as they head for the south magnetic pole (which is offset somewhat from being exactly opposite the north magnetic pole). This places timing line one from east Africa through the central Indian Ocean; the French antarctic research station at Kerguelen appears to be just east of timing line one. The timing line through Ireland (3) runs across the equator south of India and emerges into the southern westerlies near eastern Australia.
It's an intriguing system because of its non-linear correspondence to lat and long (the meteorological equator is similar to what this predicts, generally slightly south of the equator in the Pacific and north in the Indian Ocean, but an operational model would probably look somewhat refined from a simple nine-wave interference pattern.)
Anyway, you can see that I had already done some observational work (mostly on positions of low pressure centres) to work out where timing line three might be. Malin Head is probably about six hours downstream from it, which should mean that signals are just about coincident with astronomical events there (as most lows form downstream from their upper level support).
I can't guarantee it, but I imagine that Ken Ring has found some if not all of these factors and worked them into his forecasting. He may be ahead of me in terms of finding successful analogues. However, whether or not he does, I do not think the Moon is the only player in this system. I also use the timing lines to track what are postulated to be "atmospheric components" of solar system magnetic field sectors. For whatever reason (probably the variable strength of the geomagnetic field) this system works from the premise that when the earth is in a field sector, the effect shows up over timing line one (in eastern North America). The directional sense of this theory is that as the earth moves through field sectors, the effects move eastward. Therefore, any effects noted on timing line three would be (approximately) 80 degrees behind the earth in the solar system and falling further behind unlss they are retrograde in which case they are catching up to the earth and moving west.
You can see how a system like this could evolve into a long-range forecasting system but my numerical analysis has (rather frustratingly) yielded so many distinct components to this model that while correlation is starting to become encouraging, monthly or seasonal forecast accuracy has a long way to go yet.
As I have been working on this pretty much continuously (when possible) for most of my adult lifetime, I don't know if I am going to get it to some point where I can usefully pass it on soon (as I am now 60 and change and could drop off who knows when) but I have established some working contacts with one or two people a generation younger to put them through the same intellectual torture that I have given myself over this time frame.
I understand that Ken Ring is also quite a crusty character and believe me, this sort of research will try the patience of just about anyone, there are many leads and also many dead ends, and the scale of the research challenge is clearly enormous.
I will keep working on this winter pressure series until I can show the results in a week or so. As I believe was explained earlier, I theorize that these waves would decouple into two or three separate series after late January and the summer analogue of reinforced waves might be much less impressive since the storm track then runs further from Ireland (a study of pressure in western Iceland might show similar results).
I've hinted therefore that the full and new moon are not the only lunar "events" that are postulated to cause low pressure on the timing lines. The two major "alternates" happen to fall at full and new moon in late December and are not far separated from them any time from early December to late January. This is why I have used a data set that starts seven days before the full moon in the time period Nov 16 to Dec 14.
Last note here, there is a further complication that arose from detailed study of data from the Great Lakes region (my data base is extensive for Toronto which runs 1840-present). That complication is that timing lines are seen to oscillate east-west over a certain amplitude (about half a wavelength) in ways that may be predictable ... and this may explain a scatter of data or events concerning the exact time when low pressure crosses any given timing line. So this study is not likely to show more than a statistical tendency; individual cases are determined by several other factors.0 -
Advertisement
-
WOW MTC, that is some work you are doing! Do ya ever get time for a beer?

I would love to see some graphical representation of the work you are doing... all in good time I guess.0 -
I've had the odd beer, in fact I had a very odd one last night. 0
-
It's proving a bit easier than I expected to transfer the data into my working files here, so I expect to have this pressure analysis for Malin Head finished later today or Thursday. I have the data from 1974 to 1999 assembled already and so it's just a matter of transferring the last ten years into the file.
Every two or three years of data, I have updated the curves to see what I'm dealing with, and really after about ten years of data the pattern became relatively set and is only changing slightly as I add more data. So I can tell you roughly what this is going to look like.
Somebody warned me that pressure effects related to the Moon were very small, like fractions of a millibar, which I had already read in the literature, but this is actually a different study concept altogether, where the daily pressure wave of the Moon (which has a 24.9 hour cycle) is extrapolated from hourly data at various stations.
What I'm researching is something entirely different, the site-specific pressure signals from lunar events over a monthly scale, using daily pressure averages. In essence this is tracking low pressure development at given locations, and the pressure amplitude is much larger, so far I'm finding it to be in excess of 10 mbs. The lower pressures come at regular intervals relative to the full and new moon cycle, as I line up the data not by calendar dates as we are used to doing, but by lunar dates, which involves adjustments of calendar-oriented data sets by a range of plus or minus 15 days so that in my data set, day 1 falls seven days before the first full moon of the winter period (which I place in the range 16 Nov to 14 Dec so that on average we are looking at the data for Dec, Jan and the first half of Feb in the 76d data set).
This means that days 8, 38 and 67 are the statistical averages of the full moon dates in the compilation. New moons fall around days 23 and 53. The slightly variable lunar orbit means that if you fix the dates of full moon, new moon dates will vary slightly more, but this all smooths out in 35 years of data.
So far what I'm seeing is that the pressures fall to lowest average values right at the full and new moons in the January portion of the data, which is what I have been observing more anecdotally in the past five years as I joined UK and now Irish weather forums and got interested in the daily details of the weather in the British Isles. The same pressure wave extends from the beginning of the data set but seems a little longer than the 14.8 days implied by the full-new-full-new cycle. It's more like 16.5 days. This may be because in the late autumn, stronger lows frequently head for the vicinity of the Norwegian Sea and produce a vortex up there near timing line four in my model, so the seeding low pressure for that rushes by Ireland a few days before the full deepening of this vortex. But by January with blocking up in that region on more occasions, the actual timing line mechanism begins to dominate the pressure cycle.
Anyway, it looks like quite a regular 12-14 mb pressure oscillation over this period of time, and demonstrates that there very well may be a complex lunar atmospheric tide over the Atlantic basin. I'm sure that the same effect is happening over the eastern Pacific basin too, as many of our stronger winter storms occur at the midwinter full and new moons.
My theory would expect this pressure wave to break down into smaller harmonics through the spring and recombine into seasonally smaller waves in the summer, then decouple again in the early autumn.
So it's just a matter of putting in the rest of the data and then I'll transfer the file over here so you can see the effect.0 -
^^^^^
very intresting reading, not that i understand everything, but not to worry 0 -
Cheers MTC looking forward to your findings.0
-
Advertisement
-
I've finished the data entry and done some analysis on it, which is leading to some other concepts that I want to investigate before I report on it completely.
Also, I think I should start a new thread that is more topical to this research and not have it mixed up in the Ken Ring discussion, which got hijacked by this discussion. So look for a thread in a day or two that will be more suitable for further discussions of this concept of lunar-atmospheric interactions as they apply to Ireland (and specifically Malin Head).
Just to give a few glimpses of what the data show, for the 35 winters ending last winter (1974-75 to 2008-09) I found a regular pulse of atmospheric pressure having a period of about 16 days and an amplitude of about 10 mbs (from troughs of about 1004 mbs to peaks of about 1014 mbs on average), and the troughs coincided with full and new moon although with the longer period, this overlap was best in the late December and January part of the data set (which was designed to cover all December and January data as well as required extra data from late November or early February to keep the data centered on the lunar and not the solar-year calendar).
You'll see these details when I post graphs and more extensive discussions. I also looked at halves of the data for consistency. There was very good correlation from the half of data with the earlier full moon dates and the half with later full moon dates. So the timing of the lunar events in the calendar year does not affect the process noticeably. There was also good correlation of winters with higher overall pressure, with winters of lower overall pressure. In other words, whether it's a blocking pattern or a stormy winter, or just an average one, these pressure waves show up at about the same amplitude, just shifted up or down with the overall pressure trend.
Overall, I concluded that there was a significant process going on in the atmosphere to cause a peak of storminess around these winter full and new moons. There was a tendency to higher pressure especially in the period just before the January new moon, which is a time where the moon moves south across the equator and towards its "southern maximum declination" -- this pressure peak rapidly gives way to a trough at the time of the January new moon (I can say January new moon because the range of possible dates given the setup of my data is about 31 Dec to 30 Jan).
As to the longer cycle of 16 days, this may be explained by some offset process that a longer series of data covering the whole year would reveal, or it may be due to a gradual retrograde annual pressure wave embedded in the system. Since the period was expected to be 14.8 days, slowing it by one "pulse" per calendar year would lengthen it to about 16.2 days.
Of course, I have no idea yet what the data would show for other parts of the year. In any case, I would say, wait until I have time to post the whole analysis in a separate thread, and then we could discuss this interesting result further.0 -
Hi MTM.T. Cranium wrote: »I've finished the data entry and done some analysis on it, which is leading to some other concepts that I want to investigate before I report on it completely.
Also, I think I should start a new thread that is more topical to this research and not have it mixed up in the Ken Ring discussion, which got hijacked by this discussion. So look for a thread in a day or two that will be more suitable for further discussions of this concept of lunar-atmospheric interactions as they apply to Ireland (and specifically Malin Head).
Just to give a few glimpses of what the data show, for the 35 winters ending last winter (1974-75 to 2008-09) I found a regular pulse of atmospheric pressure having a period of about 16 days and an amplitude of about 10 mbs (from troughs of about 1004 mbs to peaks of about 1014 mbs on average), and the troughs coincided with full and new moon although with the longer period, this overlap was best in the late December and January part of the data set (which was designed to cover all December and January data as well as required extra data from late November or early February to keep the data centered on the lunar and not the solar-year calendar).
You'll see these details when I post graphs and more extensive discussions. I also looked at halves of the data for consistency. There was very good correlation from the half of data with the earlier full moon dates and the half with later full moon dates. So the timing of the lunar events in the calendar year does not affect the process noticeably. There was also good correlation of winters with higher overall pressure, with winters of lower overall pressure. In other words, whether it's a blocking pattern or a stormy winter, or just an average one, these pressure waves show up at about the same amplitude, just shifted up or down with the overall pressure trend.
Overall, I concluded that there was a significant process going on in the atmosphere to cause a peak of storminess around these winter full and new moons. There was a tendency to higher pressure especially in the period just before the January new moon, which is a time where the moon moves south across the equator and towards its "southern maximum declination" -- this pressure peak rapidly gives way to a trough at the time of the January new moon (I can say January new moon because the range of possible dates given the setup of my data is about 31 Dec to 30 Jan).
As to the longer cycle of 16 days, this may be explained by some offset process that a longer series of data covering the whole year would reveal, or it may be due to a gradual retrograde annual pressure wave embedded in the system. Since the period was expected to be 14.8 days, slowing it by one "pulse" per calendar year would lengthen it to about 16.2 days.
Of course, I have no idea yet what the data would show for other parts of the year. In any case, I would say, wait until I have time to post the whole analysis in a separate thread, and then we could discuss this interesting result further.
Ken Ring here, I had to register on this forum using this pseudonym to get on, because I made an error with my email address so could not activate membership.
I think your work confirms my work. There is an atmospheric tide that is cojoined to the ocean tide, as one would expect. After all, they are one interactive system. It would be weird if this was not so. High air pressure means the atmosphere overhead is piled up in a big wave crest and a low barometer indicates a trough overhead; and the opposite is happening with the seatide, so moon in northern declination brings the N hem higher tides but lowered barometer, and down in the other hemisphere this is reversed. The net effect is (I have found) that declination is in charge, and proximity of new/full moon focuses the timing. In other words the higher tidal variations come around full/new moons but it is lunar declination really moving the water. Moon in N dec causes higher tides for N hem and they wait till FM/NM to peak. It is no coincidence that highest tides of the month occur all over the world around the same date! The atmosphere is the same. The moon changing hemispheres is responsible for the barometric changes. What we have is a situation whereby the tilt of the earth is responsible for tides and probably therefore for life, because otherwise we would not have seasons nor photosynthesis. This because if the earth was upright there would be a constant equatorial tide only, and sunlight would not get through the constant cloud that would be on the daylight sun's side of the rotating earth.
regards
Ken Ring
www.predictweather.com0 -
Hi MT
Ken Ring here, I had to register on this forum using this pseudonym to get on, because I made an error with my email address so could not activate membership.
I think your work confirms my work. There is an atmospheric tide that is cojoined to the ocean tide, as one would expect. After all, they are one interactive system. It would be weird if this was not so. High air pressure means the atmosphere overhead is piled up in a big wave crest and a low barometer indicates a trough overhead; and the opposite is happening with the seatide, so moon in northern declination brings the N hem higher tides but lowered barometer, and down in the other hemisphere this is reversed. The net effect is (I have found) that declination is in charge, and proximity of new/full moon focuses the timing. In other words the higher tidal variations come around full/new moons but it is lunar declination really moving the water. Moon in N dec causes higher tides for N hem and they wait till FM/NM to peak. It is no coincidence that highest tides of the month occur all over the world around the same date! The atmosphere is the same. The moon changing hemispheres is responsible for the barometric changes. What we have is a situation whereby the tilt of the earth is responsible for tides and probably therefore for life, because otherwise we would not have seasons nor photosynthesis. This because if the earth was upright there would be a constant equatorial tide only, and sunlight would not get through the constant cloud that would be on the daylight sun's side of the rotating earth.
regards
Ken Ring
www.predictweather.com
Hi ken,
Have your thoughts changed much for this winter in ireland? Given net weathers permilary winter forecast?
k.0 -
Hi KHi ken,
Have your thoughts changed much for this winter in ireland? Given net weathers permilary winter forecast?
k.
I don't know what Net Weather are saying, and unless Sun and moon are involved in their calculations I think people are just shooting in the dark. No, I don't change something once I say it - it is virtually fixed in concrete, being based on a mathematical algorithm rather than a moving satellite with a rotating camera, anymore than publishers change commercial tidetables or diaries and calendars as a certain date is approached. As it says on my website, I think Ireland is looking at drier periods Dec 11-23 and Jan 21-31, wetter in the first half of January and the second half of February, March and April will probably be sodden washout months and Summer arrives in May.
regards
Ken Ring
www.predictweather.com0 -
Cheers for participating on here with your knowledge. I don't know if you are aware, but many of us here are continiously looking for snowfall during the winter time - probably due to the great lack of it in the past ten years or so... what are your thoughts on snowfall for the season ahead?0
-
Ken, thanks for the reply, I am working on the data file to incorporate a graph into a report on my data analysis which is otherwise ready for posting.
I will start a new thread so that this one can go back to the original topic at hand. Ken, I'm not sure if your research method looks into any other processes than lunar-atmospheric, but as mine does, we may not necessarily derive the same forecasts at all times.
I've been working on a winter forecast for Ireland (and for the UK) and it does show some hope for wintry weather mostly in the periods 17-27 December and 10-25 January. Not saying that it will be continuously cold and snowy in those periods, but those seem to be the best "windows of opportunity" for winter synoptics to develop. This forecast will be posted in the daily forecast thread as a special feature on Saturday (7th).
In my research, I have uncovered evidence of independent variables acting on the atmosphere, not only the lunar effects we are discussing here, but some other processes in the solar system's complex magnetic field. If our Moon were not active at all in the system, we'd be left with these other effects (in my view), which are longer-term variations on the time scale of months rather than days.
As to conventional factors in long-range forecasting, I have to suppose that these are all incorporated into the overall systems that are being studied in these alternative methods, for example, the El Nino may be predictable from some of these variables, and this might explain the teleconnections better than some concept of related signals. The one factor that I would certainly recognize as external to the system is volcanic dust -- if a major volcanic dust veil were to be introduced to any set-up, it would cool things down within that set-up. Obviously, large-scale changes in solar radiation would have the same effects, and this indicates an independent role for even the current small variations of the solar minimum period, but these background factors would not sizeably affect the pressure oscillations or therefore the storm tracks etc, just the overall temperature profiles of the whole system.
In any case, look for this other thread to open up with a discussion of the pressure patterns from the Malin Head data.0 -
Danno and MT
My wintry look is posted on
https://www.predictweather.co.nz/assets/articles/article_resources.php?id=159
The dates of Jan 20 and Feb 21 concur with MT. If the solar minimum continues then snow is obviously more likely.
To answer your qestion MT, I use solar cycles for rain amounts, moon cycles for rain timing, and midpoint astrology for crosschecking. I use no earth-bound factors as I consider them as a tail wagging a dog. As to volcanic dust as an example, my thinking is that anything in the air cannot alter weather, e.g. there is weather on other planets but no air, and the solar wind can be considered weather that goes throughout the cosmos, extending for about a light year. I have looked at temperature averages in various locations in years on either side of the Mt Pinatubo event and I can find no statistically valid variation from normal cyclic expectation. The air is only a gas moved around by weather that was formed by forces millions of miles away and by interstellar tides. In the same way an impurity introduced into the sea, no matter in what quantity or force, cannot alter tides.
As to moon or other factors, I think the wave that arrives at a shore or a shower on one's head is not a random event but the end of its journey, the resultant of huge and ancient-to-current extraterrestrial phenomena. I would not rule out any factors above the troposphere, but I think the weather script is already 'on paper' by the time it has entered our atmosphere. It then gets modified by orographic variables.
regards
Ken Ring
www.predictweather.com0 -
I recently posted a winter forecast on my daily forecast thread (on today's date, Sat 7 Nov).
Meanwhile, as to this other thread and the graphical presentation, I have encountered some problems converting my research computer file into a worksheet that is compatible with MS word, and while I think this can be solved over a day or two of fiddling, I have to go out of town for most of this week and my internet time after this session is going to be very limited, so I wanted to just post the "heart" of the data which shows the pressure oscillation at Malin Head around the times of the late December to early January full moon and the following January new moon.
This is a bit rough and ready, but what you see below is the average pressure from day 30 of the data series to day 62 in the mid-winter part of the data, and places the full moon at day 8 of this segment (day 37 of the larger set). Each ("X") here represents half a millibar above 1000 mbs. The actual values are shown. The mean range of dates here is very similar to the coming winter's actual timetable where the full moons are on 2 and 31 Dec, and 30 Jan. So this would represent the part of the data corresponding to about 24 Dec to 25 Jan this coming winter. However, it's not meant as a prediction, that would involve factoring in other parts of the theory. I do think that we will see strong low pressure with the 31 Dec and 30 Jan full moons, and with the 15 Jan new moon.
XXXXXXXXXXXXXXXXXXXXXXXX 12.1
XXXXXXXXXXXXXXXXX 8.7
XXXXXXXXXXXXX 6.3
XXXXXXXXXXXXXXXXX 8.5
XXXXXXXXXXXXXXXX 7.9
XXXXXXXXXXXXXXX 7.6
XXXXXXXXXXXXXX 7.0
XXXXXXXXXX 4.8 (full moon)
XXXXXXXXXXX 5.4
XXXXXXXXXX 4.8
XXXXXXXXXXX 5.6
XXXXXXXXXXXXXXXX 8.1
XXXXXXXXXXXXXXX 7.7
XXXXXXXXXXXXXX 6.8
XXXXXXXXXXXXXXXXXXX 9.4
XXXXXXXXXXXXXXXXXXXXXXX 11.3
XXXXXXXXXXXXXXXXXXXXXX 10.9
XXXXXXXXXXXXXXXXXXXXXXX 11.7
XXXXXXXXXXXXXXXXXXXXXXXXXXX 13.3
XXXXXXXXXXXXXXXXXXXX 9.9
XXXXXXXXXXXXX 6.7
XXXXXXXXXX 5.2
XXXX 2.2 (new moon)
XXXXXXXX 4.1
XXXXXXXXXXX 5.3
XXXXXXXXXXXXXXX 7.3
XXXXXXXXXXXXXXXXXXX 9.7
XXXXXXXXXXXXXXXXXXXXX 10.7
XXXXXXXXXXXXXXXXXXXXXX 10.9
XXXXXXXXXXXXXXXXXXXXXXXX 11.9
XXXXXXXXXXXXXXXXXXXXXXXX 12.1
XXXXXXXXXXXXXXXXXXXXXX 11.0
XXXXXXXXXXXXXXXXX 8.5
This shows quite clearly a regular oscillation of pressure related to the lunar cycle, at least for the winters of the past 35 years. The range of full moon dates that fall into this part of the data set would be 16 Dec to 14 Jan, and the range of new moon dates would be 31 Dec to 30 Jan.
The secondary trough at day 39 (F+2) is probably the signature of the full moon "event" from upstream timing line 2 running across timing line three. In general, you can see how low pressure seems to "hang around" for about five or six days at this point in the lunar cycle, then higher pressure develops until the sharper trough of the new moon event replaces it.
As I discussed earlier, the winters with lower average pressure have basically this same process on a lower trend line, so the troughs are more like 995 mbs. Winters with higher average pressure would basically see a relaxation of the strong blocking highs as storms would take a far northern route but the pattern is similar.
Once I get back to home base I can work on the data file more and get this worked up to a better overall presentation, but I wanted people to have a chance to see these results.0 -
Thanks MT
The main point is that the moon by virtue of creating an upper tide exerts a huge influence on air pressure. Changes in air pressure are what we perceive as 'weather'. Lunar declination moves the volumes of both sea and air and the system 'waits' for full and new moons to culminate as peaks. Yet most meteorologists deny the moon has any role at all in influencing air pressures.
It seems we can't view attachments here, but I would be very interested to see your working graph, if you wouldn't mind emailing me on ken@predictweather.com
In return, I too have some graphs that perhaps may be of interest.
regards
Ken Ring
www.predictweather.com0 -
I believe the main reason for official skepticism is that research in the past has followed the concept of daily "tides" in the atmosphere on the 24.9 hour time scale, and also that obviously the effect that we are talking about does not happen at all points in the atmosphere at the same time. To find this effect, you have to have a timing structure, otherwise you would mix together places in phase and places out of phase with the effects. It would be like driving through a zone of heavy radio interference (near a transmitter), averaging out the effects and saying there was half a radio signal in the region. Of course, reality is, there is either a radio signal, or nothing. It's that kind of paradigm we are dealing with, shaped by fluid processes and climatology.0
-
Advertisement


Advertisement