Midlands
4.1kWp SW with Winter Shading, 3.3kWp NE
552kW imported (two EV household)
637kWh Generated
579.95kWh consumed
270kWh diverted to Eddi
147.2kWh diverted to Zappi
Approx 902.8kms of range into the EVs
Highest was 34.1kWh
Lowest was 4.1kWh
58% self sufficient (excluding Evs)
51% self sufficient (including Evs)
Monthly cash saving based on average daily load and all non-load items like dishwasher/washing machine/immersion at night rate, €58.99
My savings are "low" versus others as I'm on the fixed Energia plan with low rates (5.84c night). April this year is 20% lower than last year. Passed the 7MWh since install. Hopefully my second string and battery setup will be finalised in May which will give considerable boost to the numbers.
741KW generated for April up from 664KW in March. 7.2K South Facing. 142KW of April's generation went to the eddi.
Yep, at the moment have only 5kw batteries but I have 20kw DIY batteries on the way. Half of them due to be delivered on Friday and others hopefully in the coming days
6th Month
Dublin - Lucan - April 22 - 7.12kW total installed (S: 3.45kW, E: 2.41kW, W: 1.38kW). E&W Optimised. 5KWh Battery, (30 S & 22.5 E/W degree pitch).
Total Generation: 652kWh (213kWh consumed directly, 167kWh into battery, 272KWh to grid)
Best Day: April 24th - 38.0kWh
Worst Day: April 12th - 3.8kWh
Total Consumption: 462kWh (83% Solar:17% Grid (77kWh))
Milestones:
4kw shy of 2MWh generated since install last October
2nd Month Generation Exceeds Consumption
3 Days no import 15th, 21st and 24th
270kWh for April 2.5Kw system in louth west facing
Best day 14.9 on 24 April
Worse 1.8 on 12 April
Broke 2.3mWh day after 1st anniversary of Install first full year was 2296kWh
April 552 kWh
Best Day 09th 29.3 kWh
Worst Day 11th 6kWh
We are coming up to 1st full year since install on 07thMay21. Have generated 4617 kWh since install. We (3 adults and 2 kids) have consumed 6271 kWh. We are lucky enough to have net metering so have effectively only paid for 1654 kWh since install.
A little over €300 consumption costs (excluding standing charges) as well as a reduction on our use of oil. Significant financial and environmental benefits.
Very happy with year 1. Looking forward to expanding the system.
5.4 kwp east west split-
April generation 444kwh
Very similar installation as yourself handpref (5.3Kwp here split 1.5Kwp East/3.8Kwp West) in Dublin 16. Although fairly dissimilar production graphs for the month.
Totaled 479Kwp for the month verses your 444Kwp. That's close enough that it doesn't matter a dam. It's interesting to me that you have a 5x days with more than 25Kwhr to my 2. Where are you located? Just wondering if you had any shading on the start of the month (for example a chimney that might have been reducing production which no longer was an issue later on when the sun was higher?)
First full month, 3.1 East/ 2.4 West, 504kWh.
There is smth not right with these figures. How can battery discharge is higher than charge?
Can do - albeit it depends on how they classify it. "Generation" was 741Kwhr of which 263kwhr went to the battery. There's a 31Kwhr in "Energy from Grid" which of course you'd need to specify where that went. Did it go to the house, or the battery? Interestingly, if you add 263Kwhr, and that 31Kwhr, you get 294Kwhr - which is pretty close to that 290Kwhr which the battery discharges. So you probably have 27kwhr of that 31kwhr (from the grid) going to the battery. I know - I know.......
GivEnergy are also guilty of that ambiguity.
Just did the maths on my electricity bill for the last 2 months. Generated 615kw of solar. Used 400kwh less (day usage) than the same time last year when we didn't have solar pv (Feb - April). Saved 89 euro on just the energy. Add vat and it becomes €101 saving.
Also saved 139kwh night rate which was €17 savings. I assume it's down to the heat pump drier we have.
3.24kw system facing west
I was wondering if the figures should not be otherway round. There are charge/discharge loses and 10% is a figure that I would expect.
Ohh 100% mate. Totally agree with you - they all do it though. There's a certain ambigutiy around where they are measuring.....and they could be clearer as to where the stuff goes.
April Stats
6.2kWp (2.8 south/3.4 west), 20kWh battery, Zappi & Eddi – Donegal
Generation – 575.9kWh, a 12% decrease from 2021
Export – 14.9kWh, down from 79.3kWh in 2021
Import – 277.3kWh, slight (17kWh) increase from 2021
Best day – 27th 36.8kWh
Worst day - 4th, 3.6kWh
Days with less than 1kWh purchased - 10
I like that stat. As in the metric itself......useful stat to know.
Yeah I had previously counted days with zero export but even on a great day you'll sometimes buy 0.1 or so just by bad timing so I count the sub 1 days instead.
The reality is that every single day is a day with less than 1kwh since the inverters cannot detect with 100% accuracy the usage as they still take some time to react to the load.
It might be: Days with apparently less than 1kWh purchased - 10
6.8 kwp Wexford. Eddi and Zappi. 2 EVs.
Generated: 807kWh
Exported: 164kWh
Imported: 314kWh
Zappi: 348kWh
Eddi: 53kWr
Lowest generation day: May 5th - 3.3kWh
Highest generation day: May 24th - 45.9kWh
Very true - although you could argue that the latency works both ways. You might be exporting a little before the inverter logs it as an export, in which case you may have "balanced" some of the import that you had delays in logging. If you follow me?
The main thing though isn't really about 0Kwhr or <1Kwhr, it's that the "number of days" figure. I like the stat, it's a good one.
For me, it's easy! Everyday I don't have enough :-)
Whey hey, for sub 1kW imports
10 days in March
15 days in April
4.8kW EW Dublin. 10kWh DIY battery
April 2022 (kWh):
Production: 501 (442 predicted, 563 last year)
Consumption: 752.1
Import: 283(53d, 230n)
Export: 31.9 (94.2 last year)
Best day: 24th: 27.9
Worst day: 12th: 3.4
8.16kW Midlands. 5kWh battery, Eddi, Zappi, EV
Down slightly on March and up slightly on projected production. Have been away for the last 10days so exported more than normal.
Generated 857.5kWh
Consumed 654.6kWh
Battery 155kW
Zappi 119.8kW
Eddi 95.9kW
Only one day beat the highs of March which was on the 29th at 46.7kW.
Just completed my first full year of solar yesterday.A 2.5 kwh system facing south in Galway.
Total for the year was a respectable 2,708 kwh.
Best day was 18.9kwh.
Worst day was .6kwh
Best month was July with 339.7kwh.
Worst was December with 67.8kwh.
I'm calling it early!!...... its 19:30 but heavy clouds if I get another 0.5 kWh today Ill be very lucky
Anyway big month 811 kWh..... best bay 44.2 kWh and worst day 6.5 kWh
My home assistant is saying 830 kWh and that's from a ShellyEM, but I have been using Solis readings all the way along so I will be consistent. Actually from the solis web page its saying 800 kWh but the reading from the actual inverter scrolling through it says 811 kWh. I think they updated the online portal during the month so I am assuming the online reading is a bit short.
What HA is saying though I generated more energy than I consumed for the month, but actually only used 40% of it the rest went back into the grid. I am happy with that at least I can say I am carbon neutral.
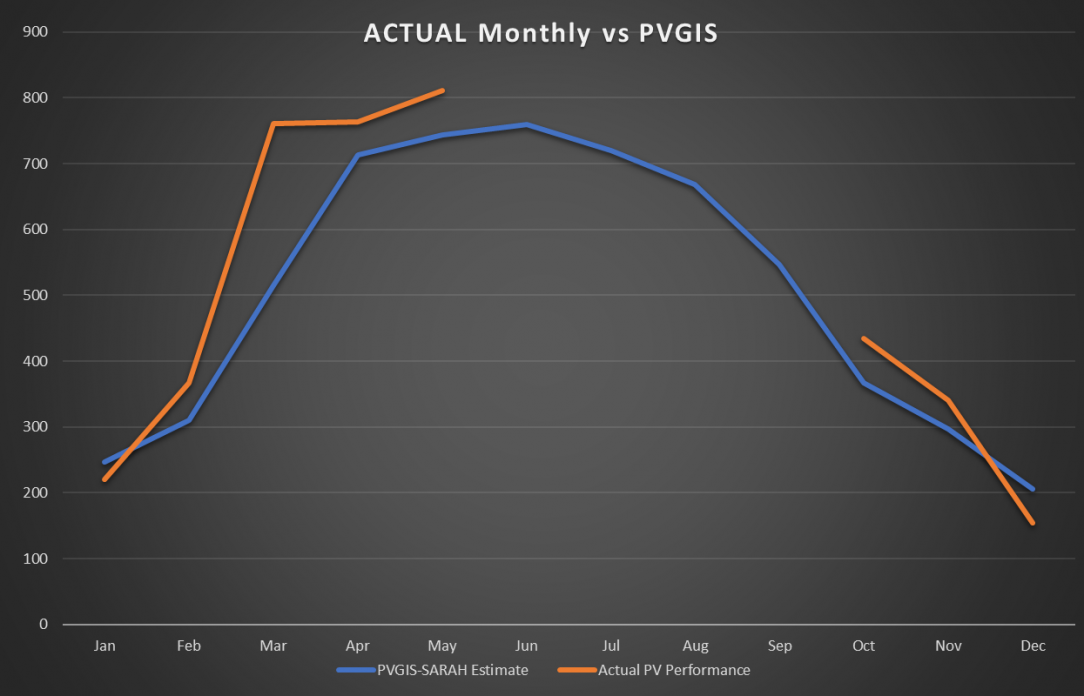
I also over performed on the PVGIS-SARAH estimate by about 10%.
All data on the PVStats website and the google sheets doc
I'd say the Shelly is more accurate, as the logging is only every 5 minutes on the solis.
1.12MWh, the new array is helping. Will I get 1.5MWh next month?
May Stats
3.9kWp (S), 10kWh battery, 22 deg Slope
 Generation – 445.69 kWh
 Consumed  - 314.52 kWh
 Import   – 19.02 kWh
 Export   – 100.39 kWh
 Edd9    - 31.7 kWh
 Zappi   - 58.6 kWh
Meter Readings 05238 (01099 Day - up 3 / 04138 Night - up 11) - Gas 6239
Totals so far:


Month    |   2020 |   2021 |   2022 |
---------+--------+--------+--------+
January  |     75 |     56 |     81 |
February |    122 |    142 |    111 |
March    |    200 |    269 |    370 |
April    |    279 |    373 |    372 |
May      |    396 |    430 |    445 |
June     |    264 |    425 |        |
July     |    261 |    387 |        |
August   |    254 |    264 |        |
September|    268 |    248 |        |
October  |    151 |    185 |        |
November |     90 |     78 |        |
December |     56 |     52 |        |
---------+--------+--------+--------+
Total    |   2.41 |   2.90 |   1.38 |
Boards.ie - Solar Capacity and production analysis - https://www.pvstats.eu/home.pl
4.83kWp south facing, Dublin Fingal
606kWh generated
196kWh exported (67% solar self-consumption)
26kWh imported
33kWh generated best day (14th May)
5kWh generated worst day(s) (9th and 17th May)
A big drop in self-consumption this month. Haven't been using the oil radiators, and it hasn't been warm enough to warrant the portable AC unit either. The 5kWh battery has been covering our needs entirely since 9th May (charged from grid a few nights at start of May as weather was muck).
May 2022 (kWh):
Production: 584.7 (579 predicted, 650.6 last year)
Consumption: 690.3
Import: 149(41d, 108n)
Export: 53.4 (123.5 last year) - was away a few days
Best day: 27th: 31.1
Worst day: 9th: 5.7




![Photo of [Deleted User]](https://w0.vanillicon.com/v2/0e54e8024b002427df3ce2953d22b721.svg)