Hi - We mentioned last month that we would share some KPI’s around traffic, posting etc which will allow us to monitor key metrics as we continue on our journey.
Moving on from the rocky migration we are starting to see a return of users, contributors and traffic. Overall the numbers are positive and growing. We are seeing positive growth across all metrics. We are still struggling from an ad revenue standpoint - particularly Google ads and while our ad view-ability is high, CPM’s are low and even with our high volume of traffic they are not converting. We are actively implementing fixes here.
Our active user count below illustrates daily users who are engaging with the site. This does not mean we have this level of contributors - these users are active on the site - i.e. logging in and engaging with content. If we look back to October of last year for a comparison we have gone from an average of about 4200 users per day.
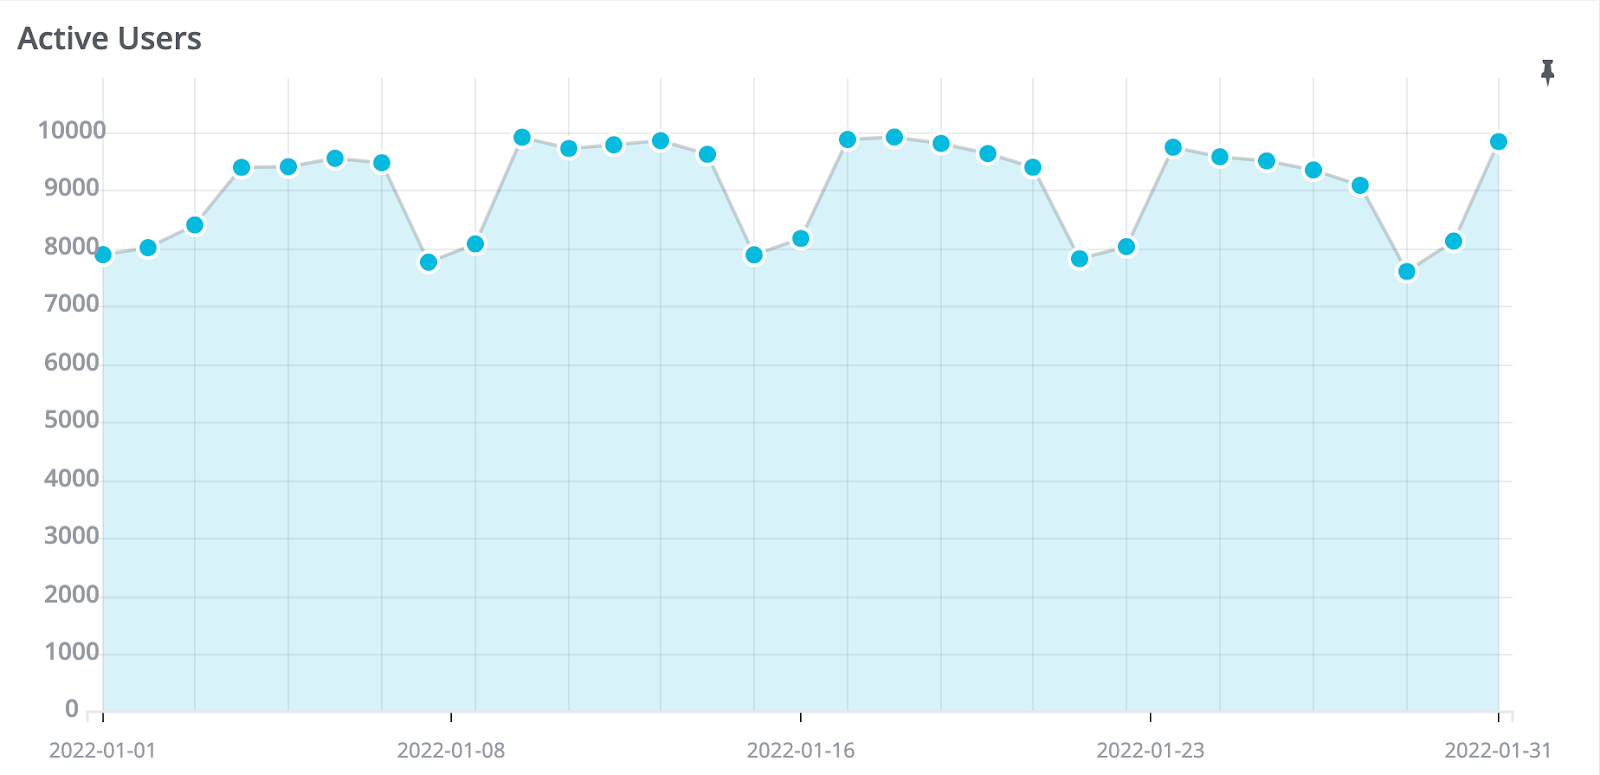
Our active user count continues as we welcome another 1,907 users to the platform in January.
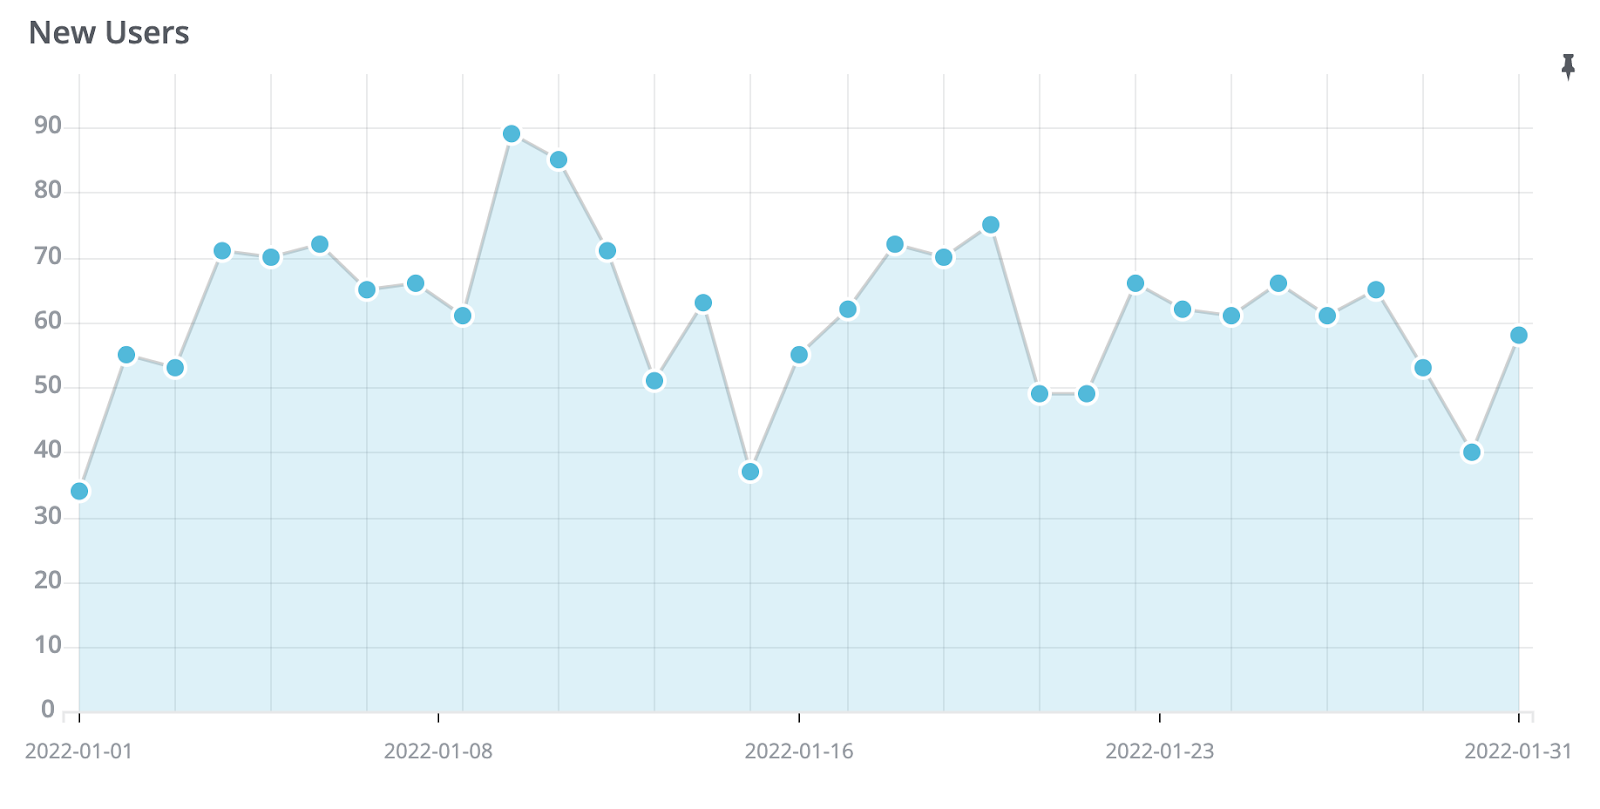
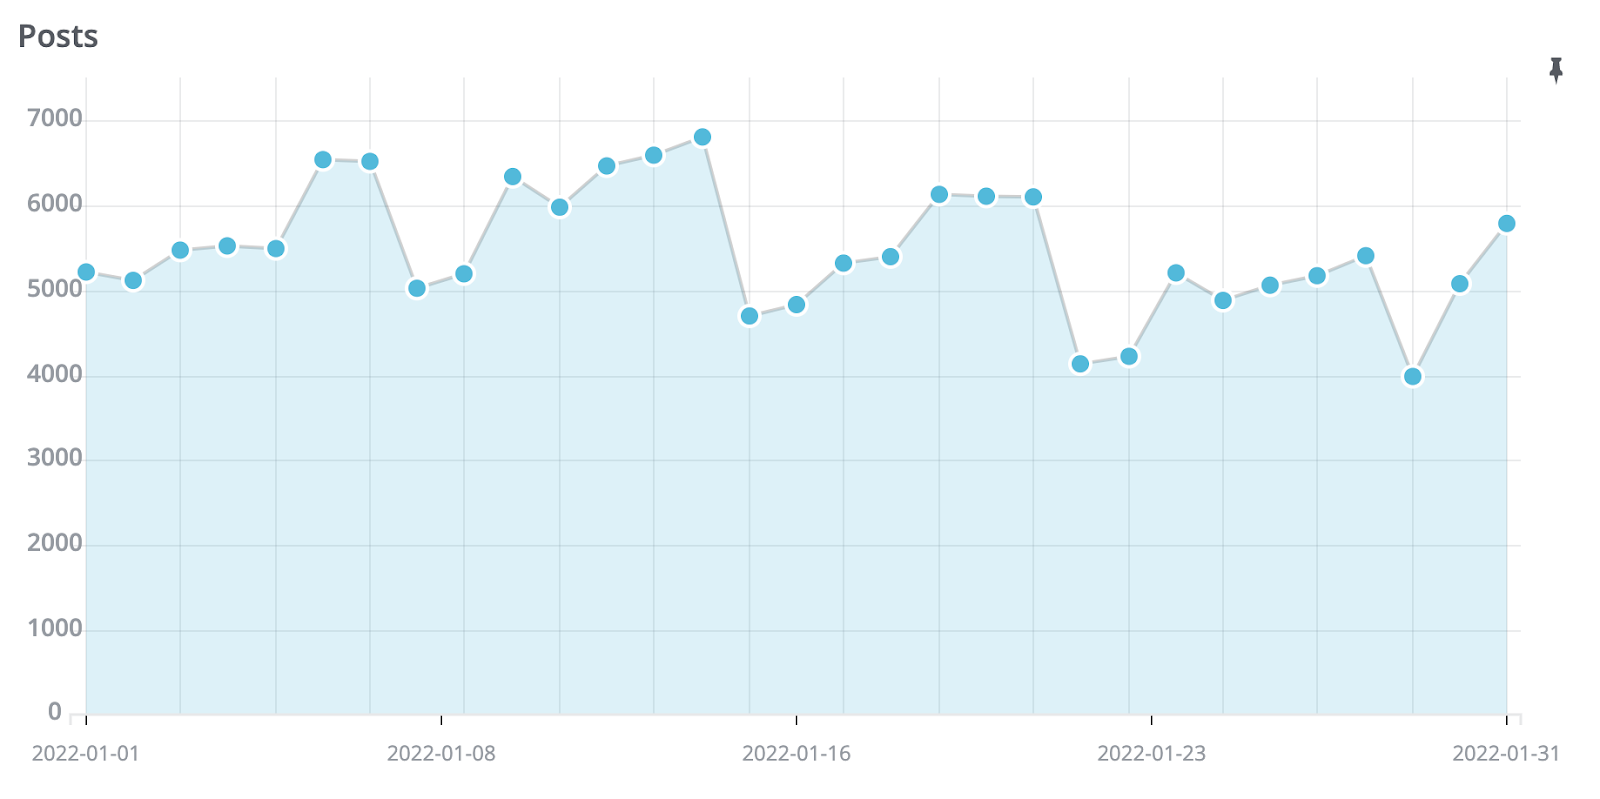
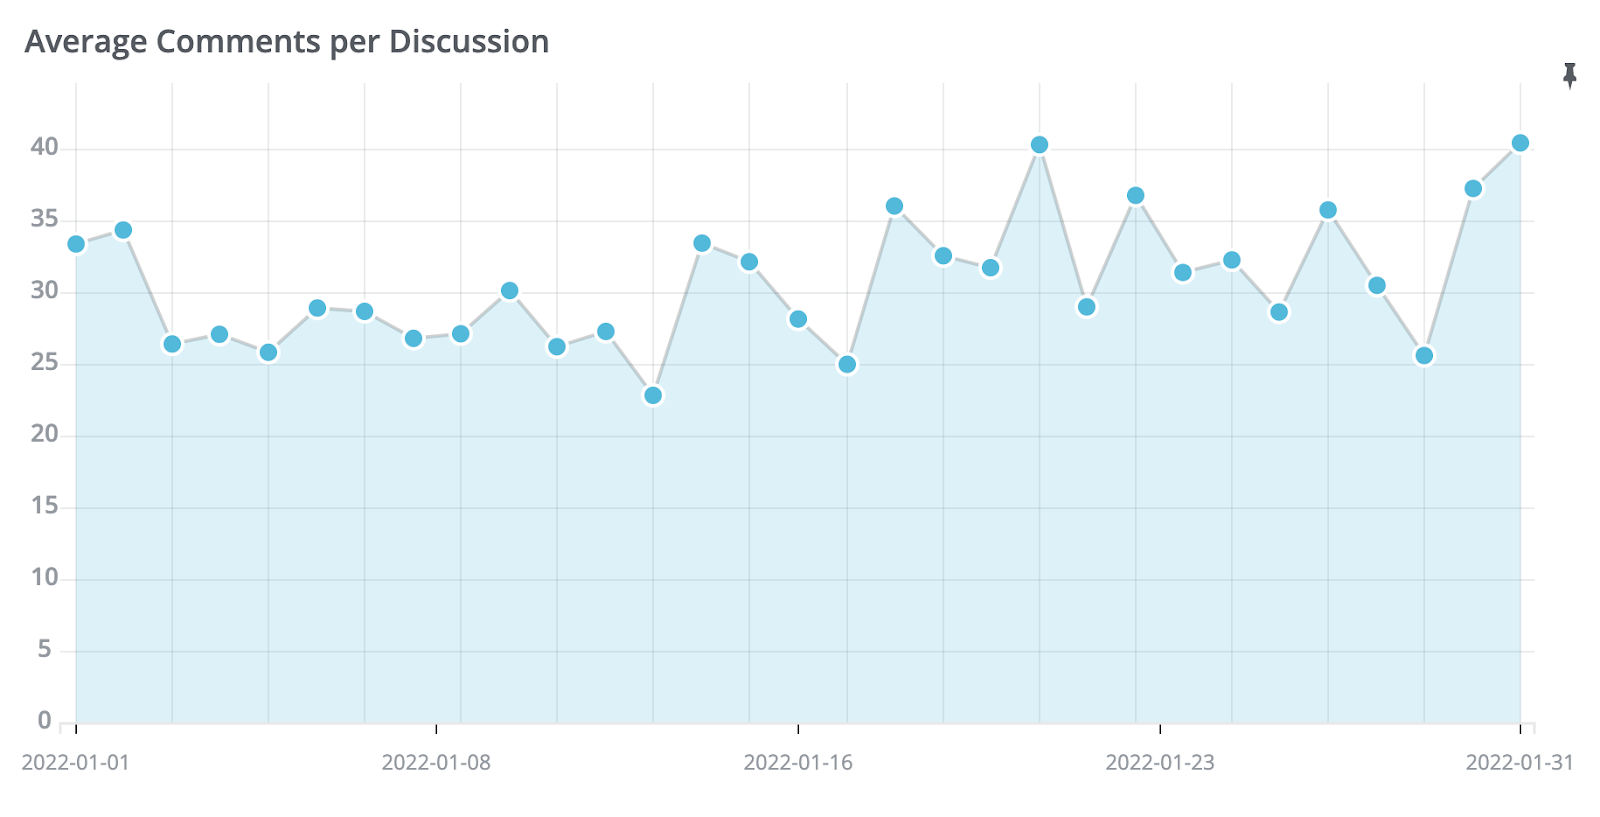
Post count will lag significantly behind user engagement however our daily post tally continues to grow. Looking back to October our highest daily post count for the month was 6,269 with an average of about 4200. January 2022 see us hit and average of 5663 with a high of 6,613.
Participation rate is up slightly from last quarter at about 1% and we saw 6 new movers on the most discussions board. We will make this more widely available over the coming weeks.
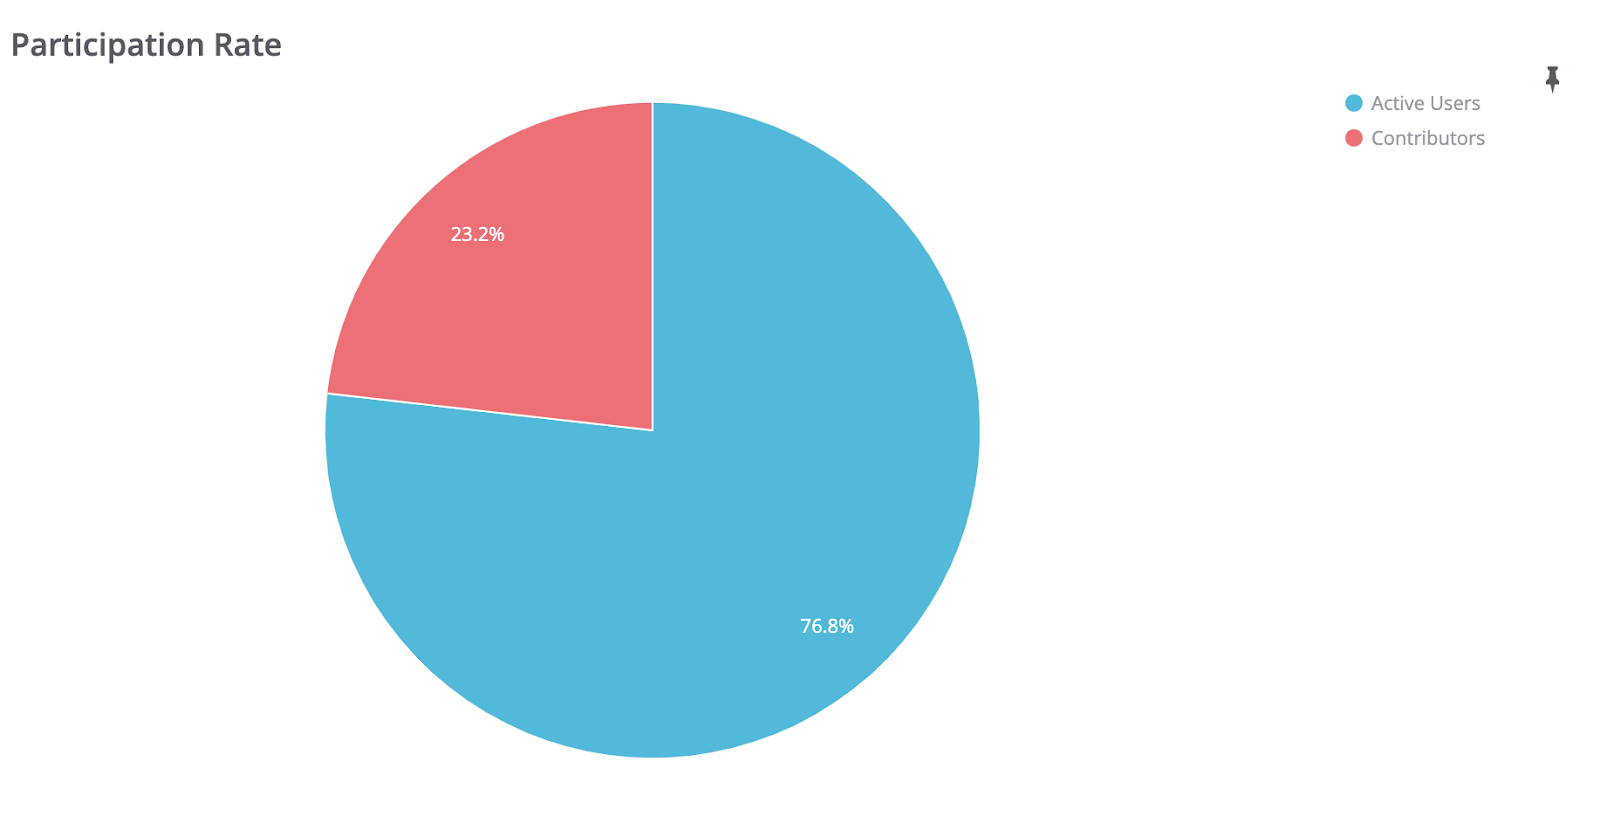
REMOVING TOP 10 POSTERS.
We switched to GA4 last year so measurement to pre migration is difficult. Traffic overall is growing month on month. Below shows our traffic for January v’s December (which we would expect to be quieter…) however our active and 30 day active user count are all showing positive gains.
https://lh3.googleusercontent.com/HI2NgnZZxVyg9ThlR89mpfrYG_Y1qtHsvvnRWqur2SFDTQxYmkw3Rh2taX8kcGNCnBI0jM7XEp5meOEhlVIpVIRENI2avd37PjpKBr89PBkCL-9KqsUB8Z3lTvZPBZtpp32e6dsP
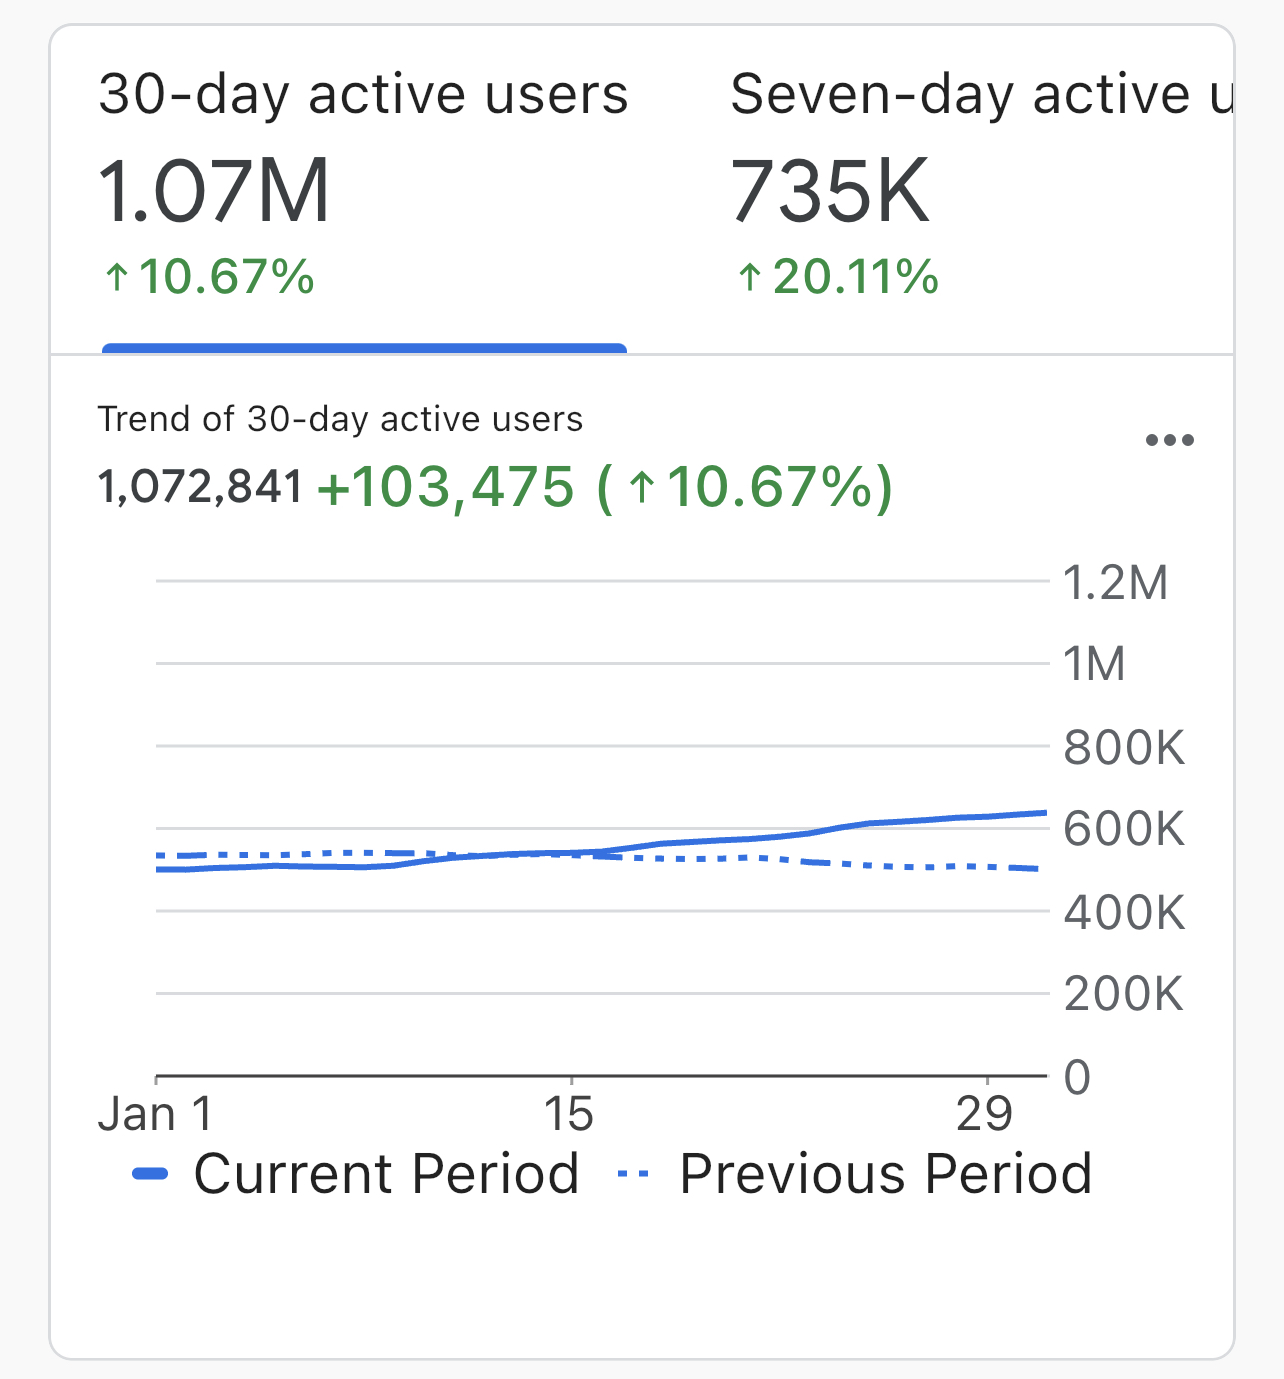
30-Day Active Users: the number of unique users who initiated sessions on your site or app from January 1 through January 28 (the entire 28 days of your date range).
Keep an eye out for February stats where we will hopefully follow the same trend.
Thanks
Odhran


![Photo of [Deleted User]](https://w7.vanillicon.com/v2/761dc761e98b4e4a2ae41c6abf8a928b.svg)

![Photo of [Deleted User]](https://wc.vanillicon.com/v2/c5d609878babf3bd4f08996ef5fd9c51.svg)


![Photo of [Deleted User]](https://w1.vanillicon.com/v2/1751471ae521095b085946f3afd00e1d.svg)


![Photo of [Deleted User]](https://w1.vanillicon.com/v2/11f397efbb618f280f346771bb290fe0.svg)

![Photo of [Deleted User]](https://w0.vanillicon.com/v2/0e28477cb8381b089d86bb2f8d128369.svg)
![Photo of [Deleted User]](https://w6.vanillicon.com/v2/62877c35768f143f69acd7bb6cd43f3c.svg)
