Akrasia wrote: » So here we are, someone made a predictive statement 30 years ago that has come true, and you're arguing that it was a wild prediction.
According to NASA global average temperature increases are measured against pre-industrial temperatures, and the cut-off is the mean for the period 1880 -1899 Have you had any luck finding any climate skeptic predictions from 30 years ago that have come true?
Gaoth Laidir wrote: » So a 75% that it's not. That's good.
Gaoth Laidir wrote: » It came through? It was a conservative estimate, meaning that the chances were that it would be nearer to or greater than 7 degrees. You're clinging onto the 0.1 degree on the bottom of his range and yet claiming it's totally correct?
I've lost count, but how many nations have we lost to sea rise so far?
https://www.nature.com/articles/s41467-018-02985-8 Our results indicate that sea-level rise will continue until and beyond 2300 even for scenarios that reach net-zero GHG emissions in the second half of the 21st century. The long-term sea-level legacy under the Paris Agreement scenarios are strongly influenced by emission reductions in the next couple of decades because offsetting sea-level rise in the 22nd and 23rd centuries is hindered by its high inertia, low reversibility and the limited effect of net-zero GHG emissions. By combining climate and sea-level uncertainties, our analysis reveals a persistent risk of high sea-level rise even under pathways in line with the Paris Agreement. However, extreme sea-level rise projections at the 95th percentile of our distribution can be halved through early and stringent emission reductions.
There was a relative slowdown in the warming trend for nearly 2 decades, and warming is observed to be barely keeping up with the RPCs, so again, if we want to play by your rules then these predictions were not far off.
dense wrote: » "I lose sleep over climate change almost every single night. I can't remember how long this has been happening, but it's been quite a while, and it's only getting worse. I confess: I need help. Like many people who care about the fate of the planet, I've spent most of the past year alternating between soul-crushing despair and headstrong hope. I'm a meteorologist by training and a journalist by profession."
Akrasia wrote: » 65%
Akrasia wrote: » Yes, the prediction was between 1 and 7 degrees, and temperatures have risen by more than 1 degree c in less time than he said they would. And, this is before you even realise that he was almost certainly talking in degrees Fahrenheit, which is the standard temperature scale used in the USA, so temperatures in 2016 are about 2 degrees Fahrenheit above preindustrial, and the 'conservative' prediction refers to a range of about 1c to 3.5c.
Where in this report anywhere does it say that the sea level rises would flood these nations by 2018? The sea level rises are something that we get committed to over time. The climate and ice loss have inertia, warming that we cause now commit to long term changes even if we stop all emissions today. here's a study from this year that explains this. Even this study is conservative because it doesn't look at the possibility of rapid ice loss in the west antarctic or greenland ice sheets which we are seeing more evidence of recently.
The RCPs don't deal primarily with warming, they deal with emissions. You can add in an estimate for climate sensitivity onto any of the RCPs and get different results. It's up to you to justify your climate sensitivity figures with evidence. The current consensus is that climate sensitivity is between 1.5 and 4.5c with the most likely figure being closest to 3c
And we're on the RCP 8.5 emissions scenario at the moment, and by 'barely keeping up' you actually mean still within the predicted range when you include the error bars to allow for natural variability. Do the projections account for the cooler sun at the moment? Probably not. What happens when the sun returns to it's normal strength. The low res models sometimes choose to ignore natural oscillations because they tend to balance out over time so are not important at the timescales the models are looking at.
Akrasia wrote: » According to NASA
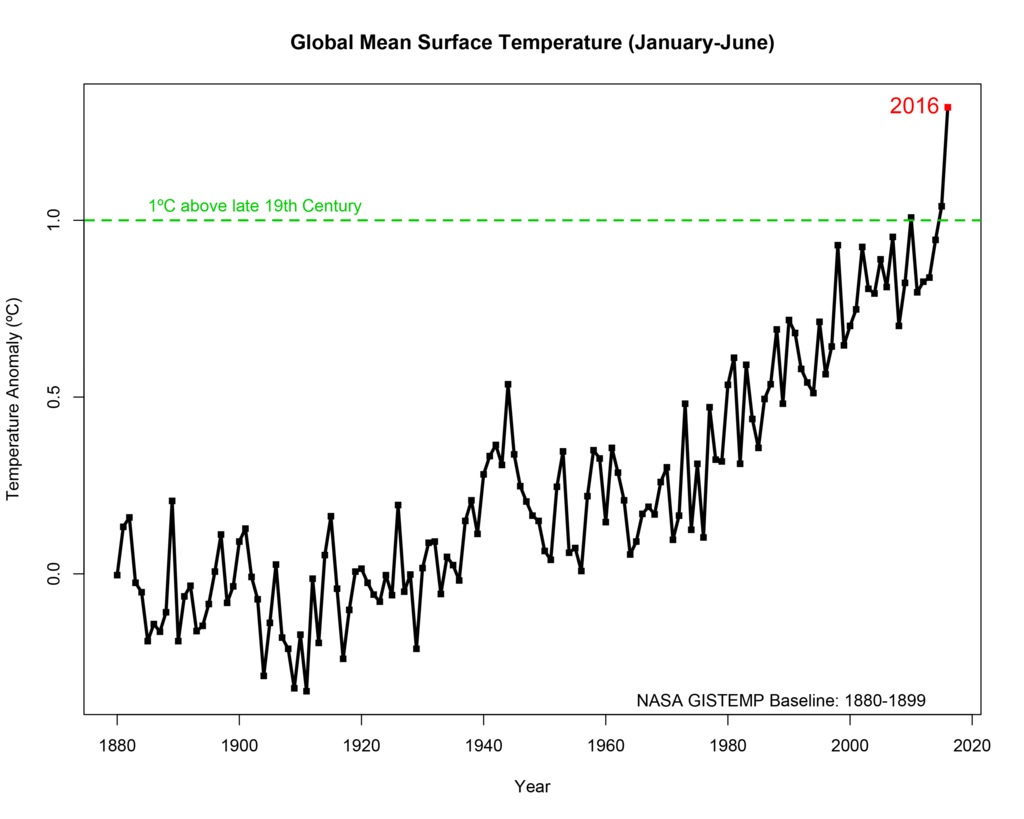
In 2016 global average temperatures were 1.1c above the pre industrial levels
Gaoth Laidir wrote: » D'oh! It doesn't say what scale he was using, but he went on to say we're about 9 degrees warmer than the last Ice Age, so that would imply he was using Celsius (see below).
Even though an increase of a few degrees in global average temperature does not sound like much, global average temperature during the last ice age was only about 4 to 5 °C (7 to 9 °F) colder than now.https://royalsociety.org/topics-policy/projects/climate-change-evidence-causes/question-17/
Nope, the Greenland Ice Sheet is not losing ice as rapidly anymore.http://nsidc.org/greenland-today/2018/04/2017-review-and-2018-season-kick-off/
Yet you're only too happy to quote the top of the RCP8.5 temperature forecast when it suits.
Barely keeping up with the lower members, well below the mean. Statistically that is significant. Anyone will tell you that. If the sun comes back it may get off the bottom, but what about when the sun goes quiet again? Back down to the bottom we go. Taken out 80 years into the future one would expect the temperature to take a path below the means of the higher RCPs.
Akrasia wrote: » The commonly accepted figure is a global average temperature difference of about 9 degrees farhenheit. I don't know what your graph shows. It could be a northern hemisphere graph. That quote almost certainly referred to farhenheit, not celsius.
I don't accept your analysis on this.
I don't think you calculated the slope correctly, and one graph looking at one aspect of the ice loss is insufficient to draw a conclusion anyway, and there are loads of recently published papers discussing how greenland ice loss is accelerating.
There is a new mechanism called marine ice cliff instability for example which allows for rapid ice loss as the buttressing effect along the coast of greenland is lost due to warmer seas.https://www.sciencedirect.com/science/article/pii/S0921818115000521https://www.nature.com/articles/ncomms14730
I quote the findings of published studies in good journals
even the bottom of the range of RCP 8.5 scenarios with a climate sensitivity of about 3c is still a very very serious situation to find ourselves in.
Gaoth, not only does the climate science need to be wrong for your 'it's not so bad' outlook to be correct, the climate science needs to be spectacularly wrong
The most conservative scientific estimate that the Earth’s temperature will rise 1 to 7 degrees in the next 30 years, said Brown.
Gaoth Laidir wrote: » By the way, Akrasia, that quote from 1989 said "1 to 7 degrees rise in the next 30 years ", so whether it's °F or °C, it was still spectacularly wrong.
Akrasia wrote: » You're taking this fragment of a sentence way too literally. When scientists talk about an increase in temperatures like this its always in relation to a reference period, and the standard reference period is the 1880 1999 mean.
But let's pretend that this one guy decided to take the year of his interview as a base temperature and extrapolate from there. Well, we've increased by very close to 1 degree Fahrenheit since 1989.
Akrasia wrote: » But let's pretend that this one guy decided to take the year of his interview as a base temperature and extrapolate from there. Well, we've increased by very close to 1 degree Fahrenheit since 1989.
Gaoth Laidir wrote: » It's from NASA https://earthobservatory.nasa.gov/Features/GlobalWarming/page3.php He was referring to the rise over the last 8,000 years, which from that record was more like 9 or 10 degrees.
Of course you don't, the same way you don't accept me posting when a month is cold. But you were talking about melting of the Greenland ice sheet so I posted a graph showing the last 40 years of melt data. Forget the slope, look at the annual figures. Last year was lower than any year of in the past 20 years. 2012 was excessive. The other years relatively stable. How can you say the melt is still accelerating?
Ah, that's handy. So we've now moved from talking about melt and are now looking for fodder in a "new" mechanism. That wouldn't be because of the lower melt shown above, would it?
But at the moment even that is looking unlikely.
It hasn't shown to be spectacularly right so far, now has it? You tried the old Celsius v Fahrenheit sleight of hand earlier to try to take the heat off the outlandish hyperbole from the late 80s, and it failed spectacularly on you.
You can adjust the sensitivity whatever way you like, as you suggested, but for the moment, based on observational fact, not theory, I'm inclined to lie furthest from the the hyperbole end that you so love. In the end of the end, somewhere in the middle is probably the most likely scenario.
Gaoth Laidir wrote: » Please, you're making stuff up now. Where did he say that? I didnt take any fragments of one sentence out of context. Read it for yourself. https://apnews.com/bd45c372caf118ec99964ea547880cd0
And I've never heard of the 1880-1999 mean being used before.
So now it's only close to 1 Fahrenheit. Going down all the time. So he was wrong.
In 2016 global average temperatures were 1.1c above the pre industrial levels (which is what he was referring to) so his statement was more or less accurate.
In this report the terms pre-industrial and industrial refer, somewhat arbitrarily, to the periods before and after 1750, respectively.
A graph of the global mean surface temperature for the six-month period of January through June of each year from 1880-2016. The numbers are the differences from the pre-industrial era, calculated as the average mean surface temperature of 1880-1899.
Akrasia wrote: » I took the effort to check the source of that graphic. Jouzel et al 2007. That paper refers to Antarctic temperatures. The Global average temperature difference between today and the last ice age was about 4-5c or about 9f.
Ice loss is accelerating. Look at the papers I posted. You are looking at one metric and not all the others. Ice loss happens through sublimation iceberg calving, reduced precipitation, surface melting, and also subglacial melting and 'firn layers' which affect how quickly internal melting can leave the ice sheet amongst other mechanisms.
It is handy. Because I am on the side of truth, I can utilise all the mechanisms that cause ice loss in greenland. You are looking for data that only suits your version of events, so you need to focus only on certain graphs that you think shows declining melt area, while avoiding talk about the other mechanisms of greenland ice loss and refusing to acknowledge that greenland ice volume loss is accelerating as discussed in multiple peer reviewed scientific papers, which is the entire point I was trying to make..
What do you think the climate sensitivity figure is btw? Your pal Ray Bates' figure of 1c? The figure that we've already reached way before we've actually doubled CO2 concentrations?
Sleight of hand? Where exactly does it say he is using Celcius? Is this how scientific you are? You're the one who embarrassed himself jumping headfirst into the denialist propaganda of dragging up old interviews and misrepresenting them.
It's likely to be somewhere near the middle, but the risks that it will be worse are unacceptable. You dismissed a paper that you thought said that there was a 25% chance that we'd overshoot the worst case scenario. If there was a 25% chance that the sandwich you are gonna have for lunch was going to give you a dose of food poisoning, you wouldn't eat the sandwich.
Akrasia wrote: » I'm not making things up and i did read it. The part of the that news report wasn't even quote from Brown, it was a paraphrase of what he said (there are no quotation marks). The only direct quotes from Brown are fragments of sentences and paragraphs with context added by a journalist who may not have understood the nuances of what he was saying.
It would have been useful if the reporter had mentioned what scale Brown was using, but as it stands, we have 'skeptics' simply assuming he meant celsius when it is clear to me he was using Fahrenheit. If the scale is Fahrenheit, his statements are in line with the scientific consensus at the time. If the scale is celsius, then he is being alarmist beyond what the evidence supports. Before you trust what the climate change denier blogs say about this topic, you should give the scientist the benefit of the doubt that he actually knows what he's talking about, An American talking to the American Media gets reported in the temperature scale that Americans typically understand.
The concept of climate sensitivity is based on a doubling of CO2 from 280ppm. 280ppm is seen as the stable pre-industrial atmospheric concentration and this started to increase in the 2nd half of the 19th century, so the baseline temperature is set at the 2nd half of the 19th century. Sometimes it's the 1850 to 1900 mean, sometimes it's the 1880 - 1899/1900 mean, the differences between these values is small. The IPCC refers to pre-industrial as before 1750 but the baseline period for temperature increase relating to increasing CO2 is the 2nd half of the 19th century
Based on the reporting in this interview, you don't know what the baseline for this man's temperature increase was. It is not stated, so you can 'fill in the gaps' to make him look foolish, or you can do him justice and assume he was using one of the common baseline periods relating to pre-industrial or climate sensitivity He was only wrong if you make a whole load of unjustified assumptions about what he meant in that interview. You're doing what the 911 'truthers' did when they quote the fire-chief saying 'we are going to pull the building' Instead of looking to see what he actually meant to say, you are imposing a meaning that suits what you want him to have said.
dense wrote: » Earlier we were told that: I asked for some figures to turn that from being a pointless green slogan into something meaningful. Not surprisingly, no figures have been supplied yet. Its no surprise because agreement doesn't exist about either what pre industrial actually means, and what the actual average global temperature was then. Which all goes to shows how this green hobby horse about limiting a temperature rise to below 2° above unknown and undefined "pre industrial" temperatures is empty nonsense. From the IPCC:https://www.ipcc.ch/publications_and_data/ar4/wg1/en/annexessglossary-e-o.html And from NASA, here's a silly graph with 1880 "global" temperatures (from the NH, because the SH records for the period are basically non existent) latched onto modern "global" temperatures observed from ground and satellite, along with an unexplained 19 year span between 1880 and 1899 being arbitrarily chosen as being the pre industrial era.https://svs.gsfc.nasa.gov/12305 This, as you can see, is pretty much all make it up as you go along stuff.
Gaoth Laidir wrote: » If it is only Antarctica then it's very misleading as they show it in the context of speaking about global temperatures, without reference to Antarctica. The axis just states "Temperature Anomaly".
You were talking about ice melt, not loss. I therefore losted data on melt. If you were talking about the surface mass balance, this is made up of much more than melt, with precipitation patterns being one of the main contributors. Precipitation has decreased in recent decades, which is one of the main reasons for the decreasing mass. This decrease is NOT accelerating, as you make out. It's a fairly linear decreasing trend, which is different. Again, we were talking about melt. And again, the ice loss is not accelerating.
We've reached 1 degree by ghc only? What about the early 20th century half-degree of warming, which was not anthropogenic?
Where does it say he's using Fahrenheit? The interview popped up in the context of exaggerated predictions, the likes of which gangsters like Al Gorey ran with 15-20 years ago. I'm not misrepresenting it, it's there for all to judge.
I think food poisoning is a hell of a lot more serious and likely than another degree or so of warming.
Gaoth Laidir wrote: » There are a lot of probablys and may nots in your own analysis of that story. Now you're implying that the reporter maybe didn't fully understand what he was reporting on. Or maybe he did, and and he reported it accurately.
Yes, it would have saved us all a lot of hassle. Now, did Al Gorey use Celsius or Fahrenheit in his film?
You originally said 1880-1999.
He said "will warm 1 to 7 degrees in the next 30 years". If the ECB said interest rates will rise 0.5% in the next year, what would that mean to you?
Akrasia wrote: » When anyone referring to the paris accord says we need to keep temperatures to below a 2c warming, they're not saying form the day they are speaking, it's a 2c warming from the base period.
dense wrote: » LOL!! Has the penny finally dropped?? The accord doesn't define the "base period" it is using when it refers to the "pre industrial" period. Therefore, talking about limiting (or measuring) temperature rises from a non defined period is quite meaningless.
Akrasia wrote: » its not meaningless, it's vague, but not meaningless.
In 2016 global average temperatures were 1.1c above the pre industrial levels.
dense wrote: » So, just to recap, and correct me if I'm wrong, you're saying that the Paris agreement is one which is meaningful and vague. And, that comparing today's temperature observations combined from satellite and surface global observations to localised historic observations composed primarily of Northern Hemisphere records from some universally undefined pre industrial era is what enables you to claim that: And when you describe 280ppm as being the natural level of C02, what you're indicating is that you have decided that humans and their use of natural resources is unnatural. It's all pretty weird, left field stuff when taken in the round, wouldn't you agree?
Akrasia wrote: » No.
dense wrote: » A negative reponse is not unexpected, at least on a public forum; and it's brevity leads me to conclude that my unsuccessfully disputed summation has been accepted in private.
Akrasia wrote: » It was posted directly under an image of ice core bubbles in relation to vostok ice cores. the source for the graph was also given. You could have checked it yourself. Are you now prepared to accept that this guy was talking in Fahrenheit rather than celcius?
What difference does it make if the ice loss is by surface melt, or sub-glacial melt or calving or precipitation reduction or sublimation or any of the other ways the greenland Ice sheets are disappearing. When they're gone, that water will be added to the global ocean levels. You can say greenland ice loss isn't accelerating all you like, but I have posted several recent papers discussing the accelerating ice loss.
Whatabout this?, whatabout that?. Where's the ice age we were supposed to have because of the cooling sun. Climate sensitivity calculations include natural variability in the equations. If you want a simple figure for radiative forcing, this is much lower than the figure for climate sensitivity. Sensitivity figures include feedbacks and natural processes, and whether they are large enough to offset the increased radiative forcing.
Lets stick to this interview. Why are you so prepared to take his statements in their least charitable light? The only reason to choose celsius is if you want to make him look like an idiot. If you want to understand him in context, use the temperature scale that makes sense. This is actually very illuminating. Your perception of risk is hopelessly skewed. The vast majority of cases of food poisoning cause a short unpleasant illness followed by a full recovery. In very rare cases, food poisoning is fatal, but if you were told there is a 25% chance your sandwich will give you food poisoning, you immediately assumed it would be a fatal dose, rather than one that gives you and upset stomach and a bad day. And even if you knew it was the mildest dose of food poisoning, you still wouldn't eat the sandwich, because a 25% risk is too high even if there's a 75% chance nothing will happen. An additional 1c of global warming is guaranteed to cause severe economic, ecological, sociological and political disruption, and once we cause it, we are stuck with it for hundreds of years. And the study didn't mention another degree or so of warming, it said that the worst case scenario had a 35% chance of understating the problem, so it's adding additional problems to an already disasterus scenario.
Akrasia wrote: » I'm surprised you've never heard of it being used as a baseline before. Your pal Dense just posted a graph that referred to it.
two completely different sentences. Go back to the link you posted where you were trying to claim that global average temperatures was 9c colder in the last ice age. Here's what the page says at the bottom "Models predict that Earth will warm between 2 and 6 degrees Celsius in the next century. " Does this mean that they are saying temperatures will be between 2 and 6 degrees warmer than whenever the page was written (some time after 2007 given the references they used)? No, it means between 2 and 6 degrees warmer than the base period. When anyone referring to the paris accord says we need to keep temperatures to below a 2c warming, they're not saying form the day they are speaking, it's a 2c warming from the base period. Scientists use short hand statements sometimes falsely assuming that the audience understands the context of those statements. It is extremely easy to make a scientist look like an idiot by taking everything he/she says literally and ignoring context or commonly understood subtext. This is what Ali G did.
Gaoth Laidir wrote: » You still haven't twigged that I've been referring to your typo all along. 1999. Agree to disagree on this too. The Paris Accord is one thing, where reference to pre-industrial levels (?) is by now firmly embedded in the discussion, but I still firmly believe that back then the UN guy was referring to the next 30 years.