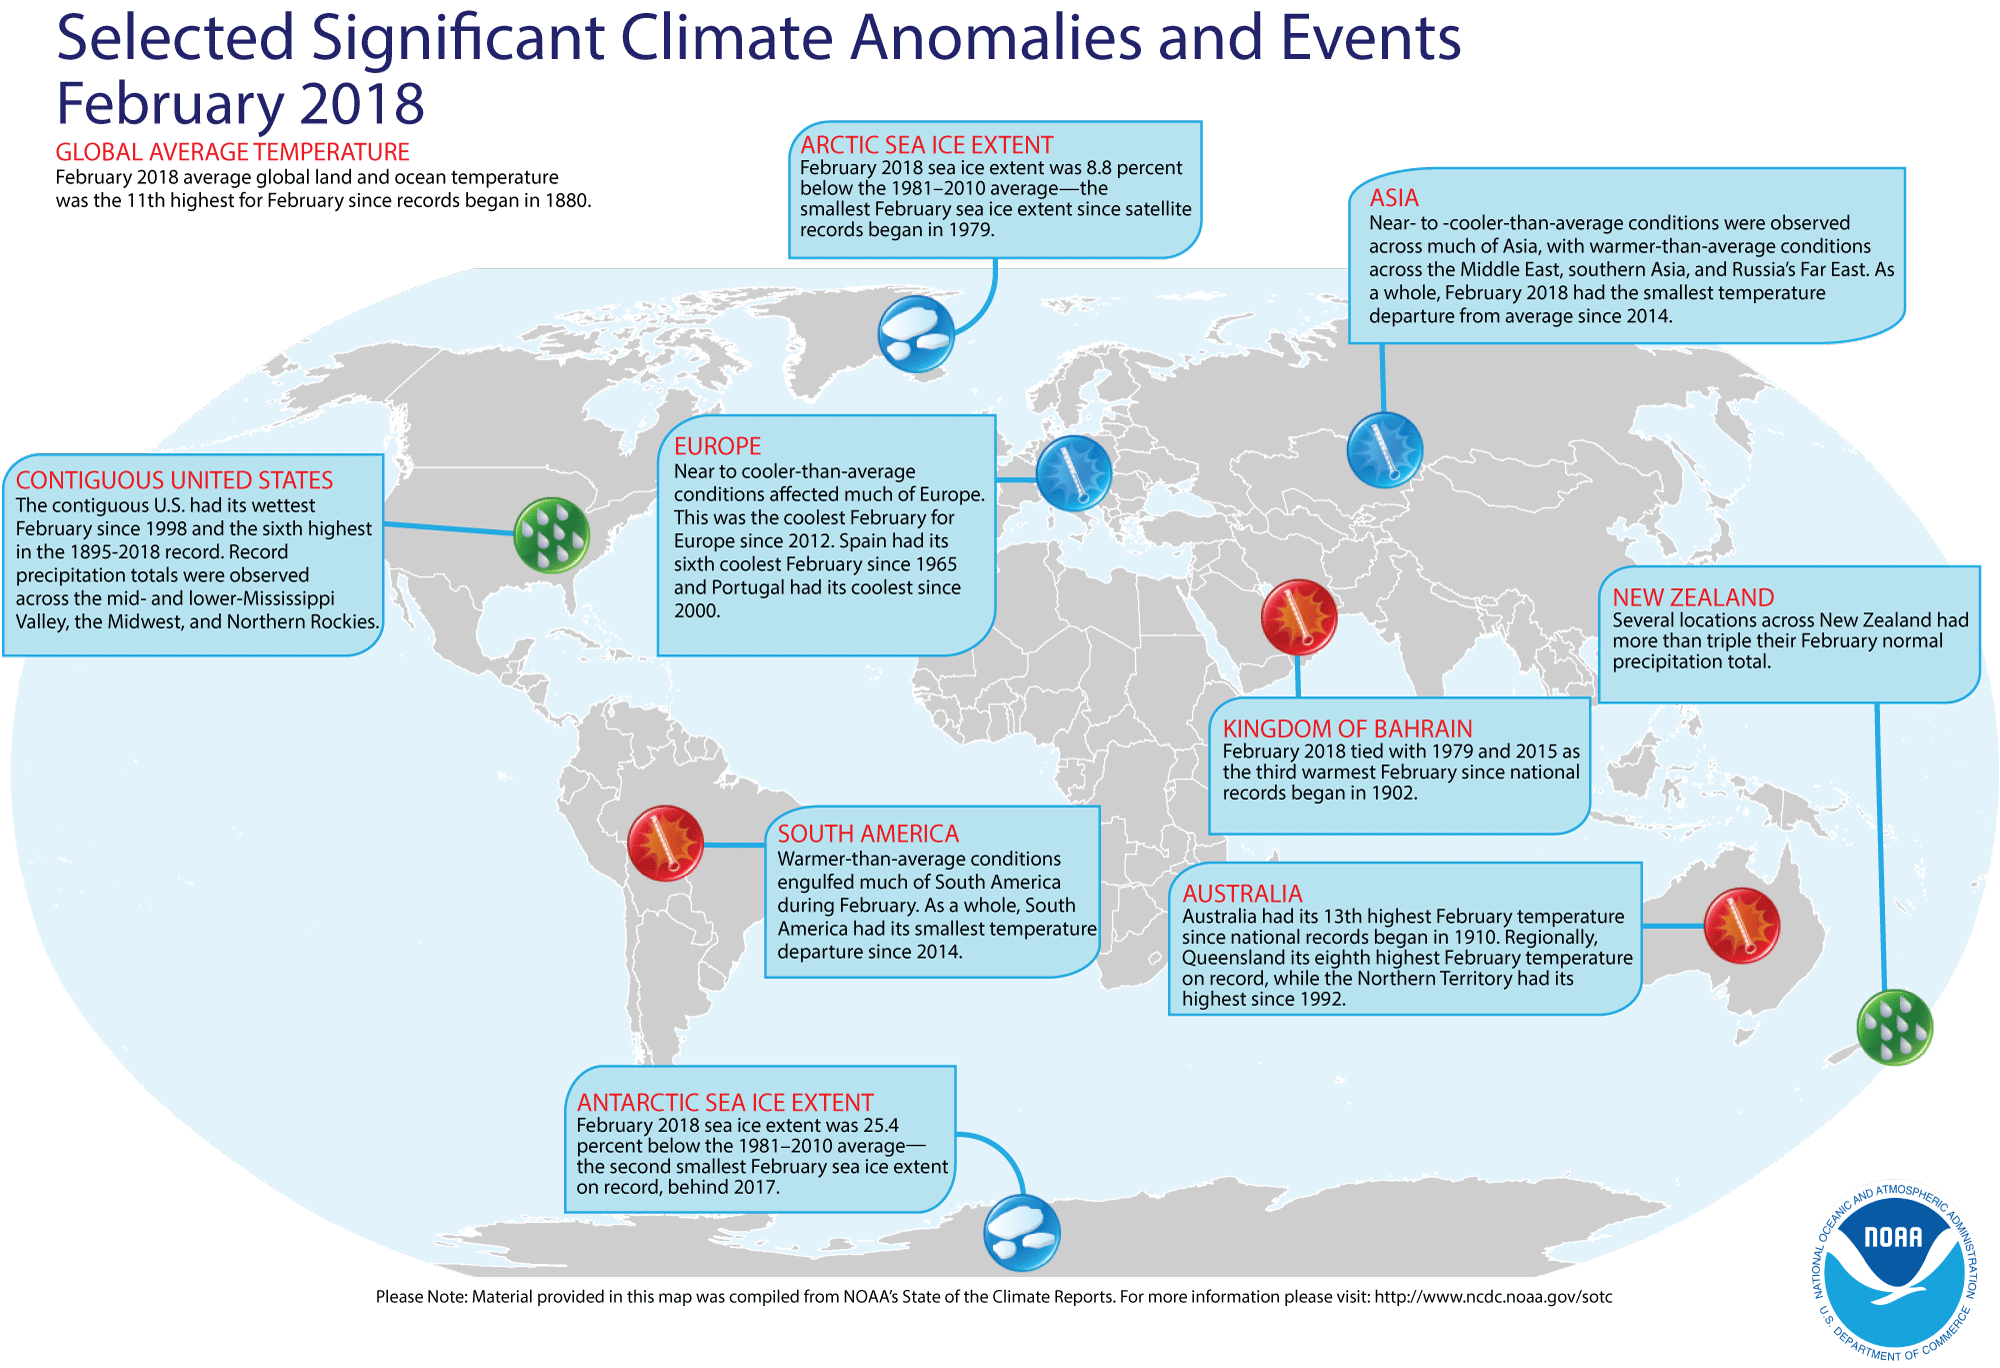
dense wrote: » It was the 11th warmest February since 1880 according to NOAA.
Akrasia wrote: » Sorry, you're right, NOAA has feb as the 11th warmest february on record, I was looking at the year to date data which had Feb at 6https://www.ncdc.noaa.gov/sotc/global/2018/02/supplemental/page-1 The point I was making was that even though Ireland's had below average temperatures, other parts of the world were significantly above average, and the february global temperature is still significantly above the 20th century average.
dense wrote: » Pity about all the "missing data" they don't have, which they show as grey in their world map.
And what they do have doesn't seem to be terribly accurate at least for Ireland, according to UCD lecturer Peter O'Neill:https://oneillp.wordpress.com/2017/02/09/ghcn-m-raw-data-from-ireland/ Which would have to make you worry about what they're doing with other data. But regardless, take a close look at that map. Given that the earth is covered by around 30% of land, and NOAA's empty global "temperature map" indicates that it' sampling a tiny 10% to 15% of the earth and claiming global warming from it, you should take their claims of 11th warmest February or anything else on record with a large dose of salt.
Pa ElGrande wrote: » https://www.youtube.com/watch?v=C-x4YbXZtIA The Greenhouse Conspiracy was made in 1990 by Channel 4 as part of their Equinox series. 28 years later nothing has changed.
Akrasia wrote: » This map refers to GHCNM records only. This is only one temperature dataset and it is the oldest one with the lowest global coverage.
GHCN-Monthly provides climatological observations for four elements; monthly mean maximum temperature, minimum temperature, mean temperature, and monthly total precipitation.
Akrasia wrote: » RSS, for example has global coverage using Satellite measurements.
Researchers from Remote Sensing Systems (RSS), based in California, have released a substantially revised version of their lower tropospheric temperature record. After correcting for problems caused by the decaying orbit of satellites, as well as other factors, they have produced a new record showing 36% faster warming since 1979 and nearly 140% faster (i.e. 2.4 times larger) warming since 1998.
Akrasia wrote: » You need to take Dense's analysis of the state of our knowledge with a larger dose of salt.
Akrasia wrote: » There are multiple sources for climate data that are all taken into account and cross checked against each other to generate the temperature records. There are multiple agencies who generate their own datasets independently and they all make decisions about how to blend the data and exlude outliers or instrumentation errors and they all broadly agree that global temperatures are increasing at about .18c per decade (accelerating in recent decades)
Akrasia wrote: » Even UAH, Roy Spencers, a darling of the 'skeptic' community, temperature record agree with this after having been convinced to take into account the errors in their analysis and they have updated their temperature records to come more into line with the other datasets.
The graph above represents the latest update; updates are usually made within the first week of every month. Contrary to some reports, the satellite measurements are not calibrated in any way with the global surface-based thermometer records of temperature. They instead use their own on-board precision redundant platinum resistance thermometers (PRTs) calibrated to a laboratory reference standard before launch.
This website currently concentrates on the response of clouds to warming, an issue which I am now convinced the scientific community has totally misinterpreted when they have measured natural, year-to-year fluctuations in the climate system. As a result of that confusion, they have the mistaken belief that climate sensitivity is high, when in fact the satellite evidence suggests climate sensitivity is low.
Akrasia wrote: » It's like arguing with a goldfish. Dense, you've already been told on another thread that the GHCN is only one of a number of datasets used by climatologists. You were told in the post you are replying to that the GHCN is amongst the oldest with some of the least coverage of the different datasets, but you don't seem to grasp these concepts.
Akrasia wrote: » Here is a partial list of the different datasets that are used to compile temperature data around the world.
Akrasia wrote: » RSS adjusted raw satellite data when we discovered that their orbits were changing and this affected their measurements.
dense wrote: » What "concepts"? The concept of believing that vast areas of earth devoid of GCHN instrumentation are somehow showing you a GHCN map in tenths of degrees of human induced "global warming"? And displaying accurate precipitation trends, based on non existent GHCN stations?
No, it's primarily a list of national US weather services, with a few partial global sets thrown in and it also includes the rather dubious USHCN data, with 42% of its stations failing to meet standards. And I wouldnt be getting too excited by all those 85, yes 85 radiosonde ballons in RATPAC supposedly covering the whole earth, which even the UNIPCC doesn't seem too interested in due to quality issues.https://www.ipcc.ch/publications_and_data/ar4/wg1/en/ch3s3-4-1-1.html
Akrasia wrote: » No, the concept of using multiple datasets to construct a temperature record. And you never mentioned GHCN, I did, you said this "Pity about all the "missing data" they don't have, which they show as grey in their world map." In that post you were trying to make it look like the NOAA don't have data for the majority of the world. You were either lying or ignorant of the other datasets (which you can't be because I told you about them before)
Akrasia wrote: » Wrong again, there are lots of global data in those datasets, and the curators of global temperature records use all of them together to generate a global temperature record.
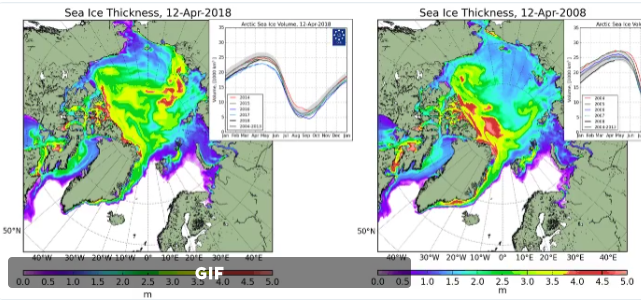
Pa ElGrande wrote: » The Arctic melting season each year is ~70 days each year good luck trying to shift this from the Arctic sea. The ice today is clearly thicker than it was 10 years agoSea ice thickness and volume https://www.youtube.com/watch?v=AR97X0n7FMY Arctic sea ice and temperature is cyclical, and tracks ocean circulation patterns rather than greenhouse gases.
paddyisreal wrote: » A quick question in relation to this debate. How accurate can a lot of these historically weather stats be when the period they are taking from is so small in the scheme of things. Considering that humans are on earth for around 200,000 years and a lot of this data seems to be from the last 200 years , should it not all be taken with a pinch of salt. ?
dense wrote: » Isn't it funny the way climate alarmists visualise -48°c as Burning Red Hot on their various charts?
Akrasia wrote: » And scientists have a very clear understanding of radiative forcing attached to CO2 so we know that CO2 will cause the planet to store more heat, the only uncertainty is how the climate feedbacks will behave in a warmer world. Skeptics think the feedbacks will all be negative (ie cooling) and real scientists think that there will be a mixture of some negative feedbacks but a strong positive feedback signal leading to a likely climate sensitivity of somewhere close to 3c for a doubling of CO2
. A doubling in atmospheric carbon dioxide (CO2), predicted to take place in the next 50 to 100 years, is expected to change the radiation balance at the surface by only about 2 percent. Yet according to current climate models, such a small change could raise global mean surface temperatures by between 2-5°C (4-9°F), with potentially dramatic consequences. If a 2 percent change is that important, then a climate model to be useful must be accurate to something like 0.25%. Thus today's models must be improved by about a hundredfold in accuracy, a very challenging task. To develop a much better understanding of clouds, radiation and precipitation, as well as many other climate processes, we need much better observations.
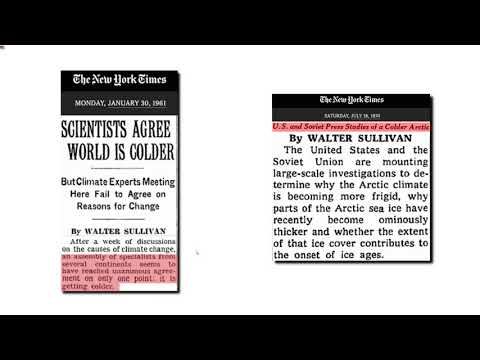
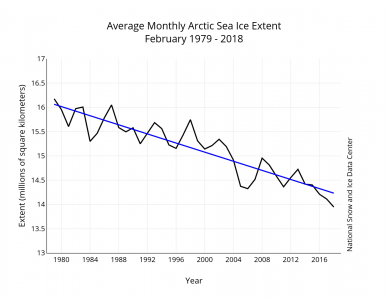
Akrasia wrote: » Here's a 20th century reconstruction based on shipping and aircraft reports The DMI model statistic which your blogger copied from another blogger is just cherrypicking. The trend in PIOMAS, Cryosat and the DMI are all for decreasing ice extents and ice volume even if there is some inter annual variability
Akrasia wrote: » Here's the arctic sea ice volume graph since the ice monitoring satelites were launched Here's a 20th century reconstruction based on shipping and aircraft reports The DMI model statistic which your blogger copied from another blogger is just cherrypicking. The trend in PIOMAS, Cryosat and the DMI are all for decreasing ice extents and ice volume even if there is some inter annual variability
"Sure, it is warming, which is consistent with sea ice loss, reductions in spring snow cover and strengthening summer melt of the Greenland ice sheet, but pieces of the puzzle are still missing. This could very well be one of those missing pieces."
Gaoth Laidir wrote: » You wouldn't have the up-to-date version of that graph, would you? It's missing the last 11 years.
dense wrote: » Cherry picking?
Akrasia wrote: » I don't, I grabbed the graph off an EU science education website, have the last 11 years been significantly different?
Gaoth Laidir wrote: » No, the trend is still downwards, but I have a thing about people quoting old data like that. I checked your source and it doesn't have an update, and I can't find that type of chart on the NOAA site. But anyway, it's already been shown thay the very flat-looking pre-satellite record is anything but.
Akrasia wrote: » You implied that I was cherry picking, and that implication was picked up and ran with by others on this thread. I don't think that was fair given that I included a newer graph to go alongside the older graph in the same post and I only used the older graph to show that the decline is not normal at least on human timescales.