Gaoth Laidir wrote: » But...but...just a few days ago you said to me that you... ... So for that reason it's move along, nothing to see here, yes?
Akrasia wrote: » Did you read the study?
Gaoth Laidir wrote: » Of course. Why?
enfant terrible wrote: » Does this mean we will be getting a lot more heatwaves during our Irish summers? That would be great.
Akrasia wrote: » Because you didnt refer to the study at all in your reply. The underlying physics of climate change is not in doubt to any great extent. Warmer air holds more water. Rainfall events when they happen, will be more intense. The uncertainty regarding irish climate is in the frequency and distribution of these events given that were on the edge of a continent and our weather is inherently changeable on the frontier of oceanic and continental air masses. This study looked at scenarios and discussed them based on their impact and how frequently they showed up in the models. The study shows the potential for severe flooding in the high impact events but even in the low impact scenarios there is a very significant increased flood risk for Ireland.
“We are already seeing at first hand the implications of extreme weather events in our capital cities. In Paris the Seine rose more than 4 metres above its normal water level. And as Cape Town prepares for its taps to run dry, this analysis highlights that such climate events are feasible in European cities too.”
gluppers wrote: Are we possibly talking 2010 levels here?
Gaoth Laidir wrote: » I was pointing out the fact that when it suits you disregard localised forecasts for Ireland, yet a few days later you're happy to quote a study that not only refers to Ireland but pinpoints cities. Which is it? Most of the problem with city flooding is down to development issues and blockage/redirection of flood channels. More people using the same systems means more problems. Lack of maintenance of such systems (e.g. the annual blockage due to leaves in Autumn. Developments on natural flood plains. Lack of construction of flood defenses. Lack of dredging of the Shannon. And so on. I especially like this comment: So she's able to attribute single events like Paris flooding to GHGs? Cape Town's water issues likewise? I didn't see any references to back up these claims. It's a paper full of more horror stories as it's designed to deliver maximum impact to policy makers. The study, and of course your quotes, focus on the very highest impact figures of RCP8.5. That is unlikely to occur. Have YOU read the whole paper or just the summary you linked to?
dense wrote: » Climate change responsible for decrease in Alaska snowfalls.https://www.fws.gov/alaska/climate/inak.htm Climate change responsible for increase in Alaska snowfalls.https://www.scientificamerican.com/article/climate-change-has-doubled-snowfall-in-alaska/
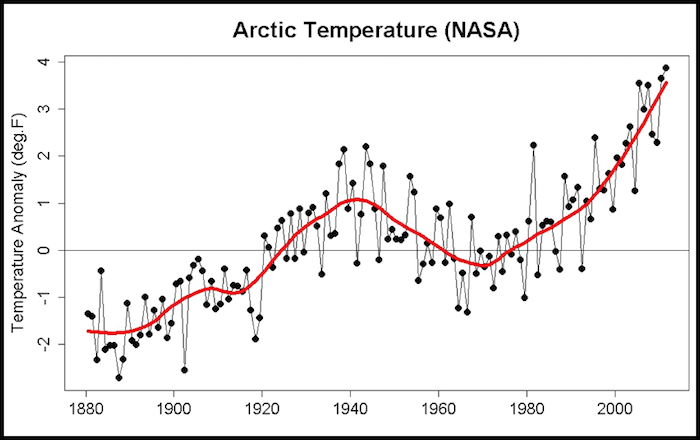
Observed warming in Alaska has been accompanied by a 30% increase in precipitation between 1968 and 19901. Total precipitation in the Arctic has increased at a rate of about 1% per decade over the past century. However, on the Kenai Peninsula, precipitation records between 1944 and 2002 indicate a nearly 40% decrease in the mean annual water balance, which is the difference between precipitation and potential evapotranspiration4.
sryanbruen wrote: » That would depend on a lot of normal external factors that influence our weather on a monthly, daily, annual basis etc like the NAO setup which has been unusually and frequently negative for every Summer since 2007 bar 2013 and 2017, never mind things like climate change or global warming.
Gaoth Laidir wrote: » I was pointing out the fact that when it suits you disregard localised forecasts for Ireland, yet a few days later you're happy to quote a study that not only refers to Ireland but pinpoints cities. Which is it?
Most of the problem with city flooding is down to development issues and blockage/redirection of flood channels. More people using the same systems means more problems. Lack of maintenance of such systems (e.g. the annual blockage due to leaves in Autumn. Developments on natural flood plains. Lack of construction of flood defenses. Lack of dredging of the Shannon. And so on. I especially like this comment: So she's able to attribute single events like Paris flooding to GHGs? Cape Town's water issues likewise? I didn't see any references to back up these claims. It's a paper full of more horror stories as it's designed to deliver maximum impact to policy makers.
The study, and of course your quotes, focus on the very highest impact figures of RCP8.5. That is unlikely to occur.
Have YOU read the whole paper or just the summary you linked to?
Akrasia wrote: » In this instance, Alaska overall is seeing a very significant increase in precipitation, but one region has seen a big shift in water balance, which means that the rate of water loss from evapotranspiration has increased while precipitation has decreased due to local climactic factors. For him to say that these two sources contradict each other is completely misrepresenting these sources.
sryanbruen wrote: » Far wider area of thicker ice this year than 10 years ago.
Abstract Ice-core records show that climate changes in the past have been large, rapid, and synchronous over broad areas extending into low latitudes, with less variability over historical times. These ice-core records come from high mountain glaciers and the polar regions, including small ice caps and the large ice sheets of Greenland and Antarctica. As the world slid into and out of the last ice age, the general cooling and warming trends were punctuated by abrupt changes. Climate shifts up to half as large as the entire difference between ice age and modern conditions occurred over hemispheric or broader regions in mere years to decades. Such abrupt changes have been absent during the few key millennia when agriculture and industry have arisen. The speed, size, and extent of these abrupt changes required a reappraisal of climate stability. Records of these changes are especially clear in high-resolution ice cores. Ice cores can preserve histories of local climate (snowfall, temperature), regional (wind-blown dust, sea salt, etc.), and broader (trace gases in the air) conditions, on a common time scale, demonstrating synchrony of climate changes over broad regions.
The Greenland records show that climate changes have been very large, rapid, and widespread. Coolings were achieved in a series of steep ramps or steps and warmings in single steps. The more dramatic of the warmings have involved ≈8°C warming (8, 25) and ≈2× increases in snow accumulation (9), several-fold or larger drops in wind-blown materials (17), and ≈50% increase in methane, indicating large changes in global wetland area (5, 24). For the best-characterized warming, the end of the Younger Dryas cold interval ≈11,500 years ago, the transition in many ice-core variables was achieved in three steps, each spanning ≈5 years and in total covering ≈40 years (26). However, most of the change occurred in the middle of these steps. The warming as recorded in gas isotopes occurred in decades or less (8). The most direct interpretation of the accumulation-rate record is that snowfall doubled over 3 years and nearly doubled in 1 year (9). Several records show enhanced variability near this and other transitions, including “flickering” behavior in which climate variables bounced between their “cold” level and their “warm” level before settling in one of them (27).
Around 15,000 years ago, the Earth started warming abruptly after ~ 100,000 years of an "ice age"; this is known as a glacial termination. The large ice sheets, which covered significant parts of North America and Europe, began melting as a result. A climatic optimum known as the "Bölling-Allerød" was reached shortly thereafter, around 14,700 before present. However, starting at about 12,800 BP, the Earth returned very quickly into near glacial conditions (i.e. cold, dry and windy), and stayed there for about 1,200 years: this is known as the Younger Dryas (YD), since it is the most recent interval where a plant characteristic of cold climates, Dryas Octopetala, was found in Scandinavia. The most spectacular aspect of the YD is that it ended extremely abruptly (around 11,600 years ago), and although the date cannot be known exactly, it is estimated from the annually-banded Greenland ice-core that the annual-mean temperature increased by as much as 10°C in 10 years.
Casualsingby wrote: » What was the state of the ice in 05,06,07,09 and 13,14,15,16,17? I'm on the fence with this subject, picking any 2 charts could yield any results for pro and against I'd imagine. And if you went back every 10 years what is like in 28th Feb 98,88,78,68,58,48,38,28,18,08 that would actually paint a clearer picture for a fence sitter like me.
dense wrote: » Retired "climate change expert" Professor John (of co2 in human breath causes climate change fame :pac::pac:) Sweeney must have been pulling his hair out watching it.
d'Oracle wrote: » He didn't say that though.
Casualsingby wrote: » Thanks Syran I will check it on laptop later too blind for phone.Edit Guessing it has mostly shrunk since 78 after reading dense post ha.


![Photo of [Deleted User]](https://w0.vanillicon.com/v2/05bfdb0bc9f81b358ccf2f55186422bb.svg)