As it's now winter and delays due to weather are on the increase, this could be a good place for any weather-related updates pertaining to aviation/airports.
Link to SIGMET map
here. Select Layers to overlay satellite, winds, etc.
Eurocontrol post twice-daily weather updates and live delay info on this pagehttps://www.public.nm.eurocontrol.int/PUBPORTAL/gateway/spec/index.htmlJeppesen Weatherhttp://www.jeppesen.com/aviation/personal/aviation-weather.jsp#
Live Satellite with clickable Metarshttp://www.ogimet.com/cgi-bin/gmsat2?lang=enWorld METAR Map (clickable)http://www.ogimet.com/gmetar_nav.phtml.enGuide to decoding METARs and TAFshttps://irishweatheronline.wordpress.com/aviation-weather-a-guide-to-metars-and-tafs/Current IR satellite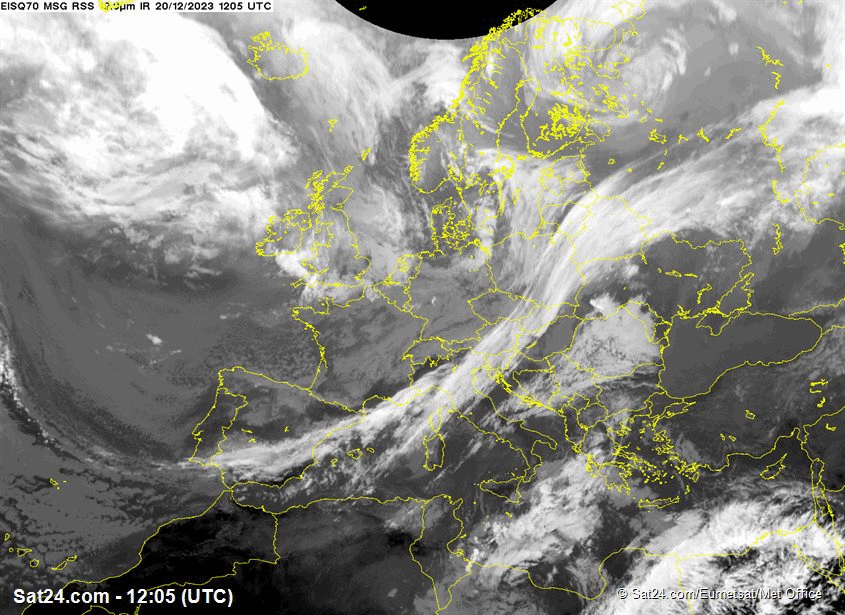 SigWX charts:
 charts showing areas of
●Strong jet stream winds (thick black lines with pennants (each worth 50 knots) and barbs (each worth 10 knots), with the Flight Level of the core marked (e.g. FL340 = 34,000 ft. Extra levels show the boundary of 80-knot winds)
●Clear-air Turbulence (CAT, numbered dashed areas, see legend for upper and lower levels),
●Areas of icing and turbulence (squiggly lines, with upper and lower levels. XXX means Below FL100),
●Tropopause heights (squared numbers, in FL), tropopause maxima and minima (pentagonal shapes)
00Zhttp://brunnur.vedur.is/flugkort/PGDE14_EGRR_0000.PNG06Zhttp://brunnur.vedur.is/flugkort/PGDE14_EGRR_0600.PNG12Zhttp://brunnur.vedur.is/flugkort/PGDE14_EGRR_1200.PNG18Zhttp://brunnur.vedur.is/flugkort/PGDE14_EGRR_1800.PNG